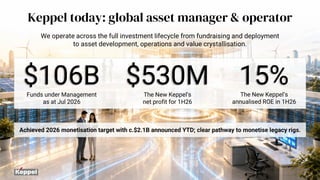
Keppel today: globalasset manager & operator
We operate across the full investment lifecycle from fundraising and deployment
to asset development, operations and value crystallisation.
Funds under Management
as at Jul 2026
$106B The New Keppel’s
net profit for 1H26
$530M 15%
The New Keppel’s
annualised ROE in 1H26
2
Achieved 2026 monetisation target with c.$2.1B announced YTD; clear pathway to monetise legacy rigs.
3.
3
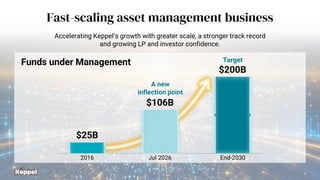
Fast-scaling asset managementbusiness
Accelerating Keppel’s growth with greater scale, a stronger track record
and growing LP and investor confidence.
Funds under Management
$200B
End-2030
A new
inflection point
$25B
2016
$106B
Jul 2026
Target
4.
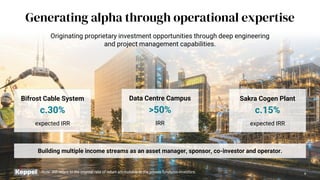
Generating alpha throughoperational expertise
Originating proprietary investment opportunities through deep engineering
and project management capabilities.
Bifrost Cable System
c.30%
expected IRR
Data Centre Campus
>50%
IRR
Sakra Cogen Plant
c.15%
expected IRR
Building multiple income streams as an asset manager, sponsor, co-investor and operator.
Note: IRR refers to the internal rate of return attributable to the private funds/co-investors. 4
5.
5
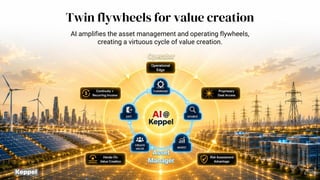
Twin flywheels forvalue creation
AI amplifies the asset management and operating flywheels,
creating a virtuous cycle of value creation.
Operator
Asset
Manager
6.
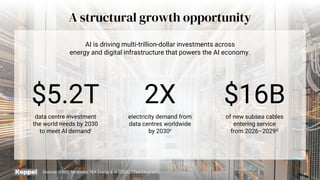
A structural growthopportunity
Sources: (USD); iMcKinsey; iiIEA Energy & AI (2025); iiiTeleGeography. 6
data centre investment
the world needs by 2030
to meet AI demandi
$5.2T 2X
electricity demand from
data centres worldwide
by 2030ii
$16B
of new subsea cables
entering service
from 2026–2029iii
AI is driving multi-trillion-dollar investments across
energy and digital infrastructure that powers the AI economy.
7.
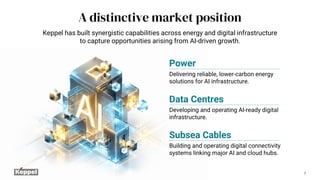
Power
Delivering reliable, lower-carbonenergy
solutions for AI infrastructure.
Data Centres
Developing and operating AI-ready digital
infrastructure.
7
A distinctive market position
Keppel has built synergistic capabilities across energy and digital infrastructure
to capture opportunities arising from AI-driven growth.
Subsea Cables
Building and operating digital connectivity
systems linking major AI and cloud hubs.
8.
8
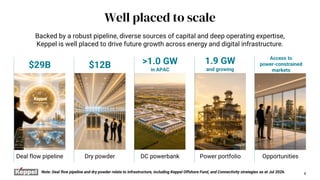
Well placed toscale
$29B $12B >1.0 GW
in APAC
1.9 GW
and growing
Access to
power-constrained
markets
Deal flow pipeline
Backed by a robust pipeline, diverse sources of capital and deep operating expertise,
Keppel is well placed to drive future growth across energy and digital infrastructure.
Dry powder DC powerbank Power portfolio Opportunities
Note: Deal flow pipeline and dry powder relate to Infrastructure, including Keppel Offshore Fund, and Connectivity strategies as at Jul 2026.
9.
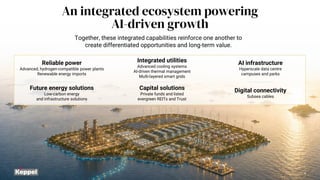
An integrated ecosystempowering
AI-driven growth
9
Together, these integrated capabilities reinforce one another to
create differentiated opportunities and long-term value.
AI infrastructure
Hyperscale data centre
campuses and parks
Integrated utilities
Advanced cooling systems
AI-driven thermal management
Multi-layered smart grids
Reliable power
Advanced, hydrogen-compatible power plants
Renewable energy imports
Future energy solutions
Low-carbon energy
and infrastructure solutions
Digital connectivity
Subsea cables
Capital solutions
Private funds and listed
evergreen REITs and Trust
10.
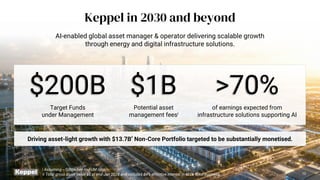
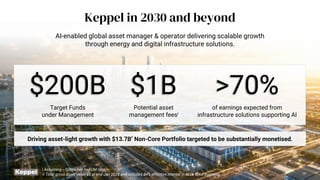
Keppel in 2030and beyond
AI-enabled global asset manager & operator delivering scalable growth
through energy and digital infrastructure solutions.
10
Driving asset-light growth with $13.7B
ii
Non-Core Portfolio targeted to be substantially monetised.
i Assuming ~50bps Fee-to-FUM ratio.
ii Total gross asset value as at end-Jun 2026 and includes 84% effective interest in M1’s telco business.
$200B
Target Funds
under Management
of earnings expected from
infrastructure solutions supporting AI
>70%
$1B
Potential asset
management feesi
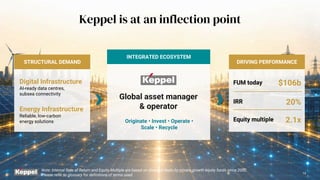
Keppel is atan inflection point
13
Note: Internal Rate of Return and Equity Multiple are based on divested deals by private growth equity funds since 2002.
Please refer to glossary for definitions of terms used. 13
STRUCTURAL DEMAND DRIVING PERFORMANCE
FUM today
IRR
Equity multiple
Global asset manager
& operator
Originate • Invest • Operate •
Scale • Recycle
STRUCTURAL DEMAND
INTEGRATED ECOSYSTEM
DRIVING PERFORMANCE
Energy Infrastructure
Reliable, low-carbon
energy solutions
FUM today
IRR
Equity multiple
Digital Infrastructure
AI-ready data centres,
subsea connectivity
$106b
20%
2.1x
13.
14
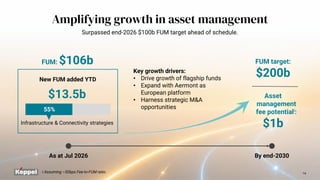
i Assuming ~50bpsFee-to-FUM ratio.
FUM target:
$200b
As at Jul 2026 By end-2030
FUM: $106b
Asset
management
fee potentiali:
$1b
New FUM added YTD
$13.5b
Infrastructure & Connectivity strategies
55%
Key growth drivers:
• Drive growth of flagship funds
• Expand with Aermont as
European platform
• Harness strategic M&A
opportunities
Amplifying growth in asset management
Surpassed end-2026 $100b FUM target ahead of schedule.
14.
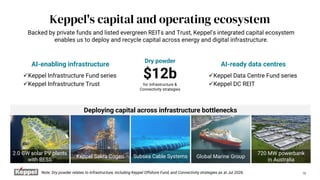
Deploying capital acrossinfrastructure bottlenecks
Keppel's capital and operating ecosystem
15
✓Keppel Infrastructure Fund series
Backed by private funds and listed evergreen REITs and Trust, Keppel’s integrated capital ecosystem
enables us to deploy and recycle capital across energy and digital infrastructure.
✓Keppel Data Centre Fund series
✓Keppel DC REIT
AI-enabling infrastructure AI-ready data centres
✓Keppel Infrastructure Trust
Subsea Cable Systems Global Marine Group
720 MW powerbank
in Australia
Keppel Sakra Cogen
2.0 GW solar PV plants
with BESS
Dry powder
$12b
for Infrastructure &
Connectivity strategies
Note: Dry powder relates to Infrastructure, including Keppel Offshore Fund, and Connectivity strategies as at Jul 2026.
15.
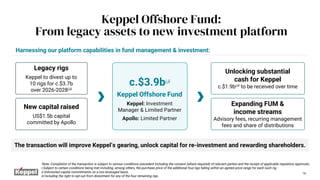
Keppel Offshore Fund:
Fromlegacy assets to new investment platform
16
Legacy rigs
Keppel to divest up to
10 rigs for c.$3.7b
over 2026-2028i,iii
New capital raised
US$1.5b capital
committed by Apollo
c.$3.9bi,ii
Keppel Offshore Fund
Keppel: Investment
Manager & Limited Partner
Apollo: Limited Partner
Unlocking substantial
cash for Keppel
c.$1.9bi,iii to be received over time
Expanding FUM &
income streams
Advisory fees, recurring management
fees and share of distributions
The transaction will improve Keppel’s gearing, unlock capital for re-investment and rewarding shareholders.
Harnessing our platform capabilities in fund management & investment:
Note: Completion of the transaction is subject to various conditions precedent including the consent (where required) of relevant parties and the receipt of applicable regulatory approvals.
i Subject to certain conditions being met including, among others, the purchase price of the additional four rigs falling within an agreed price range for each such rig.
ii Uninvested capital commitments on a non-leveraged basis.
iii Including the right to opt-out from divestment for any of the four remaining rigs.
16.
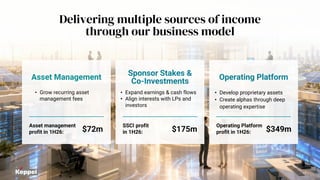
Delivering multiple sourcesof income
through our business model
17
Operating Platform
• Develop proprietary assets
• Create alphas through deep
operating expertise
Operating Platform
profit in 1H26: $349m
Sponsor Stakes &
Co-Investments
• Expand earnings & cash flows
• Align interests with LPs and
investors
SSCI profit
in 1H26: $175m
Asset Management
• Grow recurring asset
management fees
Asset management
profit in 1H26: $72m
17.
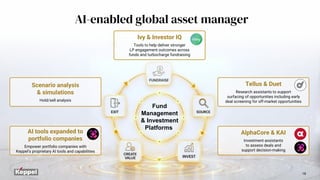
Scenario analysis
& simulations
Hold/sellanalysis
18
Fund
Management
& Investment
Platforms
Ivy & Investor IQ
Tools to help deliver stronger
LP engagement outcomes across
funds and turbocharge fundraising
Tellus & Duet
Research assistants to support
surfacing of opportunities including early
deal screening for off-market opportunities
AlphaCore & KAI
Investment assistants
to assess deals and
support decision-making
AI tools expanded to
portfolio companies
Empower portfolio companies with
Keppel’s proprietary AI tools and capabilities
AI-enabled global asset manager
18.
Keppel in 2030and beyond
AI-enabled global asset manager & operator delivering scalable growth
through energy and digital infrastructure solutions.
19
i Assuming ~50bps Fee-to-FUM ratio.
ii Total gross asset value as at end-Jun 2026 and includes 84% effective interest in M1’s telco business.
Driving asset-light growth with $13.7B
ii
Non-Core Portfolio targeted to be substantially monetised.
$200B
Target Funds
under Management
of earnings expected from
infrastructure solutions supporting AI
>70%
$1B
Potential asset
management feesi
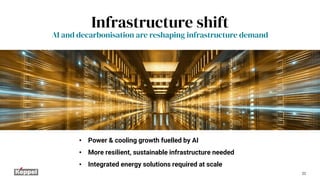
Infrastructure shift
AI anddecarbonisation are reshaping infrastructure demand
• Power & cooling growth fuelled by AI
• More resilient, sustainable infrastructure needed
• Integrated energy solutions required at scale
22
21.
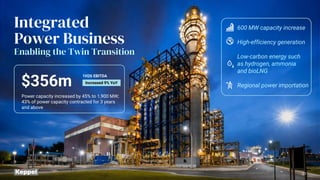
Integrated
Power Business
Enabling theTwin Transition
600 MW capacity increase
High-efficiency generation
Low-carbon energy such
as hydrogen, ammonia
and bioLNG
Regional power importation
$356m
Power capacity increased by 45% to 1,900 MW;
43% of power capacity contracted for 3 years
and above
1H26 EBITDA
Increased 9% YoY
23
22.
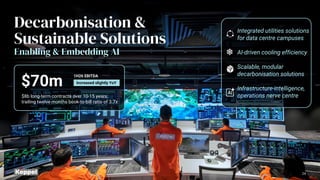
Decarbonisation &
Sustainable Solutions
Enabling& Embedding AI
$70m
1H26 EBITDA
Increased slightly YoY
$8b long-term contracts over 10-15 years;
trailing twelve months book-to-bill ratio of 3.7x
Integrated utilities solutions
for data centre campuses
AI-driven cooling efficiency
Scalable, modular
decarbonisation solutions
Infrastructure-intelligence,
operations nerve centre
24
23.
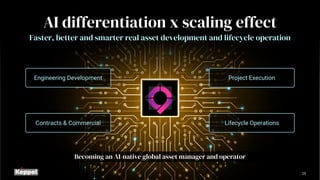
AI differentiation xscaling effect
Faster, better and smarter real asset development and lifecycle operation
Engineering Development
Contracts & Commercial Lifecycle Operations
Project Execution
Becoming an AI-native global asset manager and operator
25
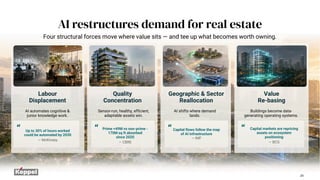
Labour
Displacement
AI automates cognitive&
junior knowledge work.
“ Up to 30% of hours worked
could be automated by 2030
— McKinsey
Quality
Concentration
Sensor-run, healthy, efficient,
adaptable assets win.
“ Prime +49M vs non-prime -
170M sq ft absorbed
since 2020
— CBRE
Geographic & Sector
Reallocation
AI shifts where demand
lands.
“Capital flows follow the map
of AI infrastructure
— IMF
Value
Re-basing
Buildings become data-
generating operating systems.
“ Capital markets are repricing
assets on ecosystem
positioning
— BCG
Four structural forces move where value sits — and tee up what becomes worth owning.
AI restructures demand for real estate
29
27.
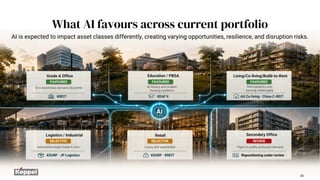
Grade A Office
FAVOURED
AIconcentrates demand into prime
KREIT
Education / PBSA
FAVOURED
AI literacy and student
housing resilience
KEAF II
Living/Co-living/Build-to-Rent
FAVOURED
Demographics and
housing undersupply
AU Co living · China C-REIT
Logistics / Industrial
SELECTIVE
Automation-ready Grade A wins
KSURF · JP Logistics
Retail
SELECTIVE
Luxury and experiential
KSURF · KREIT
Secondary Office
REVIEW
Flight to quality pressures demand
Repositioning under review
AI is expected to impact asset classes differently, creating varying opportunities, resilience, and disruption risks.
What AI favours across current portfolio
30
28.
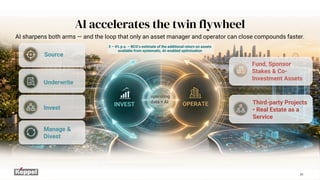
OPERATE
operating
data × AI
INVEST
AIsharpens both arms — and the loop that only an asset manager and operator can close compounds faster.
AI accelerates the twin flywheel
Source
Underwrite
Invest
Manage &
Divest
Fund, Sponsor
Stakes & Co-
Investment Assets
Third-party Projects
• Real Estate as a
Service
3 – 4% p.a. – BCG’s estimate of the additional return on assets
available from systematic, AI-enabled optimisation
31
29.
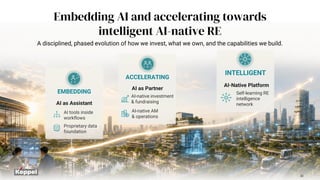
EMBEDDING
AI as Assistant
AItools inside
workflows
Proprietary data
foundation
ACCELERATING
AI as Partner
AI-native investment
& fundraising
AI-native AM
& operations
INTELLIGENT
AI-Native Platform
Self-learning RE
intelligence
network
A disciplined, phased evolution of how we invest, what we own, and the capabilities we build.
Embedding AI and accelerating towards
intelligent AI-native RE
32
30.
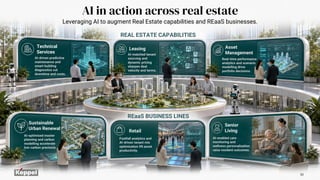
AI-enabled care
monitoring and
wellnesspersonalisation
raise resident outcomes.
Senior
Living
Real-time performance
analytics and scenario
modelling drive
portfolio decisions.
Asset
Management
AI-matched tenant
sourcing and
dynamic pricing
sharpen deal
velocity and terms.
AI-driven predictive
maintenance and
smart building
diagnostics cut
downtime and costs.
Leasing
Technical
Services
Footfall analytics and
AI-driven tenant mix
optimisation lift asset
productivity.
Retail
REaaS BUSINESS LINES
AI-optimised master
planning and carbon
modelling accelerate
low-carbon precincts.
Sustainable
Urban Renewal
REAL ESTATE CAPABILITIES
Leveraging AI to augment Real Estate capabilities and REaaS businesses.
AI in action across real estate
33
31.
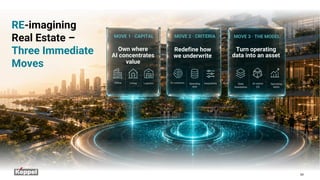
AI-native
OS
Data
foundation
Operating
alpha
Turn operating
data intoan asset
MOVE 3 · THE MODEL
Adaptability
Operating
data
AI-readiness
Redefine how
we underwrite
MOVE 2 · CRITERIA
Logistics
Living
Office
Own where
AI concentrates
value
MOVE 1 · CAPITAL
RE-imagining
Real Estate –
Three Immediate
Moves
34
37
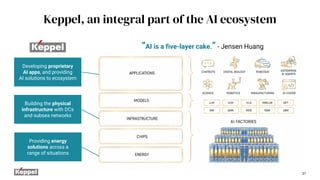
Keppel, an integralpart of the AI ecosystem
“AI is a five-layer cake.” - Jensen Huang
Developing proprietary
AI apps, and providing
AI solutions to ecosystem
Building the physical
infrastructure with DCs
and subsea networks
Providing energy
solutions across a
range of situations
34.
38
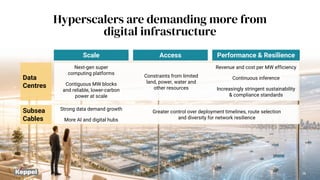
Hyperscalers are demandingmore from
digital infrastructure
Scale Access Performance & Resilience
Data
Centres
Subsea
Cables
Revenue and cost per MW efficiency
Continuous inference
Increasingly stringent sustainability
& compliance standards
Next-gen super
computing platforms
Contiguous MW blocks
and reliable, lower-carbon
power at scale
Constraints from limited
land, power, water and
other resources
Strong data demand growth
More AI and digital hubs
Greater control over deployment timelines, route selection
and diversity for network resilience
35.
39
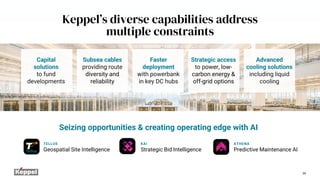
Keppel’s diverse capabilitiesaddress
multiple constraints
Capital
solutions
to fund
developments
Subsea cables
providing route
diversity and
reliability
Faster
deployment
with powerbank
in key DC hubs
Strategic access
to power, low-
carbon energy &
off-grid options
Advanced
cooling solutions
including liquid
cooling
Seizing opportunities & creating operating edge with AI
ATHENA
Predictive Maintenance AI
TELLUS
Geospatial Site Intelligence
KAI
Strategic Bid Intelligence
36.
40
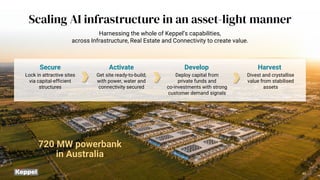
Scaling AI infrastructurein an asset-light manner
Harnessing the whole of Keppel’s capabilities,
across Infrastructure, Real Estate and Connectivity to create value.
720 MW powerbank
in Australia
Secure
Lock in attractive sites
via capital-efficient
structures
Activate
Get site ready-to-build;
with power, water and
connectivity secured
Develop
Deploy capital from
private funds and
co-investments with strong
customer demand signals
Harvest
Divest and crystallise
value from stabilised
assets
37.
41
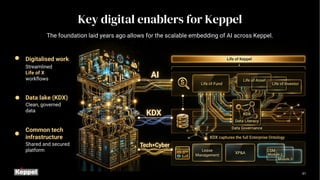
Data lake (KDX)
Clean,governed
data
Common tech
infrastructure
Shared and secured
platform
Digitalised work
Streamlined
Life of X
workflows
Key digital enablers for Keppel
The foundation laid years ago allows for the scalable embedding of AI across Keppel.
43
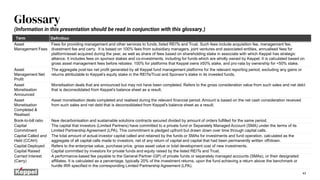
Glossary
Term Definition
Asset
Management Fees
Feesfor providing management and other services to funds, listed REITs and Trust. Such fees include acquisition fee, management fee,
divestment fee and carry. It is based on 100% fees from subsidiary managers, joint ventures and associated entities, annualised fees for
platform/asset acquired during the year, as well as share of fees based on shareholding stake in associate with which Keppel has strategic
alliance. It includes fees on sponsor stakes and co-investments, including for funds which are wholly owned by Keppel. It is calculated based on
gross asset management fees before rebates: 100% for platforms that Keppel owns ≥50% stake, and pro-rata by ownership for <50% stake.
Asset
Management Net
Profit
The aggregate post-tax net profit generated by all Keppel fund management platforms for the relevant reporting period, excluding any gains or
returns attributable to Keppel’s equity stake in the REITs/Trust and Sponsor’s stake in its invested funds.
Asset
Monetisation
Announced
Monetisation deals that are announced but may not have been completed. Refers to the gross consideration value from such sales and net debt
that is deconsolidated from Keppel’s balance sheet as a result.
Asset
Monetisation
Completed &
Realised
Asset monetisation deals completed and realised during the relevant financial period. Amount is based on the net cash consideration received
from such sales and net debt that is deconsolidated from Keppel's balance sheet as a result.
Book-to-bill ratio New decarbonisation and sustainable solutions contracts secured divided by amount of orders fulfilled for the same period.
Capital
Commitment
The capital that investors (Limited Partners) have committed to a private fund or Separately Managed Account (SMA) under the terms of its
Limited Partnership Agreement (LPA). This commitment is pledged upfront but drawn down over time through capital calls.
Capital Called and
Held (CCAH)
The total amount of actual investor capital called and retained by the funds or SMAs for investments and fund operation, calculated as the
aggregate of all capital calls made to investors, net of any return of capital and capital that had been permanently written off/down.
Capital Deployed Refers to the enterprise value, purchase price, gross asset value or total development cost of new investments.
Capital Raised Capital committed by investors for private funds and equity raised by the listed REITs and Trust.
Carried Interest
(Carry)
A performance-based fee payable to the General Partner (GP) of private funds or separately managed accounts (SMAs), or their designated
affiliates. It is calculated as a percentage, typically 20% of the investment returns, upon the fund achieving a return above the benchmark or
hurdle IRR specified in the corresponding Limited Partnership Agreement (LPA).
(Information in this presentation should be read in conjunction with this glossary.)
40.
44
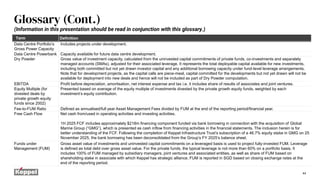
Glossary (Cont.)
Term Definition
DataCentre Portfolio’s
Gross Power Capacity
Includes projects under development.
Data Centre Powerbank Capacity available for future data centre development.
Dry Powder Gross value of investment capacity, calculated from the uninvested capital commitments of private funds, co-investments and separately
managed accounts (SMAs), adjusted for their associated leverage. It represents the total deployable capital available for new investments,
including both committed but not yet drawn investor capital and any additional borrowing capacity under fund-level leverage arrangements.
Note that for development projects, as the capital calls are piece-meal, capital committed for the developments but not yet drawn will not be
available for deployment into new deals and hence will not be included as part of Dry Powder computation.
EBITDA Profit before depreciation, amortisation, net interest expense and tax i.e. it includes share of results of associates and joint ventures.
Equity Multiple (for
divested deals by
private growth equity
funds since 2002)
Presented based on average of the equity multiple of investments divested by the private growth equity funds, weighted by each
investment’s equity contribution.
Fee-to-FUM Ratio Defined as annualised/full year Asset Management Fees divided by FUM at the end of the reporting period/financial year.
Free Cash Flow Net cash from/used in operating activities and investing activities.
1H 2025 FCF includes approximately $218m financing component funded via bank borrowing in connection with the acquisition of Global
Marine Group (“GMG”), which is presented as cash inflow from financing activities in the financial statements. The inclusion herein is for
better understanding of the FCF. Following the completion of Keppel Infrastructure Trust’s subscription of a 46.7% equity stake in GMG on 25
November 2025, the bank borrowing has been deconsolidated from the Group’s FY 2025’s balance sheet.
Funds under
Management (FUM)
Gross asset value of investments and uninvested capital commitments on a leveraged basis is used to project fully-invested FUM. Leverage
is defined as total debt over gross asset value. For the private funds, the typical leverage is not more than 60% on a portfolio basis. It
includes 100% of FUM managed by subsidiary managers, joint ventures and associated entities, as well as share of FUM based on
shareholding stake in associate with which Keppel has strategic alliance. FUM is reported in SGD based on closing exchange rates at the
end of the reporting period.
(Information in this presentation should be read in conjunction with this glossary.)
41.
45
Glossary (Cont.)
Term Definition
Horizontal
Reporting(HoR)
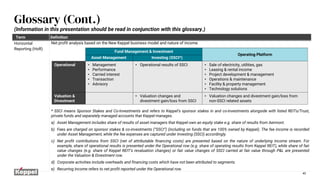
Net profit analysis based on the New Keppel business model and nature of income.
* SSCI means Sponsor Stakes and Co-Investments and refers to Keppel’s sponsor stakes in and co-investments alongside with listed REITs/Trust,
private funds and separately managed accounts that Keppel manages.
a) Asset Management includes share of results of asset managers that Keppel own an equity stake e.g. share of results from Aermont.
b) Fees are charged on sponsor stakes & co-investments (“SSCI”) (including on funds that are 100% owned by Keppel). The fee income is recorded
under Asset Management, while the fee expenses are captured under Investing (SSCI) accordingly.
c) Net profit contributions from SSCI (net of attributable financing costs) are presented based on the nature of underlying income stream. For
example, share of operational results is presented under the Operational row (e.g. share of operating results from Keppel REIT), while share of fair
value changes (e.g. share of Keppel REIT’s revaluation changes) or fair value changes of SSCI carried at fair value through P&L are presented
under the Valuation & Divestment row.
d) Corporate activities include overheads and financing costs which have not been attributed to segments.
e) Recurring Income refers to net profit reported under the Operational row.
(Information in this presentation should be read in conjunction with this glossary.)
Fund Management & Investment
Operating Platform
Asset Management Investing (SSCI*)
Operational • Management
• Performance
• Carried interest
• Transaction
• Advisory
• Operational results of SSCI • Sale of electricity, utilities, gas
• Leasing & rental income
• Project development & management
• Operations & maintenance
• Facility & property management
• Technology solutions
Valuation &
Divestment
• Valuation changes and
divestment gain/loss from SSCI
• Valuation changes and divestment gain/loss from
non-SSCI related assets
42.
46
Glossary (Cont.)
Term Definition
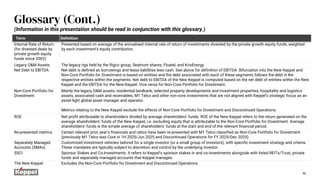
InternalRate of Return
(for divested deals by
private growth equity
funds since 2002)
Presented based on average of the annualised internal rate of return of investments divested by the private growth equity funds, weighted
by each investment’s equity contribution.
Legacy O&M Assets The legacy rigs held by the Rigco group, Seatrium shares, Floatel, and KrisEnergy.
Net Debt to EBITDA Net debt is defined as borrowings and lease liabilities less cash. See above for definition of EBITDA. Bifurcation into the New Keppel and
Non-Core Portfolio for Divestment is based on entities and the debt associated with each of these segments follows the debt in the
respective entities within the segments. Net debt to EBITDA of the New Keppel is computed based on the net debt of entities within the New
Keppel and the EBITDA for the New Keppel. Vice versa for Non-Core Portfolio for Divestment.
Non-Core Portfolio for
Divestment
Mainly the legacy O&M assets, residential landbank, selected property developments and investment properties, hospitality and logistics
assets, associated cash and receivables, M1 Telco and other non-core investments that are not aligned with Keppel’s strategic focus as an
asset-light global asset manager and operator.
Metrics relating to the New Keppel exclude the effects of Non-Core Portfolio for Divestment and Discontinued Operations.
ROE Net profit attributable to shareholders divided by average shareholders’ funds. ROE of the New Keppel refers to the return generated on the
average shareholders’ funds of the New Keppel, i.e. excluding equity that is attributable to the Non-Core Portfolio for Divestment. Average
shareholders’ funds is the simple average of shareholders’ funds at the start and end of the relevant financial period.
Re-presented metrics Certain relevant prior year’s financials and ratios have been re-presented with M1 Telco classified as Non-Core Portfolio for Divestment
(previously M1 Telco was Core in 1H 2025/Jun 2025 and Discontinued Operations for FY 2025/Dec 2025).
Separately Managed
Accounts (SMAs)
Customized investment vehicles tailored for a single investor (or a small group of investors), with specific investment strategy and criteria.
These mandates are typically subject to discretion and control by the underlying investor.
SSCI Sponsor Stakes and Co-Investments. It refers to Keppel’s sponsor stakes in and co-investments alongside with listed REITs/Trust, private
funds and separately managed accounts that Keppel manages.
The New Keppel Excludes the Non-Core Portfolio for Divestment and Discontinued Operations.
(Information in this presentation should be read in conjunction with this glossary.)
43.
47
NOT FOR RELEASE,PUBLICATION OR DISTRIBUTION, IN WHOLE OR IN PART, IN, INTO OR FROM ANY JURISDICTION WHERE TO DO SO
WOULD CONSTITUTE A VIOLATION OF THE RELEVANT LAWS OF THAT JURISDICTION. THIS PRESENTATION SHALL NOT CONSTITUTE AN
OFFER TO SELL OR A SOLICITATION OF AN OFFER TO SELL, SUBSCRIBE FOR OR BUY SECURITIES IN ANY JURISDICTION, INCLUDING IN
THE UNITED STATES.
This presentation is for information purposes only and does not have regard to your specific investment objectives, financial situation or your
particular needs. Any information in this presentation is not to be construed as investment or financial advice and does not constitute an
invitation, offer or solicitation of any offer to acquire, purchase or subscribe for securities or other financial instruments in Keppel Ltd. (“Keppel”).
The past performance of Keppel is not indicative of the future performance of Keppel. You should exercise judgment in your own financial
decisions. If in doubt, please consult with your professional advisers.
This presentation contains certain forward-looking statements pertaining to Keppel’s future performance and strategy, which have been carefully
prepared, based on credible methodologies and assumptions made on the basis of information known to Keppel as at the date of this
presentation, and which Keppel believes are realistic and defensible as at the date of this presentation. However, forward-looking statements by
their nature relate to an uncertain future, and the expectations, estimates, beliefs, projections, future plans and strategies, anticipated events or
trends can change as a result of many possible events, factors, uncertainties and risks, including the key risks described in Keppel’s Annual
Report 2025 under “Risk Management”. Actual events or results may differ, perhaps materially, from those reflected or contemplated in such
forward-looking statements. Past performance is no guarantee of future results. All forward-looking statements speak only as of the date of this
presentation. Keppel does not undertake any obligation to update any forward-looking statements to reflect circumstances or events that occur
after the date of this presentation except as required by law or other regulatory requirement.
Certain images in this document are artist's impressions generated using artificial intelligence and are illustrative only; they do not depict actual
assets, persons, or events.
Unless explicitly indicated otherwise, all monetary values denoted as ‘$’ within this presentation are to be interpreted as referring to Singapore
dollars.
Disclaimer