Presentation about work by Daniel Crown, an analyst in CBO's Long-Term Analysis Unit, and Randall Akee, Harvard University, at Immigrants and the U.S. Economy, a National Bureau of Economic Research conference.
Immigrants and theU.S. Economy
National Bureau of Economic Research Conference
March 6, 2026
Daniel Crown, Congressional Budget Office
Randall Akee, Harvard University
Immigrant Earnings Assimilation,
1981–2021
The forthcoming working paper on which this presentation is based has not been subject to CBO’s regular review and editing process. The views expressed here should not be
interpreted as CBO’s. The agency expects to publish the working paper in spring 2026.
For information about the event, see https://tinyurl.com/sc9cu8pj.
2.
1
The assimilation ofimmigrants into the labor market has important implications for the economy,
the federal budget, and projections of Social Security’s finances.
In the forthcoming working paper, we use a longitudinal dataset covering the 1981–2021 period to:
1. Describe trends in immigration and emigration,
2. Estimate earnings assimilation over a 20-year period of tenure in the United States,
3. Examine differences in the rate of assimilation across arrival cohorts and sex,
4. Estimate earnings assimilation of eventual emigrants, and
5. Examine how earnings upon arrival and earnings growth vary by arrival cohort and country
of birth.
Motivation and Research Questions
3.
2
See Jonathan A.Schwabish, “Identifying Rates of Emigration in the United States Using Administrative Earnings Records,” International Journal of Population Research, vol. 2011,
article 546201 (2011), https://doi.org/10.1155/2011/546201; Darren Lubotsky, “Chutes or Ladders? A Longitudinal Analysis of Immigrant Earnings,” Journal of Political Economy,
vol. 115, no. 5 (October 2007), pp. 820–867, https://doi.org/10.1086/522871, and “The Effect of Changes in the U.S. Wage Structure on Recent Immigrants’ Earnings,” Review of
Economics and Statistics, vol. 93, no. 1 (February 2011), pp. 59–71, https://doi.org/10.1162/REST_a_00094; Ran Abramitzky, Leah Platt Boustan, and Katherine Eriksson, “A Nation
of Immigrants: Assimilation and Economic Outcomes in the Age of Mass Migration,” Journal of Political Economy, vol. 122, no. 3 (June 2014), pp. 467–506,
https://doi.org/10.1086/675805; and Randall Akee and Maggie R. Jones, “Return Migration Decisions and Declining Earnings: Immigrants in Linked Survey and Administrative Data,”
Journal of Human Resources (2024), https://doi.org/10.3368/jhr.0722-12457R2.
Estimates of earnings assimilation are often confounded by the possibility of
selective emigration.
Immigrants who remain in the United States tend to have higher earnings than those
who leave.
Schwabish (2011), Lubotsky (2007, 2011), Abramitzky and colleagues (2014), Akee and Jones (2024)
Selective Emigration
4.
3
See Wei-Yin Hu,“Immigrant Earnings Assimilation: Estimates From Longitudinal Data,” American Economic Review, vol. 90, no. 2 (May 2000), pp. 368–372,
https://doi.org/10.1257/aer.90.2.368; Darren Lubotsky, “Chutes or Ladders? A Longitudinal Analysis of Immigrant Earnings,” Journal of Political Economy, vol. 115, no. 5
(October 2007), pp. 820–867, https://doi.org/10.1086/522871, and “The Effect of Changes in the U.S. Wage Structure on Recent Immigrants’ Earnings,” Review of Economics and
Statistics, vol. 93, no. 1 (February 2011), pp. 59–71, https://doi.org/10.1162/REST_a_00094; Ran Abramitzky, Leah Platt Boustan, and Katherine Eriksson, “A Nation of Immigrants:
Assimilation and Economic Outcomes in the Age of Mass Migration,” Journal of Political Economy, vol. 122, no. 3 (June 2014), pp. 467–506, https://doi.org/10.1086/675805; and
Harriet Orcutt Duleep and Daniel J. Dowhan, “Insights From Longitudinal Data on the Earnings Growth of U.S. Foreign-Born Men,” Demography, vol. 39, no. 3 (August 2002),
pp. 485–506, https://doi.org/10.1353/dem.2002.0026, and “Research on Immigrant Earnings,” Social Security Bulletin, vol. 68, no. 1 (2008), pp. 31–43,
www.ssa.gov/policy/docs/ssb/v68n1/v68n1p31.html.
Because immigrants who stay in the United States tend to have higher earnings, using cross-sectional
data tends to overestimate the rate of earnings assimilation among immigrants.
Hu (2000), Lubotsky (2007), Abramitzky and colleagues (2014)
To overcome those barriers, researchers have linked cross-sectional survey data to administrative
earnings history.
Duleep and Dowhan (2002, 2008), Lubotsky (2007, 2011)
That approach yields a complete panel data set for those immigrants who have survived and stayed in
the country until the year in which they were surveyed.
It does not measure a complete arrival cohort because some people may have left before the year of
the survey. Sample sizes also are generally small, limiting the ability to analyze subpopulations.
Research on Emigration and Earnings Growth
5.
4
See Randall Akeeand Maggie R. Jones, “Return Migration Decisions and Declining Earnings: Immigrants in Linked Survey and Administrative Data,” Journal of Human Resources
(2024), https://doi.org/10.3368/jhr.0722-12457R2; and Deborah Rho and Seth Sanders, “Immigrant Earnings Assimilation in the United States: A Panel Analysis,” Journal of Labor
Economics, vol. 39, no. 1 (January 2021), pp. 37–78, https://doi.org/10.1086/708615.
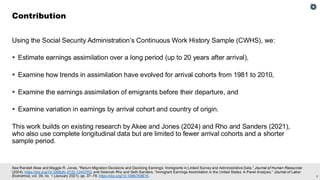
Using the Social Security Administration’s Continuous Work History Sample (CWHS), we:
▪ Estimate earnings assimilation over a long period (up to 20 years after arrival),
▪ Examine how trends in assimilation have evolved for arrival cohorts from 1981 to 2010,
▪ Examine the earnings assimilation of emigrants before their departure, and
▪ Examine variation in earnings by arrival cohort and country of origin.
This work builds on existing research by Akee and Jones (2024) and Rho and Sanders (2021),
who also use complete longitudinal data but are limited to fewer arrival cohorts and a shorter
sample period.
Contribution
6.
5
Emigration
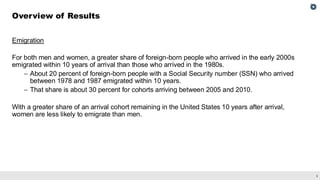
For both menand women, a greater share of foreign-born people who arrived in the early 2000s
emigrated within 10 years of arrival than those who arrived in the 1980s.
– About 20 percent of foreign-born people with a Social Security number (SSN) who arrived
between 1978 and 1987 emigrated within 10 years.
– That share is about 30 percent for cohorts arriving between 2005 and 2010.
With a greater share of an arrival cohort remaining in the United States 10 years after arrival,
women are less likely to emigrate than men.
Overview of Results
7.
6
Earnings Assimilation
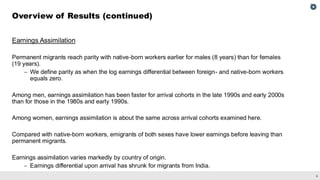
Permanent migrantsreach parity with native-born workers earlier for males (8 years) than for females
(19 years).
– We define parity as when the log earnings differential between foreign- and native-born workers
equals zero.
Among men, earnings assimilation has been faster for arrival cohorts in the late 1990s and early 2000s
than for those in the 1980s and early 1990s.
Among women, earnings assimilation is about the same across arrival cohorts examined here.
Compared with native-born workers, emigrants of both sexes have lower earnings before leaving than
permanent migrants.
Earnings assimilation varies markedly by country of origin.
– Earnings differential upon arrival has shrunk for migrants from India.
Overview of Results (continued)
8.
7
Data and Sample
ImmigrationTrends
Emigration Trends
Earnings Assimilation
Earnings Assimilation, by Arrival Cohort and Sex
Earnings Assimilation of Emigrants, by Length of Stay and Sex
Earnings Upon Arrival and Earnings Growth, by Country of Origin, Arrival Cohort, and Sex
Conclusions
Road Map
9
We use theCWHS, an administrative data set obtained from the Social Security
Administration.
The data contain longitudinal information on earnings over the 1981–2021 period
as well information on age, sex, and country of birth.
Those data are shared with CBO for the purposes of generating long-run
projections of Social Security. How immigrants’ earnings evolve is an important
component of those projections.
Data
11.
10
See Stephen Goss,Alice Wade, J. Patrick Skirvin, Michael Morris, K. Mark Bye, and Danielle Huston, “Effects of Unauthorized Immigration on the Actuarial Status of the
Social Security Trust Funds,” Social Security Administration Actuarial Note No. 151 (April 2013), www.ssa.gov/oact/NOTES/pdf_notes/note151.pdf (37 KB).
Our data is a 1 percent sample of all individuals with an SSN.
The foreign-born population in the data includes people with work authorization,
naturalized citizens, and other immigrants working legally in the United States.
It does not include people working in the informal labor market. It could include some
people working with a fraudulent SSN or people who were issued an SSN while
working under a temporary immigration status but continued working and reporting
earnings after that status expired.
– The Social Security Administration estimates that the number of such immigrants
present in its administrative files is small (Goss and colleagues 2013).
Foreign-Born Population in the CWHS
12.
11
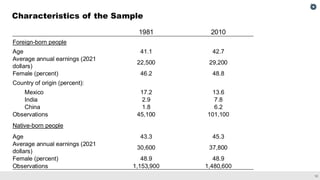
We restrict thesample to:
▪ Native-born people ages 25–65
▪ Foreign-born people who arrived over the 1981–2010 period and
were ages 25–45 at arrival
The sample includes about 500,000 foreign-born people and about 4 million native-born people.
We use the year of SSN issuance as a proxy for the year of arrival. The first year of arrival in our
analysis is defined as the first full year after SSN issuance (to avoid a partial year of earnings).
Sample
13.
12
Characteristics of theSample
1981 2010
Foreign-born people
Age 41.1 42.7
Average annual earnings (2021
dollars)
22,500 29,200
Female (percent) 46.2 48.8
Country of origin (percent):
Mexico 17.2 13.6
India 2.9 7.8
China 1.8 6.2
Observations 45,100 101,100
Native-born people
Age 43.3 45.3
Average annual earnings (2021
dollars)
30,600 37,800
Female (percent) 48.9 48.9
Observations 1,153,900 1,480,600
14
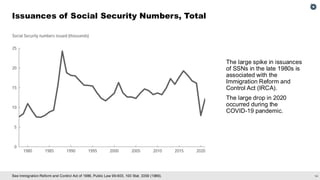
See Immigration Reformand Control Act of 1986, Public Law 99-603, 100 Stat. 3359 (1986).
Issuances of Social Security Numbers, Total
The large spike in issuances
of SSNs in the late 1980s is
associated with the
Immigration Reform and
Control Act (IRCA).
The large drop in 2020
occurred during the
COVID-19 pandemic.
16.
15
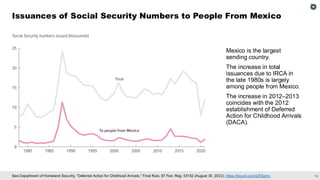
See Department ofHomeland Security, “Deferred Action for Childhood Arrivals,” Final Rule, 87 Fed. Reg. 53152 (August 30, 2022), https://tinyurl.com/32f3jzmv.
Issuances of Social Security Numbers to People From Mexico
Mexico is the largest
sending country.
The increase in total
issuances due to IRCA in
the late 1980s is largely
among people from Mexico.
The increase in 2012–2013
coincides with the 2012
establishment of Deferred
Action for Childhood Arrivals
(DACA).
17.
16
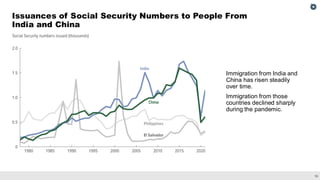
Issuances of SocialSecurity Numbers to People From
India and China
Immigration from India and
China has risen steadily
over time.
Immigration from those
countries declined sharply
during the pandemic.
18.
17
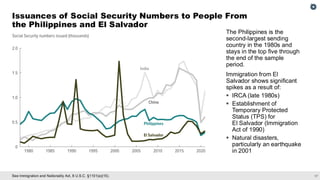
See Immigration andNationality Act, 8 U.S.C. §1101(a)(15).
Issuances of Social Security Numbers to People From
the Philippines and El Salvador
The Philippines is the
second-largest sending
country in the 1980s and
stays in the top five through
the end of the sample
period.
Immigration from El
Salvador shows significant
spikes as a result of:
▪ IRCA (late 1980s)
▪ Establishment of
Temporary Protected
Status (TPS) for
El Salvador (Immigration
Act of 1990)
▪ Natural disasters,
particularly an earthquake
in 2001
19
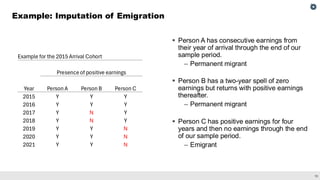
▪ Person Ahas consecutive earnings from
their year of arrival through the end of our
sample period.
– Permanent migrant
▪ Person B has a two-year spell of zero
earnings but returns with positive earnings
thereafter.
– Permanent migrant
▪ Person C has positive earnings for four
years and then no earnings through the end
of our sample period.
– Emigrant
Example: Imputation of Emigration
Example for the 2015 Arrival Cohort
Presence of positive earnings
Year Person A Person B Person C
2015 Y Y Y
2016 Y Y Y
2017 Y N Y
2018 Y N Y
2019 Y Y N
2020 Y Y N
2021 Y Y N
21.
20
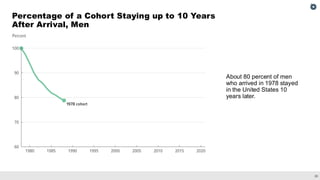
Percentage of aCohort Staying up to 10 Years
After Arrival, Men
About 80 percent of men
who arrived in 1978 stayed
in the United States 10
years later.
22.
21
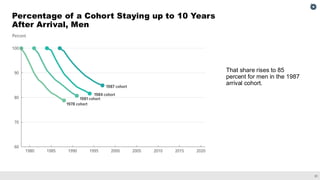
Percentage of aCohort Staying up to 10 Years
After Arrival, Men
That share rises to 85
percent for men in the 1987
arrival cohort.
23.
22
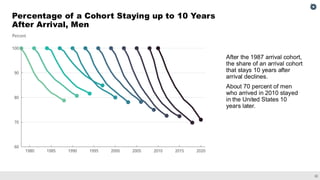
Percentage of aCohort Staying up to 10 Years
After Arrival, Men
After the 1987 arrival cohort,
the share of an arrival cohort
that stays 10 years after
arrival declines.
About 70 percent of men
who arrived in 2010 stayed
in the United States 10
years later.
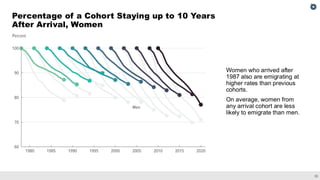
24.
23
Percentage of aCohort Staying up to 10 Years
After Arrival, Women
Women who arrived after
1987 also are emigrating at
higher rates than previous
cohorts.
On average, women from
any arrival cohort are less
likely to emigrate than men.
25
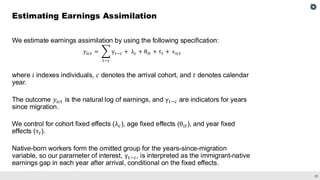
We estimate earningsassimilation by using the following specification:
𝑦𝑖𝑐𝑡 =
𝑡−𝑐
γ𝑡−𝑐 + λ𝑐 + θ𝑖𝑡 + τ𝑡 + ϵ𝑖𝑐𝑡
where 𝑖 indexes individuals, 𝑐 denotes the arrival cohort, and 𝑡 denotes calendar
year.
The outcome 𝑦𝑖𝑐𝑡 is the natural log of earnings, and γ𝑡−𝑐 are indicators for years
since migration.
We control for cohort fixed effects (λ𝑐), age fixed effects (θ𝑖𝑡), and year fixed
effects (τ𝑡).
Native-born workers form the omitted group for the years-since-migration
variable, so our parameter of interest, γ𝑡−𝑐, is interpreted as the immigrant-native
earnings gap in each year after arrival, conditional on the fixed effects.
Estimating Earnings Assimilation
27.
26
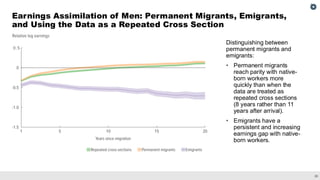
Emigrants are imputedas those with a prolonged absence of earnings (through
2021, the end of the sample period).
Permanent migrants are all other foreign-born people (including people with
temporary absences from the labor market).
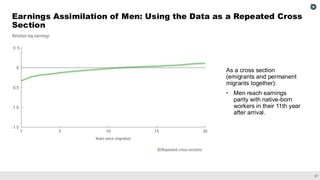
We also pool those groups to show what a cross-sectional analysis
(which would not be able to distinguish the two types) would estimate.
Types of Migrants
28.
27
Earnings Assimilation ofMen: Using the Data as a Repeated Cross
Section
As a cross section
(emigrants and permanent
migrants together):
• Men reach earnings
parity with native-born
workers in their 11th year
after arrival.
29.
28
Earnings Assimilation ofMen: Permanent Migrants, Emigrants,
and Using the Data as a Repeated Cross Section
Distinguishing between
permanent migrants and
emigrants:
• Permanent migrants
reach parity with native-
born workers more
quickly than when the
data are treated as
repeated cross sections
(8 years rather than 11
years after arrival).
• Emigrants have a
persistent and increasing
earnings gap with native-
born workers.
30.
29
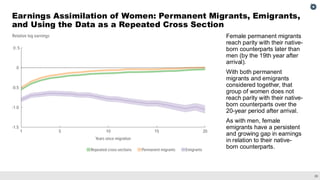
Earnings Assimilation ofWomen: Permanent Migrants, Emigrants,
and Using the Data as a Repeated Cross Section
Female permanent migrants
reach parity with their native-
born counterparts later than
men (by the 19th year after
arrival).
With both permanent
migrants and emigrants
considered together, that
group of women does not
reach parity with their native-
born counterparts over the
20-year period after arrival.
As with men, female
emigrants have a persistent
and growing gap in earnings
in relation to their native-
born counterparts.
31
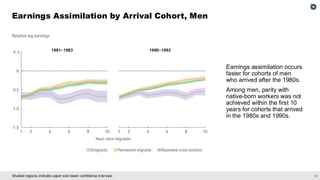
Shaded regions indicateupper and lower confidence intervals.
Earnings Assimilation by Arrival Cohort, Men
Earnings assimilation occurs
faster for cohorts of men
who arrived after the 1980s.
Among men, parity with
native-born workers was not
achieved within the first 10
years for cohorts that arrived
in the 1980s and 1990s.
33.
32
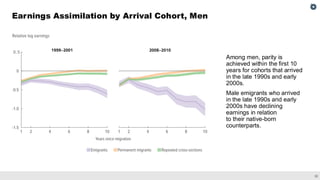
Earnings Assimilation byArrival Cohort, Men
Among men, parity is
achieved within the first 10
years for cohorts that arrived
in the late 1990s and early
2000s.
Male emigrants who arrived
in the late 1990s and early
2000s have declining
earnings in relation
to their native-born
counterparts.
34.
33
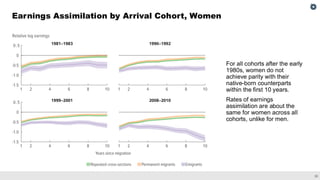
Earnings Assimilation byArrival Cohort, Women
For all cohorts after the early
1980s, women do not
achieve parity with their
native-born counterparts
within the first 10 years.
Rates of earnings
assimilation are about the
same for women across all
cohorts, unlike for men.
35
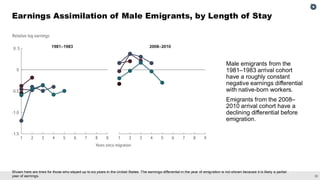
Shown here arelines for those who stayed up to six years in the United States. The earnings differential in the year of emigration is not shown because it is likely a partial
year of earnings.
Earnings Assimilation of Male Emigrants, by Length of Stay
Male emigrants from the
1981–1983 arrival cohort
have a roughly constant
negative earnings differential
with native-born workers.
Emigrants from the 2008–
2010 arrival cohort have a
declining differential before
emigration.
37.
36
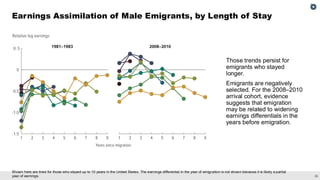
Shown here arelines for those who stayed up to 10 years in the United States. The earnings differential in the year of emigration is not shown because it is likely a partial
year of earnings.
Earnings Assimilation of Male Emigrants, by Length of Stay
Those trends persist for
emigrants who stayed
longer.
Emigrants are negatively
selected. For the 2008–2010
arrival cohort, evidence
suggests that emigration
may be related to widening
earnings differentials in the
years before emigration.
38.
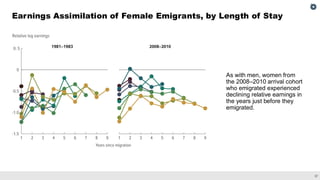
37
Earnings Assimilation ofFemale Emigrants, by Length of Stay
As with men, women from
the 2008–2010 arrival cohort
who emigrated experienced
declining relative earnings in
the years just before they
emigrated.
39
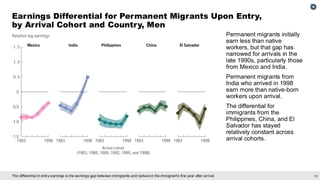
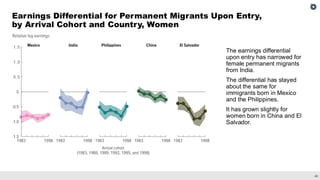
The differential inentry earnings is the earnings gap between immigrants and natives in the immigrant’s first year after arrival.
Earnings Differential for Permanent Migrants Upon Entry,
by Arrival Cohort and Country, Men
Permanent migrants initially
earn less than native
workers, but that gap has
narrowed for arrivals in the
late 1990s, particularly those
from Mexico and India.
Permanent migrants from
India who arrived in 1998
earn more than native-born
workers upon arrival.
The differential for
immigrants from the
Philippines, China, and El
Salvador has stayed
relatively constant across
arrival cohorts.
41.
40
Earnings Differential forPermanent Migrants Upon Entry,
by Arrival Cohort and Country, Women
The earnings differential
upon entry has narrowed for
female permanent migrants
from India.
The differential has stayed
about the same for
immigrants born in Mexico
and the Philippines.
It has grown slightly for
women born in China and El
Salvador.
42.
41
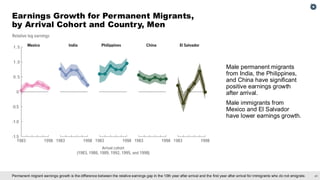
Permanent migrant earningsgrowth is the difference between the relative earnings gap in the 10th year after arrival and the first year after arrival for immigrants who do not emigrate.
Earnings Growth for Permanent Migrants,
by Arrival Cohort and Country, Men
Male permanent migrants
from India, the Philippines,
and China have significant
positive earnings growth
after arrival.
Male immigrants from
Mexico and El Salvador
have lower earnings growth.
43.
42
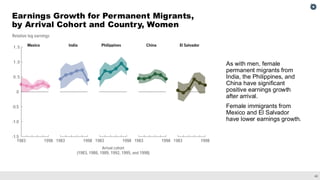
Earnings Growth forPermanent Migrants,
by Arrival Cohort and Country, Women
As with men, female
permanent migrants from
India, the Philippines, and
China have significant
positive earnings growth
after arrival.
Female immigrants from
Mexico and El Salvador
have lower earnings growth.
44
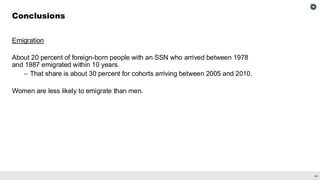
Emigration
About 20 percentof foreign-born people with an SSN who arrived between 1978
and 1987 emigrated within 10 years.
– That share is about 30 percent for cohorts arriving between 2005 and 2010.
Women are less likely to emigrate than men.
Conclusions
46.
45
Earnings Assimilation
Permanent migrantsreach parity with native-born workers earlier for males (8 years) than for females
(19 years).
– We define parity as when the log earnings differential between foreign- and native-born workers
equals zero.
Among men, earnings assimilation has been faster for arrival cohorts in the late 1990s and early 2000s
than for those in the 1980s and early 1990s.
Among women, earnings assimilation is about the same across arrival cohorts examined here.
Compared with native-born workers, emigrants of both sexes have lower earnings before leaving than
permanent migrants.
Earnings assimilation varies markedly by country of origin.
– Earnings differential upon arrival has shrunk for migrants from India.
Conclusions