HOW TO SEE EVENT and AUDIT LOGSIN CLUSTER ONTAP NETAPP STORAGE SYSTEM THROUGH GUI
AND CLI (Graphical user Interface and command line)
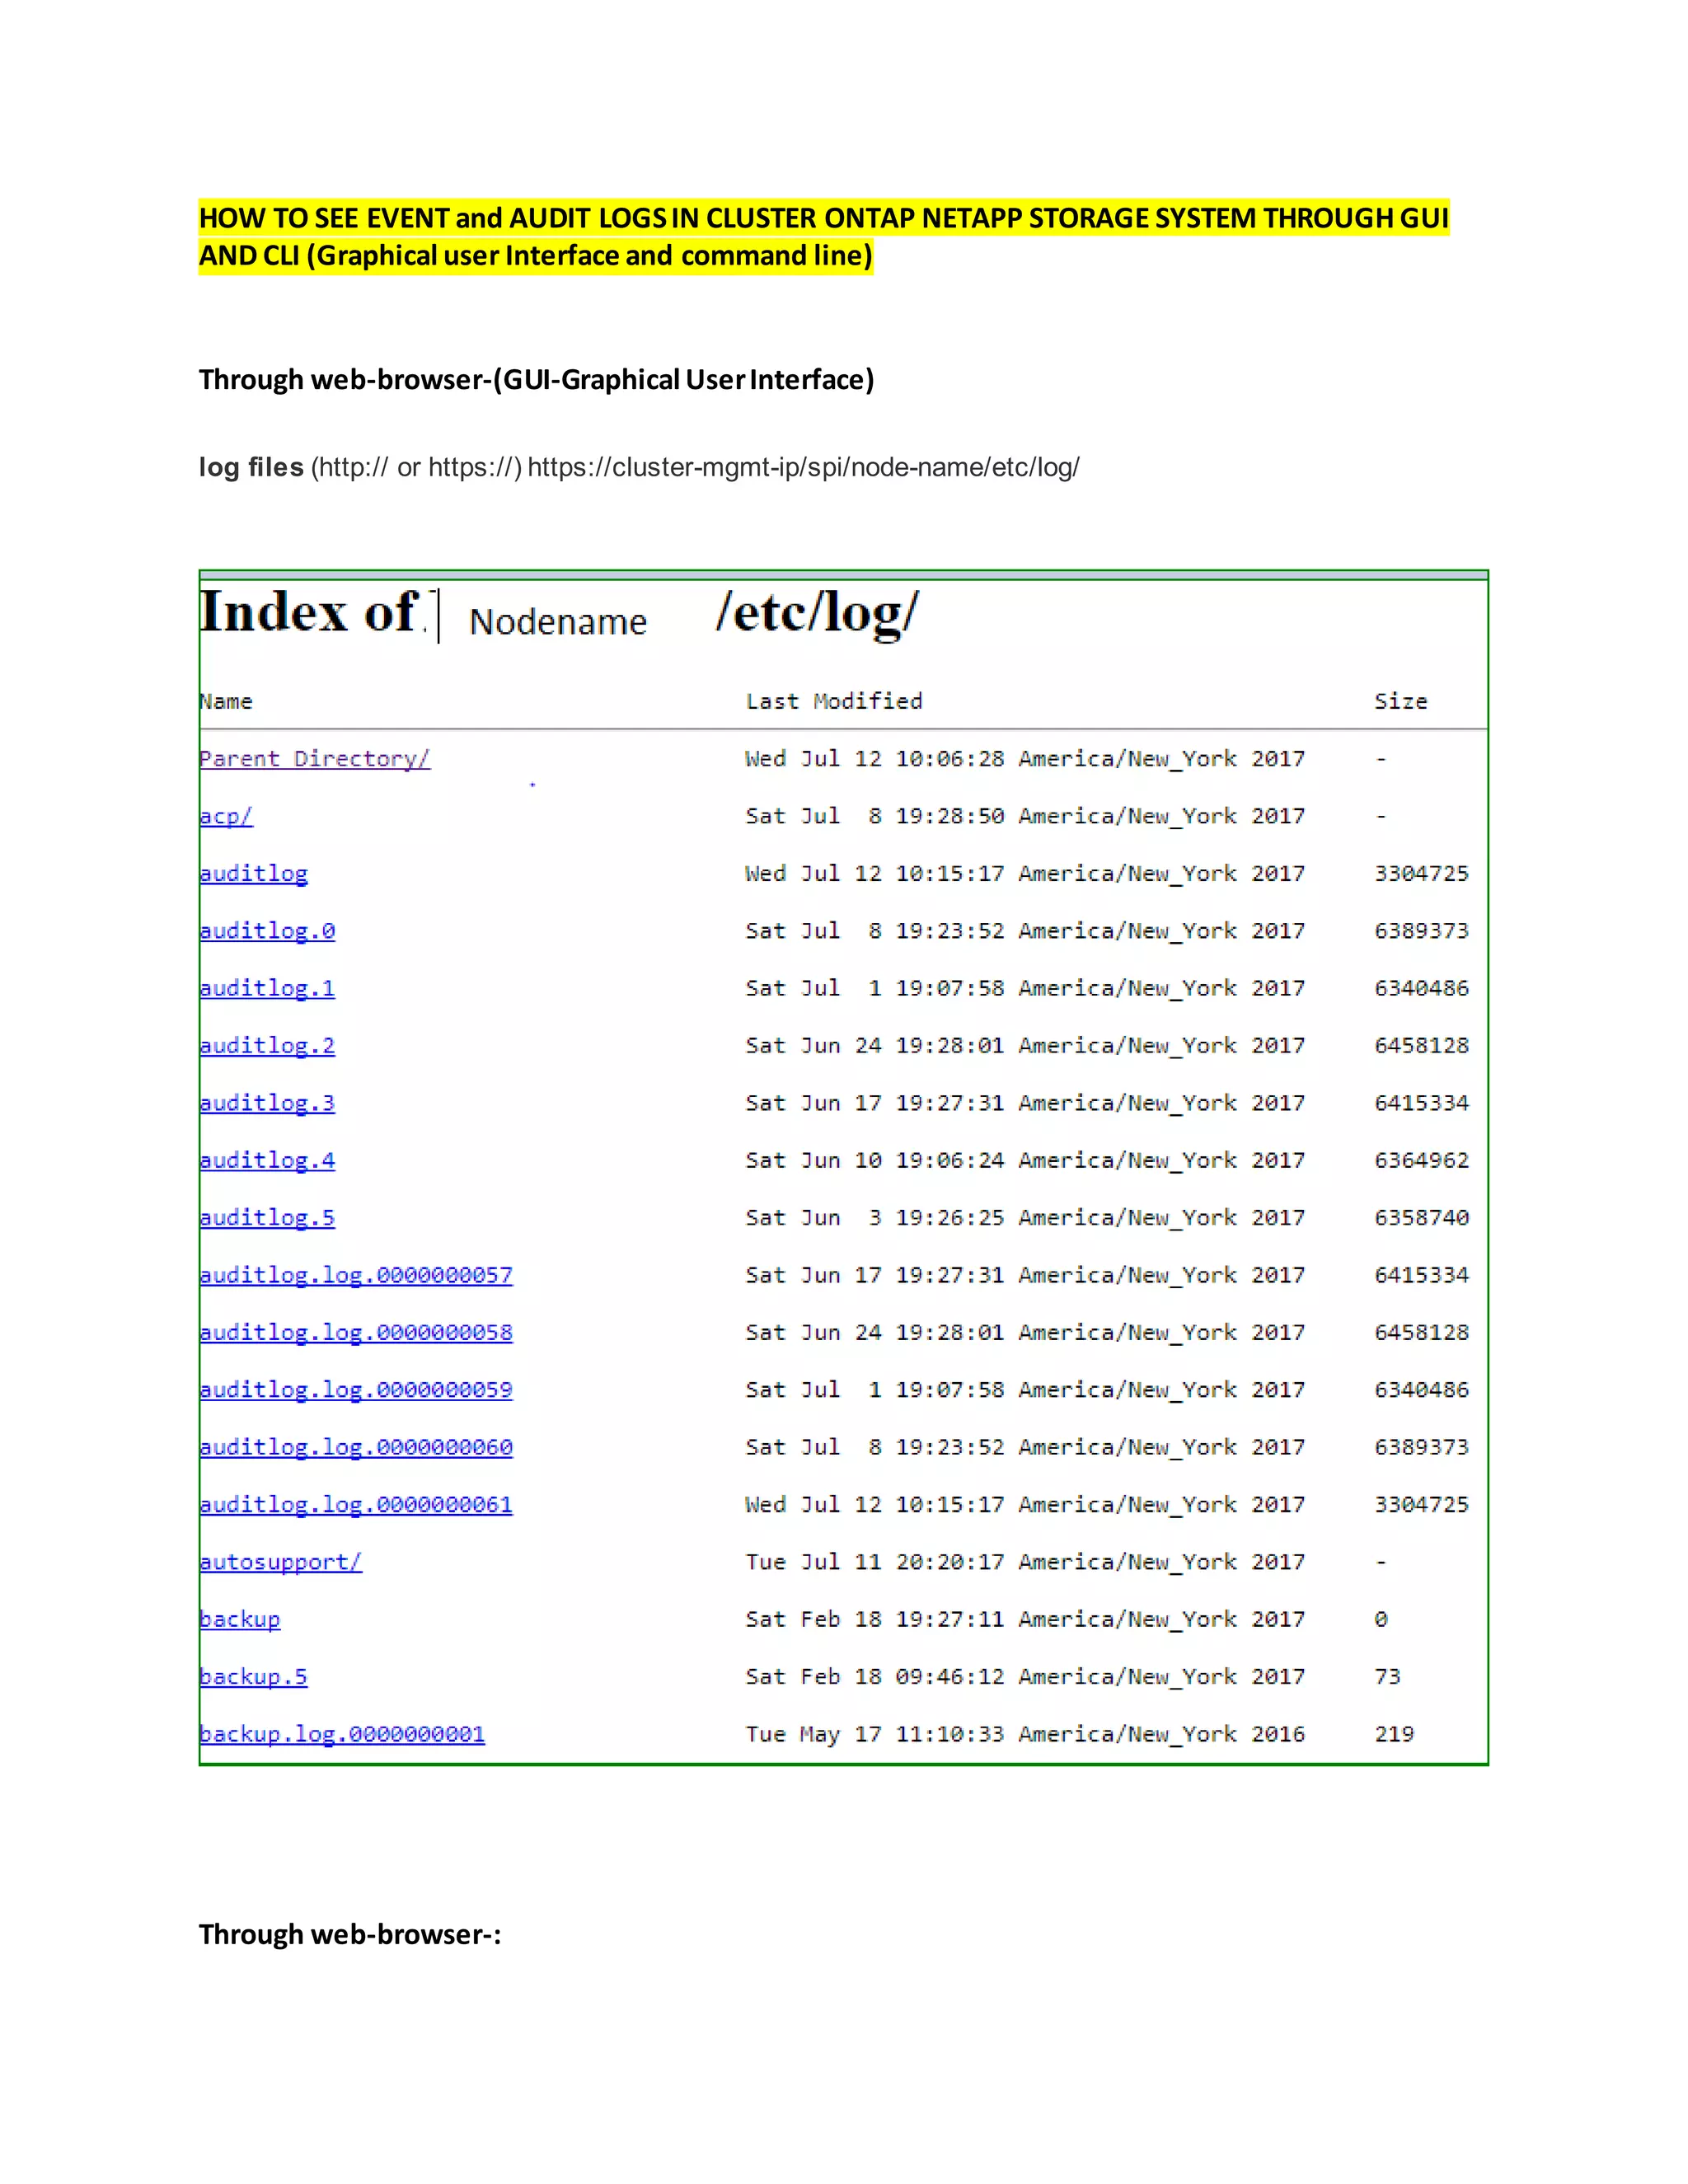
Through web-browser-(GUI-Graphical UserInterface)
log files (http:// or https://) https://cluster-mgmt-ip/spi/node-name/etc/log/
Through web-browser-:
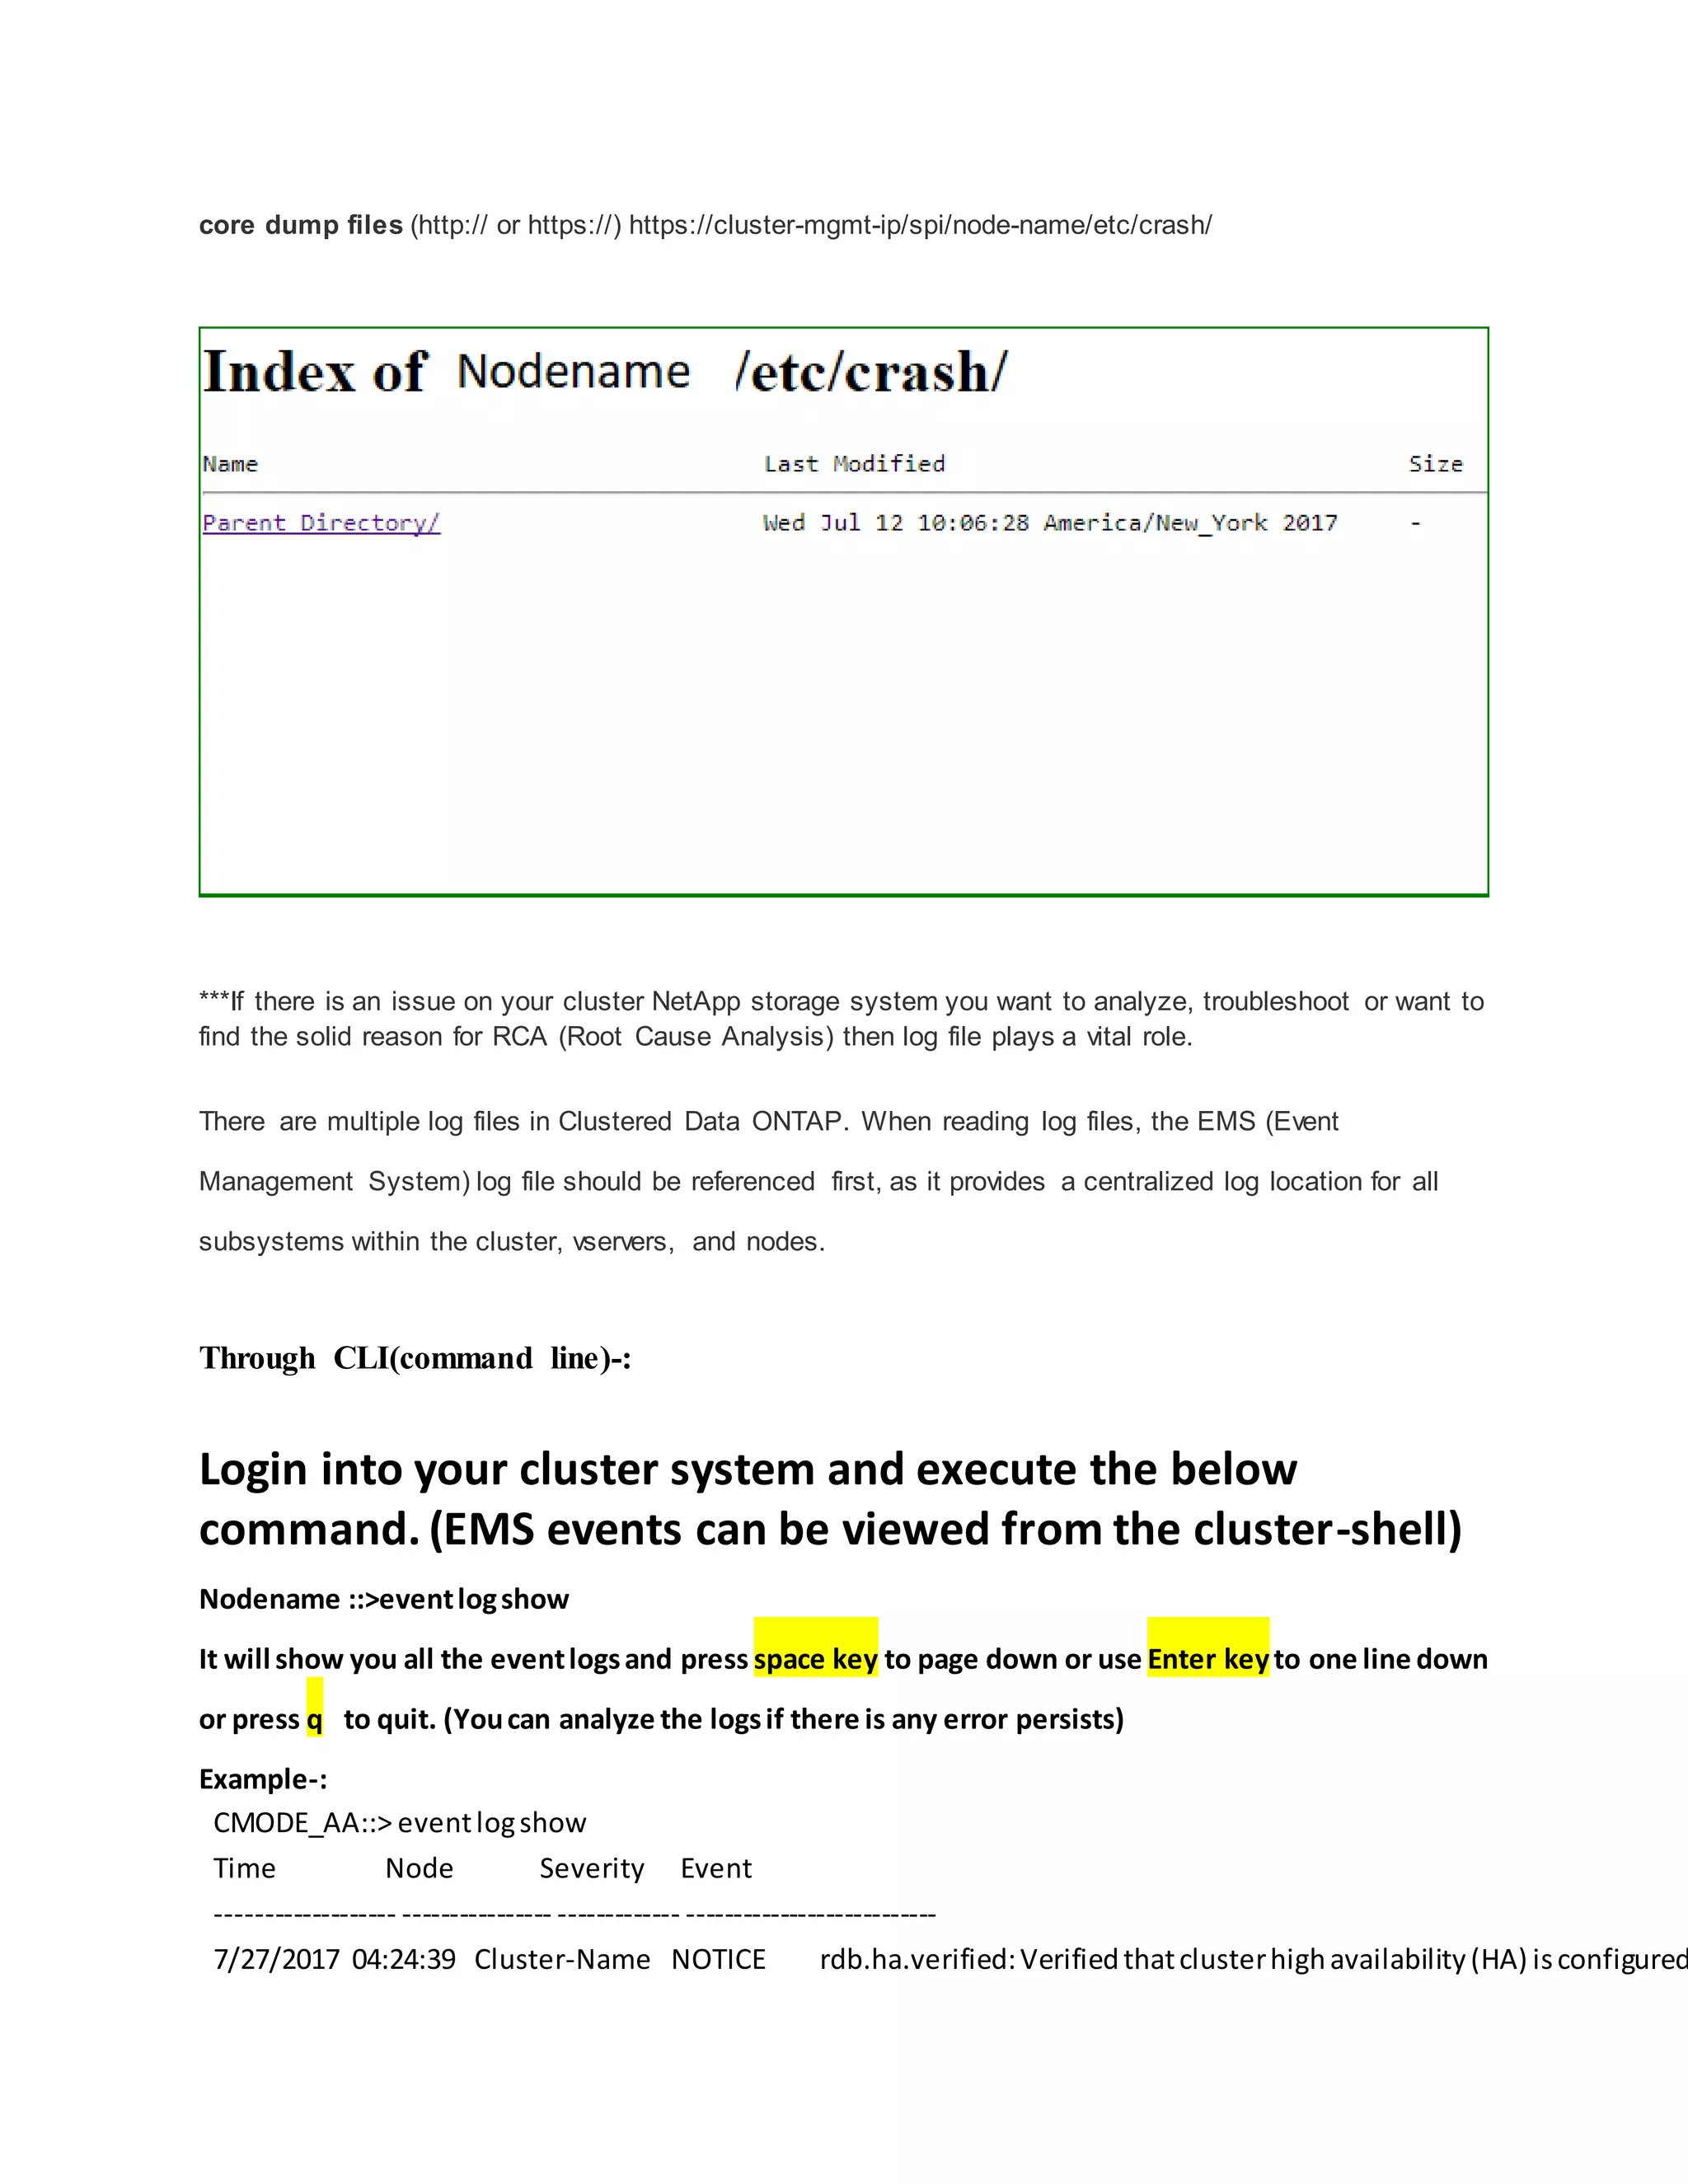
core dump files (http:// or https://) https://cluster-mgmt-ip/spi/node-name/etc/crash/
***If there is an issue on your cluster NetApp storage system you want to analyze, troubleshoot or want to
find the solid reason for RCA (Root Cause Analysis) then log file plays a vital role.
There are multiple log files in Clustered Data ONTAP. When reading log files, the EMS (Event
Management System) log file should be referenced first, as it provides a centralized log location for all
subsystems within the cluster, vservers, and nodes.
Through CLI(command line)-:
Login into your cluster system and execute the below
command. (EMS events can be viewed from the cluster-shell)
Nodename ::>eventlogshow
It will show you all the eventlogsand press space key to page down or use Enter keyto one line down
or press q to quit. (Youcan analyze the logsif there is any error persists)
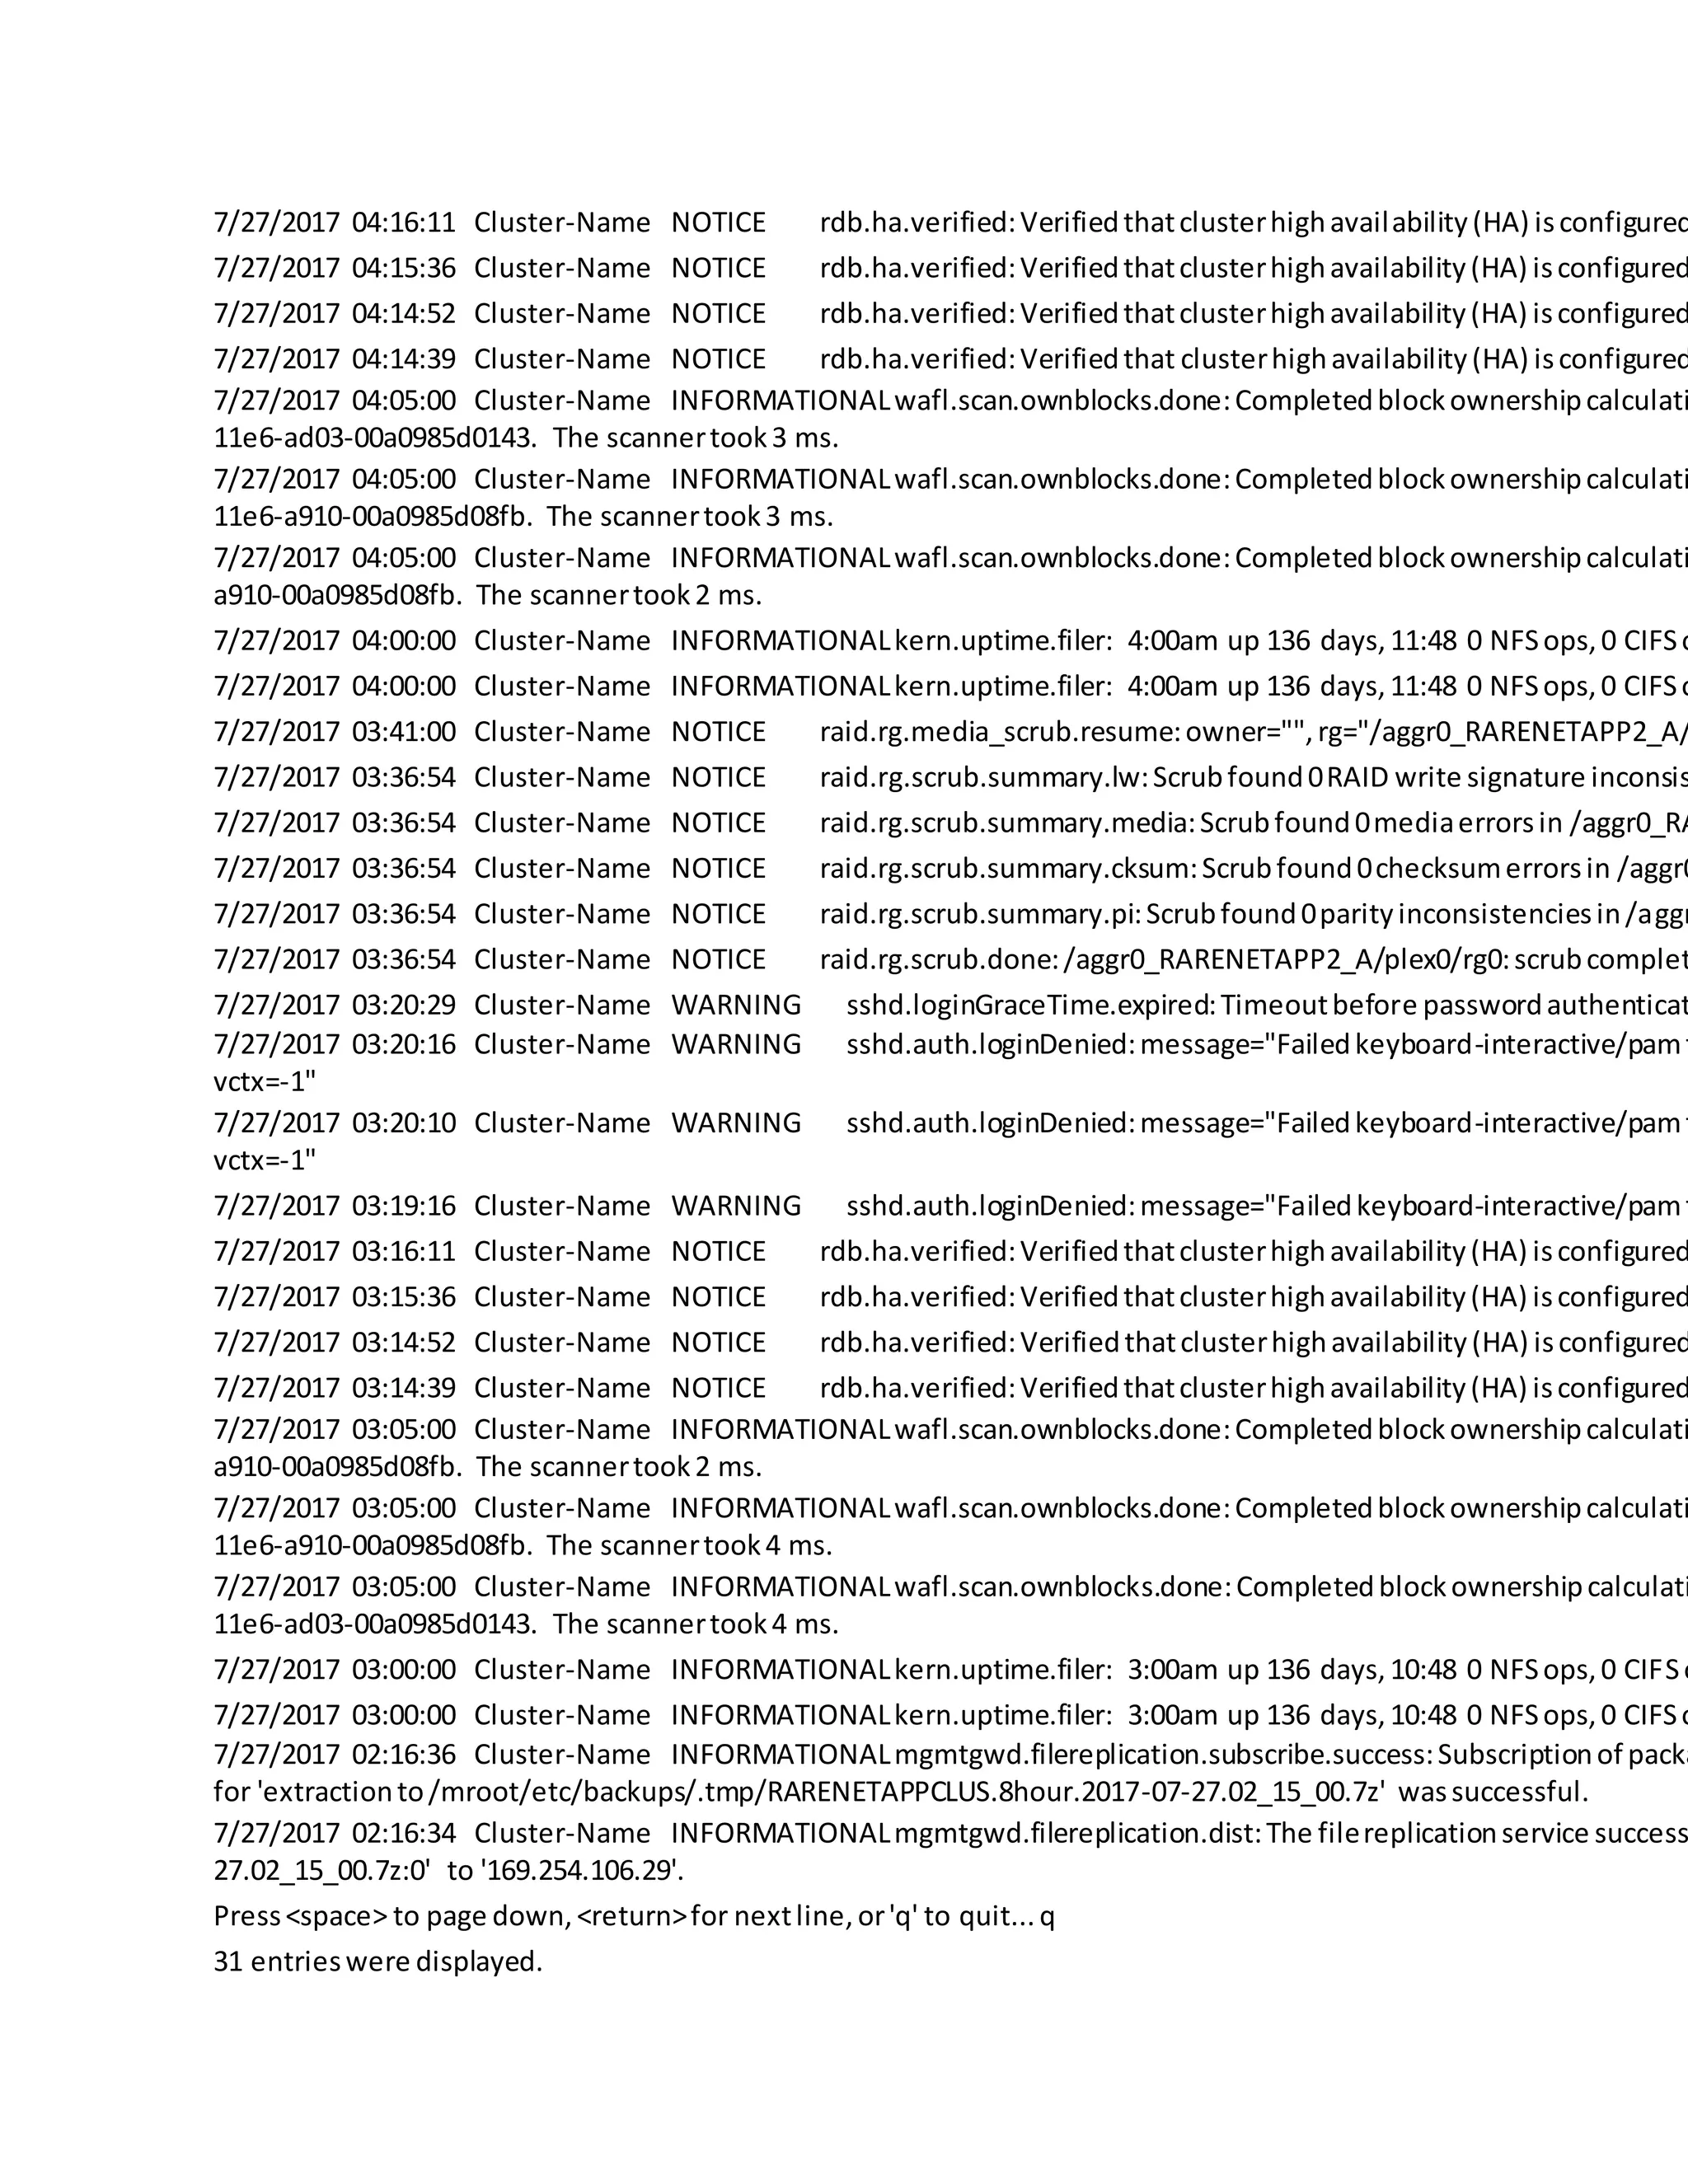
Example-:
CMODE_AA::> eventlogshow
Time Node Severity Event
------------------- ---------------- ------------- ---------------------------
7/27/2017 04:24:39 Cluster-Name NOTICE rdb.ha.verified:Verifiedthatclusterhighavailability(HA) isconfigured
7/27/2017 04:16:11 Cluster-Name NOTICE rdb.ha.verified:Verifiedthatclusterhighavailability(HA) isconfigured
7/27/2017 04:15:36 Cluster-Name NOTICE rdb.ha.verified:Verifiedthatclusterhighavailability(HA) isconfigured
7/27/2017 04:14:52 Cluster-Name NOTICE rdb.ha.verified:Verifiedthatclusterhighavailability(HA) isconfigured
7/27/2017 04:14:39 Cluster-Name NOTICE rdb.ha.verified:Verifiedthat clusterhighavailability(HA) isconfigured
7/27/2017 04:05:00 Cluster-Name INFORMATIONALwafl.scan.ownblocks.done:Completedblockownershipcalculati
11e6-ad03-00a0985d0143. The scannertook3 ms.
7/27/2017 04:05:00 Cluster-Name INFORMATIONALwafl.scan.ownblocks.done:Completedblockownershipcalculati
11e6-a910-00a0985d08fb. The scannertook3 ms.
7/27/2017 04:05:00 Cluster-Name INFORMATIONALwafl.scan.ownblocks.done:Completedblockownershipcalculati
a910-00a0985d08fb. The scannertook2 ms.
7/27/2017 04:00:00 Cluster-Name INFORMATIONALkern.uptime.filer: 4:00am up 136 days,11:48 0 NFSops,0 CIFSo
7/27/2017 03:41:00 Cluster-Name NOTICE raid.rg.media_scrub.resume:owner="",rg="/aggr0_RARENETAPP2_A/
7/27/2017 03:36:54 Cluster-Name NOTICE raid.rg.scrub.summary.lw:Scrubfound0RAID write signature inconsis
7/27/2017 03:36:54 Cluster-Name NOTICE raid.rg.scrub.summary.media:Scrubfound0mediaerrorsin /aggr0_RA
7/27/2017 03:36:54 Cluster-Name NOTICE raid.rg.scrub.summary.cksum:Scrubfound0checksumerrorsin /aggr0
7/27/2017 03:36:54 Cluster-Name NOTICE raid.rg.scrub.summary.pi:Scrubfound0parityinconsistenciesin/aggr
7/27/2017 03:36:54 Cluster-Name NOTICE raid.rg.scrub.done:/aggr0_RARENETAPP2_A/plex0/rg0:scrubcomplet
7/27/2017 03:20:29 Cluster-Name WARNING sshd.loginGraceTime.expired:Timeoutbefore passwordauthenticat
7/27/2017 03:20:16 Cluster-Name WARNING sshd.auth.loginDenied:message="Failedkeyboard-interactive/pamf
vctx=-1"
7/27/2017 03:20:10 Cluster-Name WARNING sshd.auth.loginDenied:message="Failedkeyboard-interactive/pamf
vctx=-1"
7/27/2017 03:19:16 Cluster-Name WARNING sshd.auth.loginDenied:message="Failedkeyboard-interactive/pamf
7/27/2017 03:16:11 Cluster-Name NOTICE rdb.ha.verified:Verifiedthatclusterhighavailability(HA) isconfigured
7/27/2017 03:15:36 Cluster-Name NOTICE rdb.ha.verified:Verifiedthatclusterhighavailability(HA) isconfigured
7/27/2017 03:14:52 Cluster-Name NOTICE rdb.ha.verified:Verifiedthatclusterhighavailability(HA) isconfigured
7/27/2017 03:14:39 Cluster-Name NOTICE rdb.ha.verified:Verifiedthatclusterhighavailability(HA) isconfigured
7/27/2017 03:05:00 Cluster-Name INFORMATIONALwafl.scan.ownblocks.done:Completedblockownershipcalculati
a910-00a0985d08fb. The scannertook2 ms.
7/27/2017 03:05:00 Cluster-Name INFORMATIONALwafl.scan.ownblocks.done:Completedblockownershipcalculati
11e6-a910-00a0985d08fb. The scannertook4 ms.
7/27/2017 03:05:00 Cluster-Name INFORMATIONALwafl.scan.ownblocks.done:Completedblockownershipcalculati
11e6-ad03-00a0985d0143. The scannertook4 ms.
7/27/2017 03:00:00 Cluster-Name INFORMATIONALkern.uptime.filer: 3:00am up 136 days,10:48 0 NFSops,0 CIFSo
7/27/2017 02:16:36 Cluster-Name INFORMATIONALmgmtgwd.filereplication.subscribe.success:Subscriptionof packa
for 'extractionto/mroot/etc/backups/.tmp/RARENETAPPCLUS.8hour.2017-07-27.02_15_00.7z' wassuccessful.
7/27/2017 02:16:34 Cluster-Name INFORMATIONALmgmtgwd.filereplication.dist:The filereplicationservice success
27.02_15_00.7z:0' to '169.254.106.29'.
Press<space> to page down,<return>for nextline,or'q' to quit...q
31 entrieswere displayed.
Press<space> to page down, <return> for next line,or 'q' to quit...
How to viewlog filesovera specifictime in ClusteredData ONTAP
Syntex-:
CMODE_AA:>::> eventlog show-time <"MM/DD/YYYY HH:MM:SS">
Example-:
CMODE_AA::>eventlogshow-time "07/12/2017 00:00:00"
EMs events can be viewed by specifying the exact dates that you would like to view:
CMODE_AA::>event log show -time 11/7/2012 *|11/6/2012 *|11/5/2012 *|11/4/2012 *|11/3/2012 *|11/2/2012 *|11/1/2012
EMS events can also be viewed by specifying a date range that you would like to view:
CMODE_AA::> event log show -time "11/01/2012 00:00:00".."11/08/2012 00:00:00"
EMS logs can be viewed from clustershell over a period of elapsed time, example, 5 minutes:
CMODE_AA::> event log show -time >5m
Time Node Severity Event
Note-Take the output of the eventlogs and search the reasonfor the issue
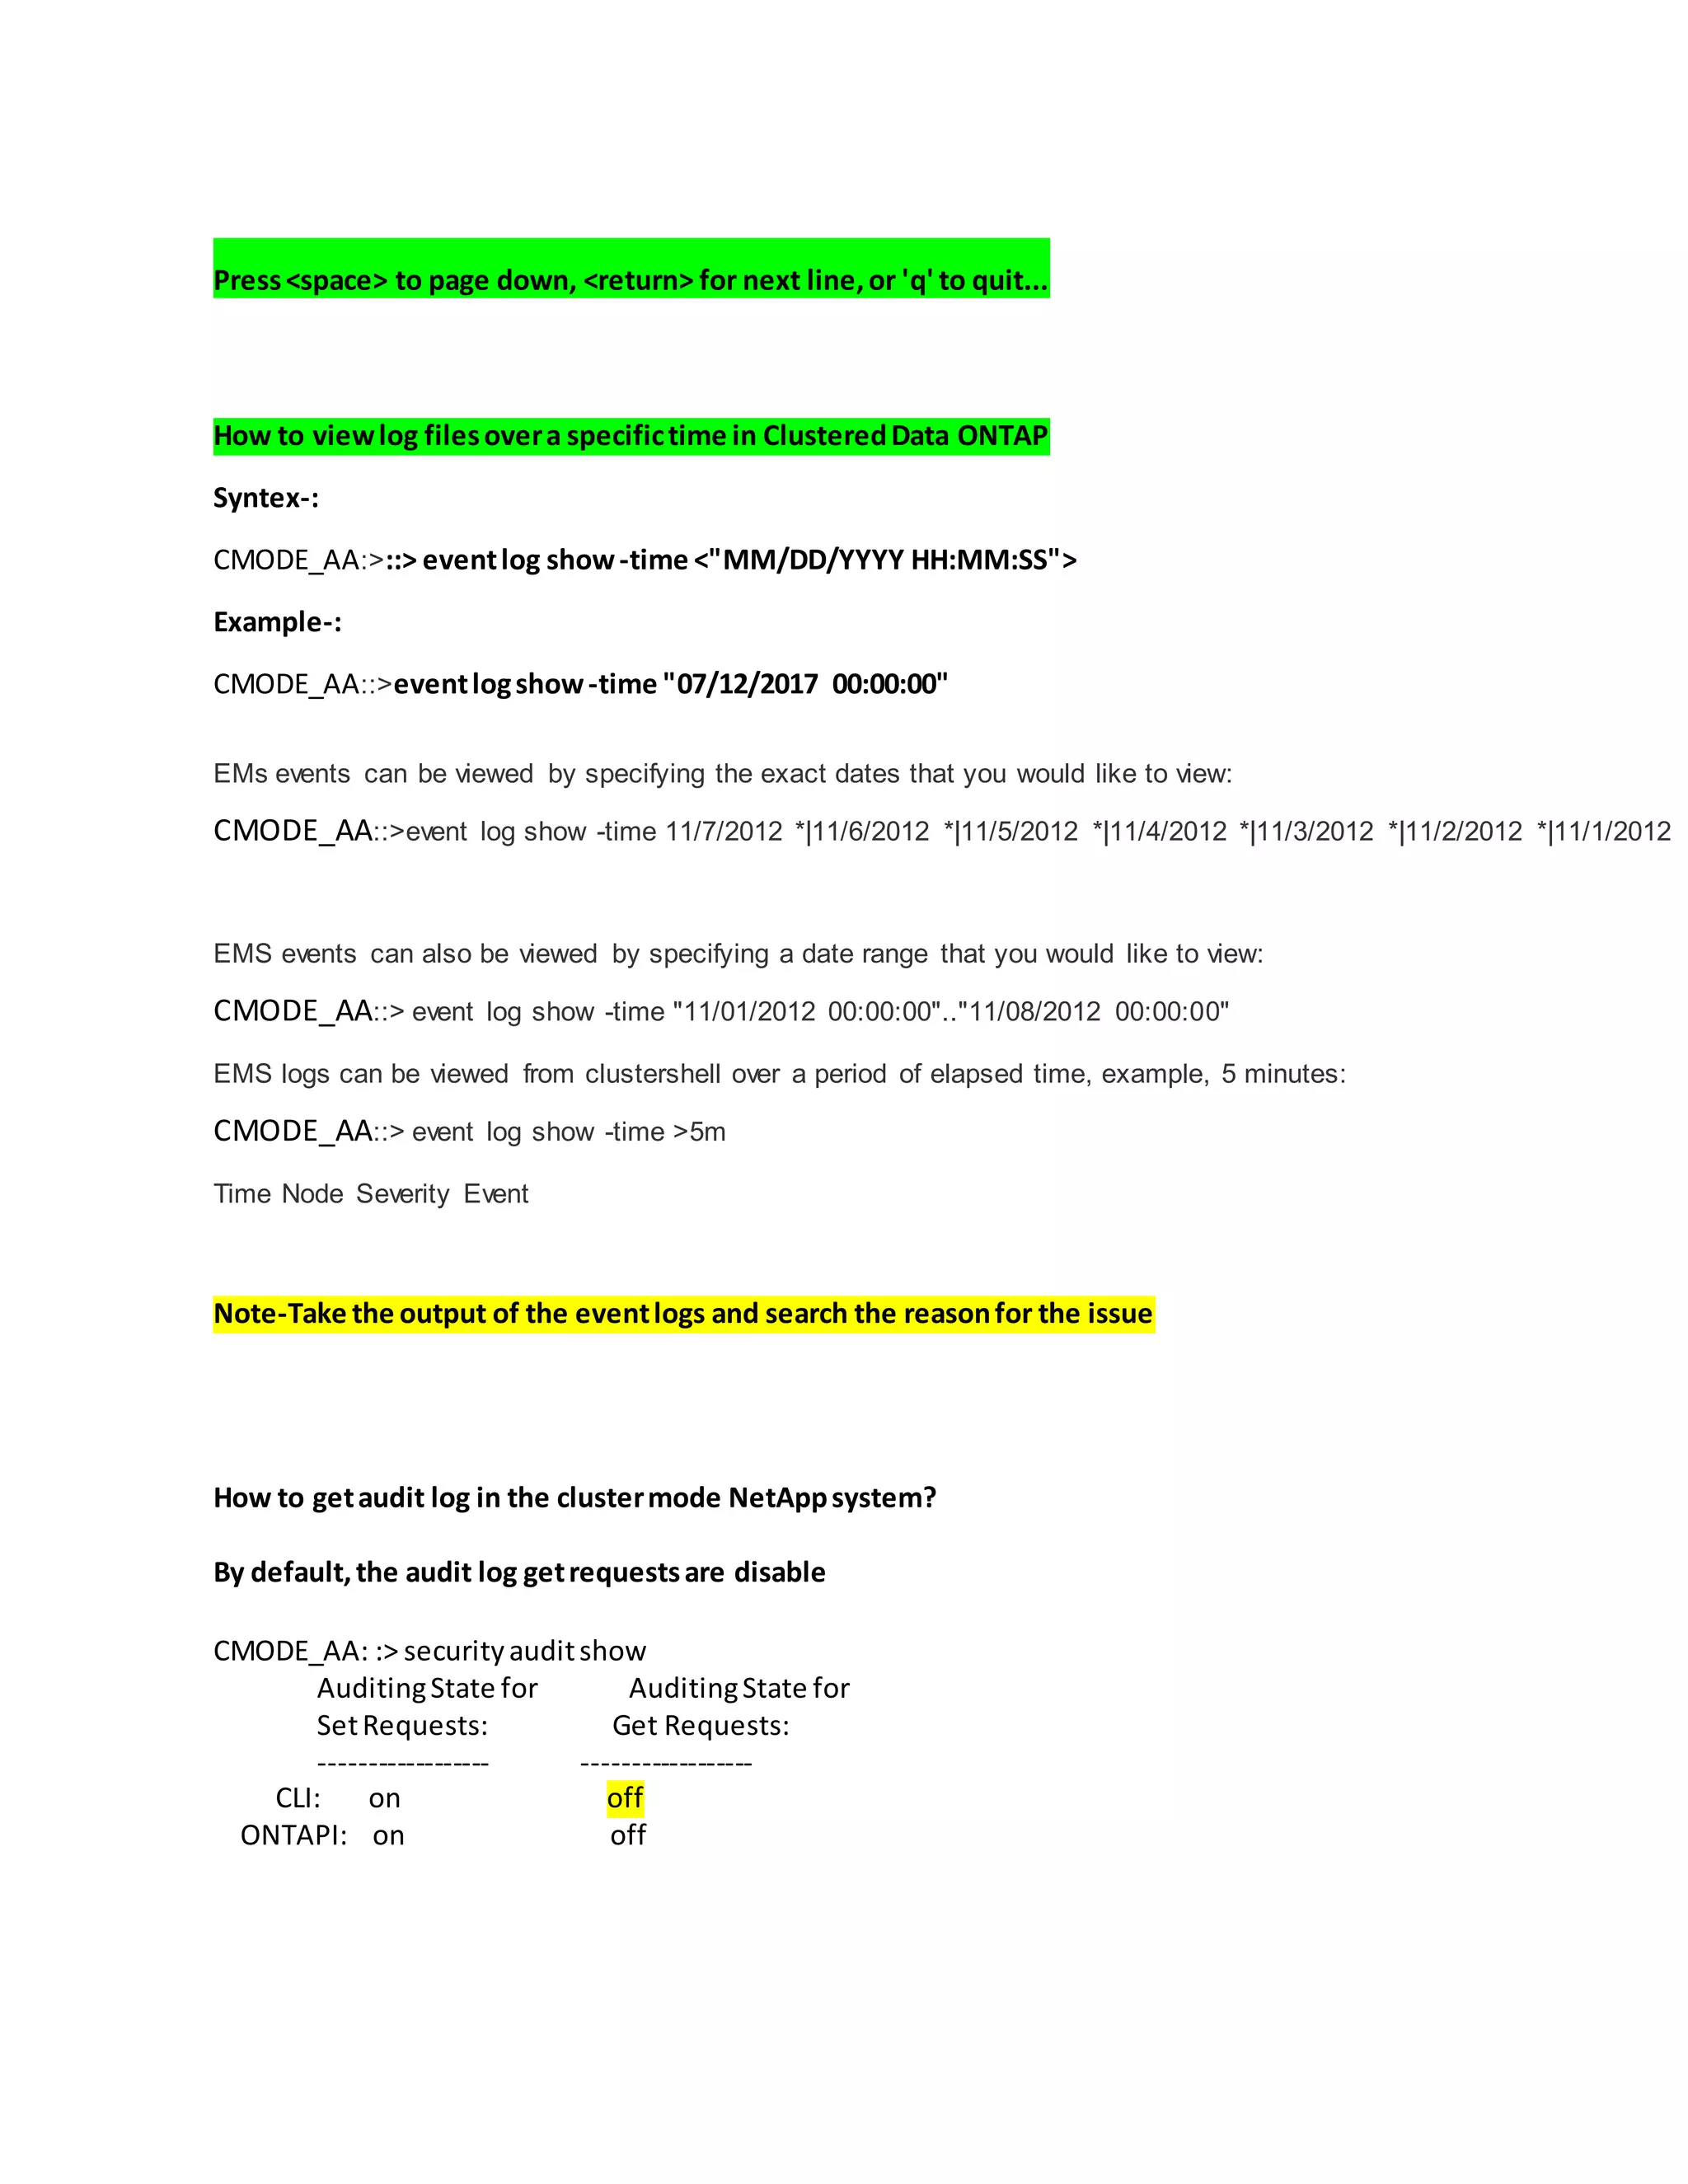
How to getaudit log in the clustermode NetAppsystem?
By default,the audit log getrequestsare disable
CMODE_AA: :> securityauditshow
AuditingState for AuditingState for
SetRequests: Get Requests:
------------------ ------------------
CLI: on off
ONTAPI: on off
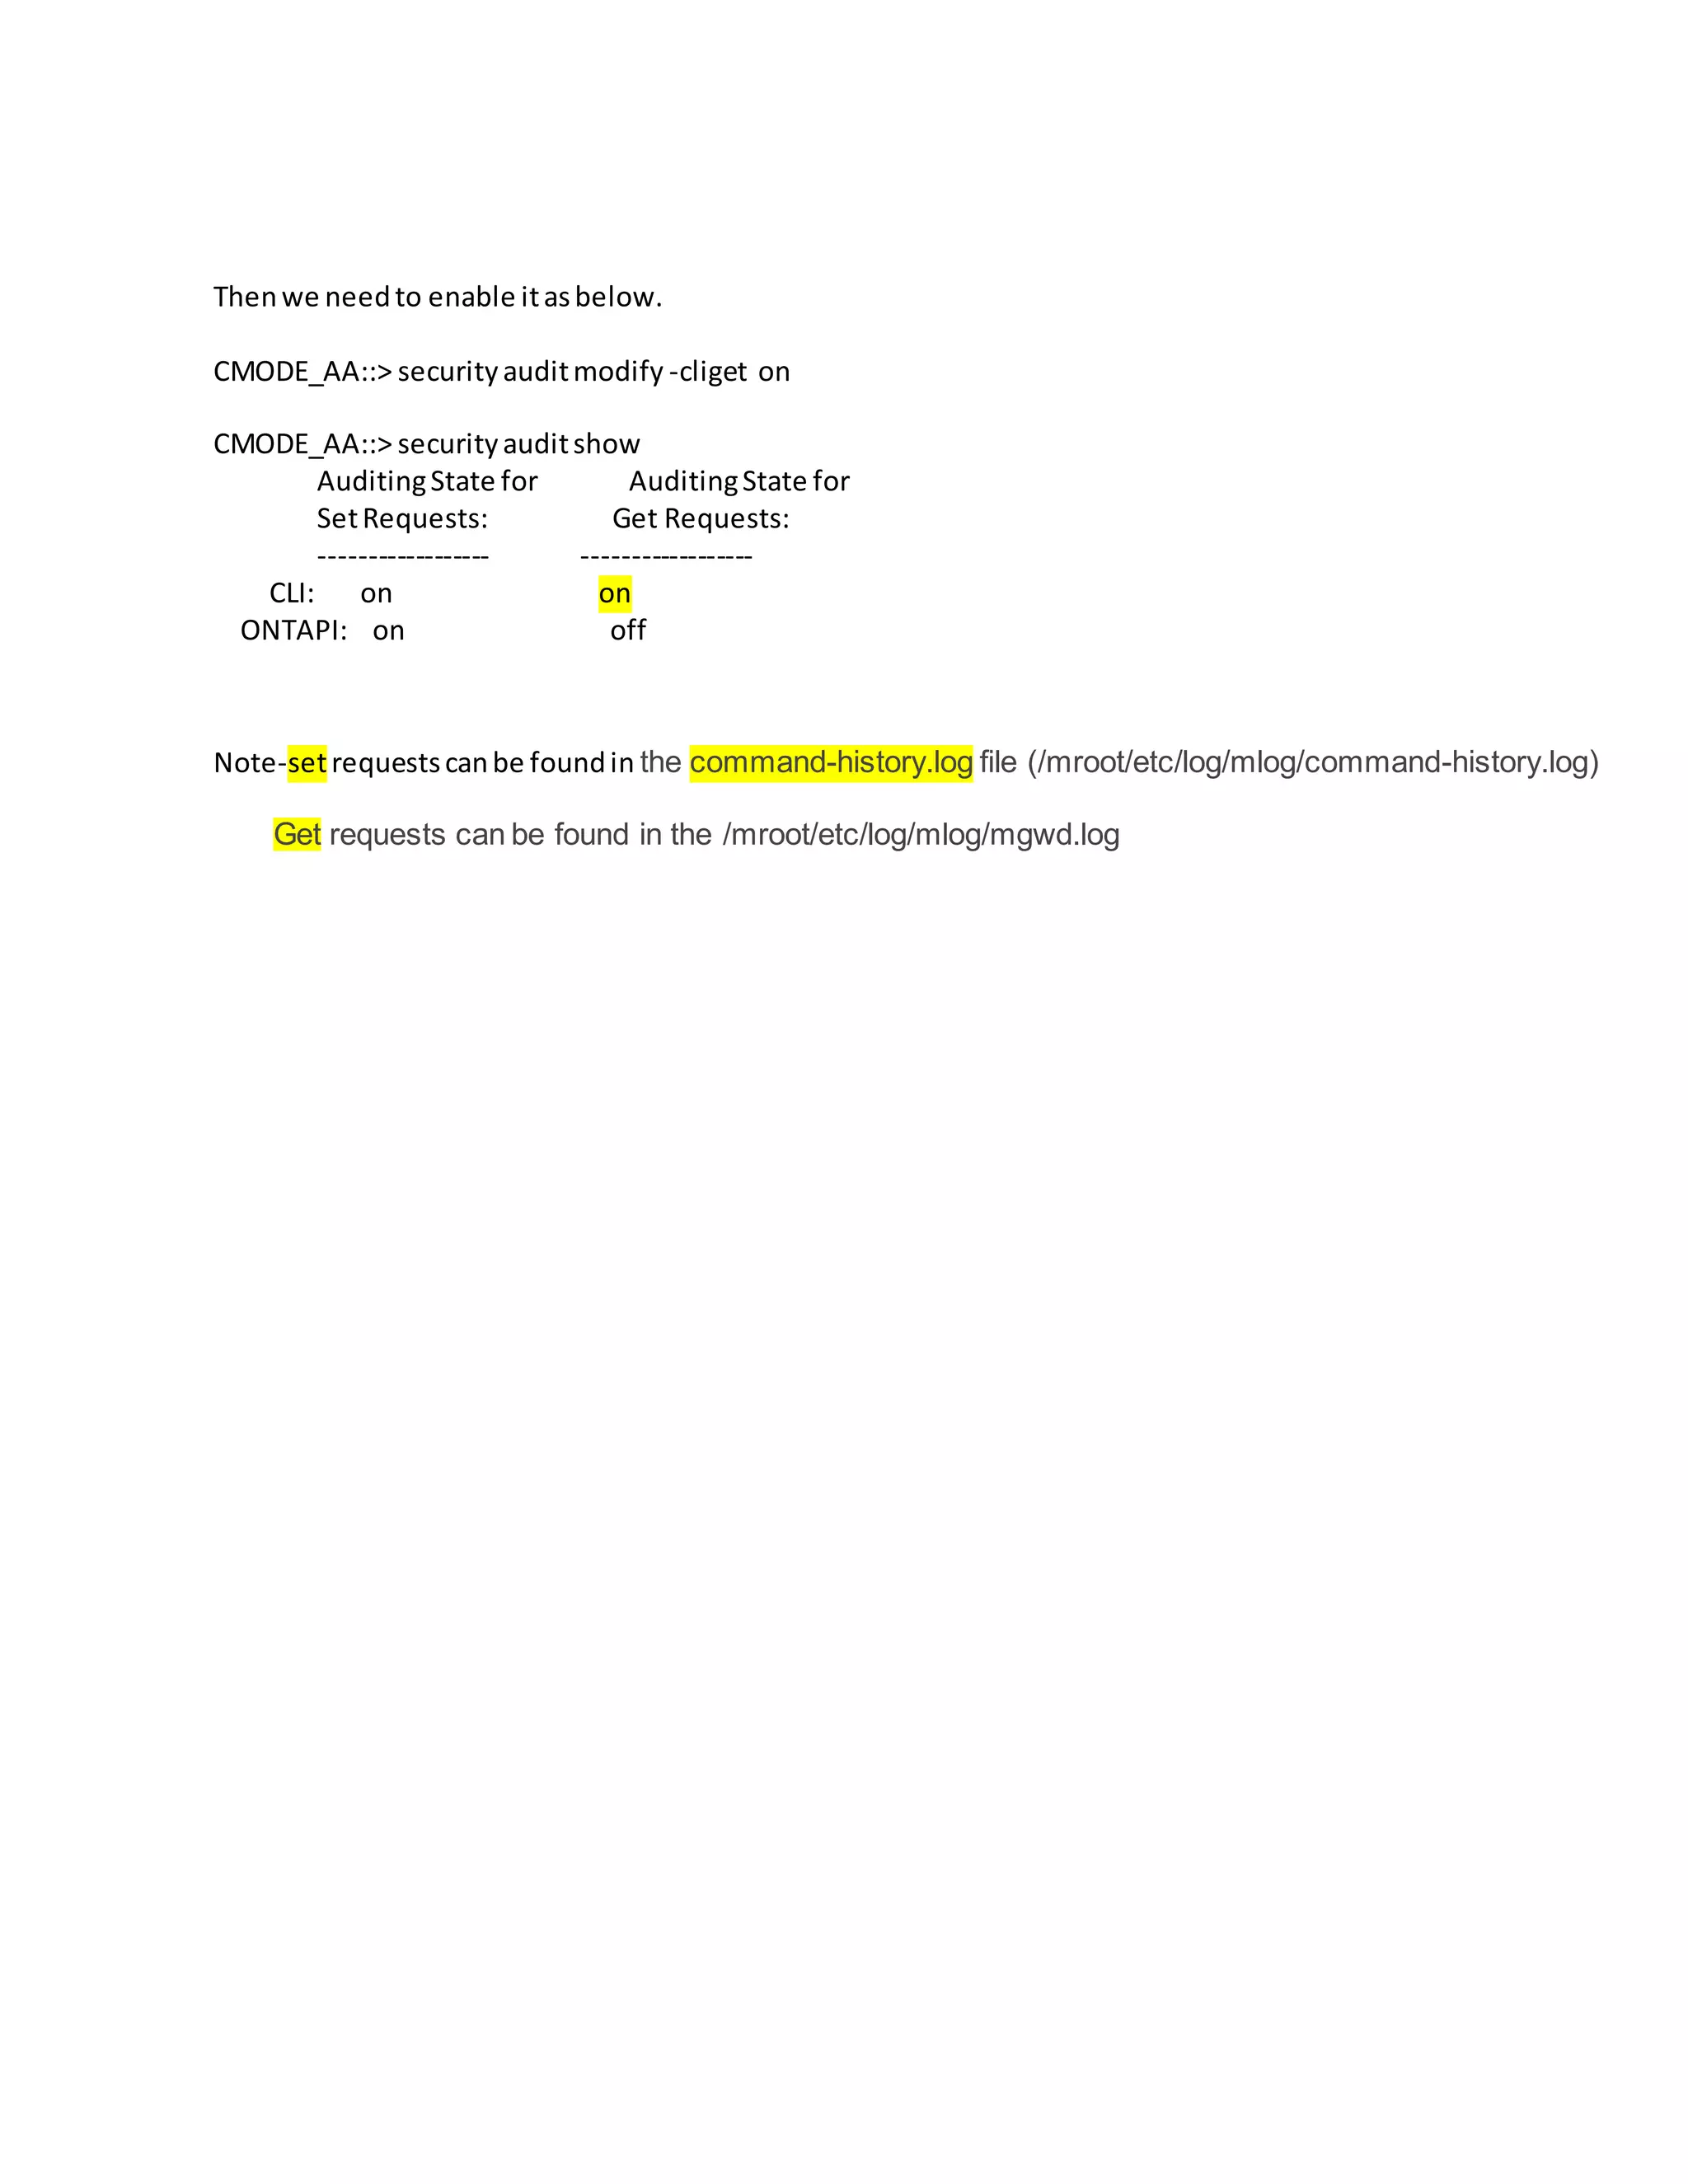
Thenwe needto enable itasbelow.
CMODE_AA::> securityauditmodify -cliget on
CMODE_AA::> securityauditshow
AuditingState for AuditingState for
SetRequests: Get Requests:
------------------ ------------------
CLI: on on
ONTAPI: on off
Note-setrequestscanbe foundin the command-history.log file (/mroot/etc/log/mlog/command-history.log)
Get requests can be found in the /mroot/etc/log/mlog/mgwd.log
How to see the event and audit logs through ( gui and cli) in cluster ontap netapp storage system

How to see the event and audit logs through ( gui and cli) in cluster ontap netapp storage system

  • 1.
    HOW TO SEEEVENT and AUDIT LOGSIN CLUSTER ONTAP NETAPP STORAGE SYSTEM THROUGH GUI AND CLI (Graphical user Interface and command line) Through web-browser-(GUI-Graphical UserInterface) log files (http:// or https://) https://cluster-mgmt-ip/spi/node-name/etc/log/ Through web-browser-:
  • 2.
    core dump files(http:// or https://) https://cluster-mgmt-ip/spi/node-name/etc/crash/ ***If there is an issue on your cluster NetApp storage system you want to analyze, troubleshoot or want to find the solid reason for RCA (Root Cause Analysis) then log file plays a vital role. There are multiple log files in Clustered Data ONTAP. When reading log files, the EMS (Event Management System) log file should be referenced first, as it provides a centralized log location for all subsystems within the cluster, vservers, and nodes. Through CLI(command line)-: Login into your cluster system and execute the below command. (EMS events can be viewed from the cluster-shell) Nodename ::>eventlogshow It will show you all the eventlogsand press space key to page down or use Enter keyto one line down or press q to quit. (Youcan analyze the logsif there is any error persists) Example-: CMODE_AA::> eventlogshow Time Node Severity Event ------------------- ---------------- ------------- --------------------------- 7/27/2017 04:24:39 Cluster-Name NOTICE rdb.ha.verified:Verifiedthatclusterhighavailability(HA) isconfigured
  • 3.
    7/27/2017 04:16:11 Cluster-NameNOTICE rdb.ha.verified:Verifiedthatclusterhighavailability(HA) isconfigured 7/27/2017 04:15:36 Cluster-Name NOTICE rdb.ha.verified:Verifiedthatclusterhighavailability(HA) isconfigured 7/27/2017 04:14:52 Cluster-Name NOTICE rdb.ha.verified:Verifiedthatclusterhighavailability(HA) isconfigured 7/27/2017 04:14:39 Cluster-Name NOTICE rdb.ha.verified:Verifiedthat clusterhighavailability(HA) isconfigured 7/27/2017 04:05:00 Cluster-Name INFORMATIONALwafl.scan.ownblocks.done:Completedblockownershipcalculati 11e6-ad03-00a0985d0143. The scannertook3 ms. 7/27/2017 04:05:00 Cluster-Name INFORMATIONALwafl.scan.ownblocks.done:Completedblockownershipcalculati 11e6-a910-00a0985d08fb. The scannertook3 ms. 7/27/2017 04:05:00 Cluster-Name INFORMATIONALwafl.scan.ownblocks.done:Completedblockownershipcalculati a910-00a0985d08fb. The scannertook2 ms. 7/27/2017 04:00:00 Cluster-Name INFORMATIONALkern.uptime.filer: 4:00am up 136 days,11:48 0 NFSops,0 CIFSo 7/27/2017 04:00:00 Cluster-Name INFORMATIONALkern.uptime.filer: 4:00am up 136 days,11:48 0 NFSops,0 CIFSo 7/27/2017 03:41:00 Cluster-Name NOTICE raid.rg.media_scrub.resume:owner="",rg="/aggr0_RARENETAPP2_A/ 7/27/2017 03:36:54 Cluster-Name NOTICE raid.rg.scrub.summary.lw:Scrubfound0RAID write signature inconsis 7/27/2017 03:36:54 Cluster-Name NOTICE raid.rg.scrub.summary.media:Scrubfound0mediaerrorsin /aggr0_RA 7/27/2017 03:36:54 Cluster-Name NOTICE raid.rg.scrub.summary.cksum:Scrubfound0checksumerrorsin /aggr0 7/27/2017 03:36:54 Cluster-Name NOTICE raid.rg.scrub.summary.pi:Scrubfound0parityinconsistenciesin/aggr 7/27/2017 03:36:54 Cluster-Name NOTICE raid.rg.scrub.done:/aggr0_RARENETAPP2_A/plex0/rg0:scrubcomplet 7/27/2017 03:20:29 Cluster-Name WARNING sshd.loginGraceTime.expired:Timeoutbefore passwordauthenticat 7/27/2017 03:20:16 Cluster-Name WARNING sshd.auth.loginDenied:message="Failedkeyboard-interactive/pamf vctx=-1" 7/27/2017 03:20:10 Cluster-Name WARNING sshd.auth.loginDenied:message="Failedkeyboard-interactive/pamf vctx=-1" 7/27/2017 03:19:16 Cluster-Name WARNING sshd.auth.loginDenied:message="Failedkeyboard-interactive/pamf 7/27/2017 03:16:11 Cluster-Name NOTICE rdb.ha.verified:Verifiedthatclusterhighavailability(HA) isconfigured 7/27/2017 03:15:36 Cluster-Name NOTICE rdb.ha.verified:Verifiedthatclusterhighavailability(HA) isconfigured 7/27/2017 03:14:52 Cluster-Name NOTICE rdb.ha.verified:Verifiedthatclusterhighavailability(HA) isconfigured 7/27/2017 03:14:39 Cluster-Name NOTICE rdb.ha.verified:Verifiedthatclusterhighavailability(HA) isconfigured 7/27/2017 03:05:00 Cluster-Name INFORMATIONALwafl.scan.ownblocks.done:Completedblockownershipcalculati a910-00a0985d08fb. The scannertook2 ms. 7/27/2017 03:05:00 Cluster-Name INFORMATIONALwafl.scan.ownblocks.done:Completedblockownershipcalculati 11e6-a910-00a0985d08fb. The scannertook4 ms. 7/27/2017 03:05:00 Cluster-Name INFORMATIONALwafl.scan.ownblocks.done:Completedblockownershipcalculati 11e6-ad03-00a0985d0143. The scannertook4 ms. 7/27/2017 03:00:00 Cluster-Name INFORMATIONALkern.uptime.filer: 3:00am up 136 days,10:48 0 NFSops,0 CIFSo 7/27/2017 03:00:00 Cluster-Name INFORMATIONALkern.uptime.filer: 3:00am up 136 days,10:48 0 NFSops,0 CIFSo 7/27/2017 02:16:36 Cluster-Name INFORMATIONALmgmtgwd.filereplication.subscribe.success:Subscriptionof packa for 'extractionto/mroot/etc/backups/.tmp/RARENETAPPCLUS.8hour.2017-07-27.02_15_00.7z' wassuccessful. 7/27/2017 02:16:34 Cluster-Name INFORMATIONALmgmtgwd.filereplication.dist:The filereplicationservice success 27.02_15_00.7z:0' to '169.254.106.29'. Press<space> to page down,<return>for nextline,or'q' to quit...q 31 entrieswere displayed.
  • 4.
    Press<space> to pagedown, <return> for next line,or 'q' to quit... How to viewlog filesovera specifictime in ClusteredData ONTAP Syntex-: CMODE_AA:>::> eventlog show-time <"MM/DD/YYYY HH:MM:SS"> Example-: CMODE_AA::>eventlogshow-time "07/12/2017 00:00:00" EMs events can be viewed by specifying the exact dates that you would like to view: CMODE_AA::>event log show -time 11/7/2012 *|11/6/2012 *|11/5/2012 *|11/4/2012 *|11/3/2012 *|11/2/2012 *|11/1/2012 EMS events can also be viewed by specifying a date range that you would like to view: CMODE_AA::> event log show -time "11/01/2012 00:00:00".."11/08/2012 00:00:00" EMS logs can be viewed from clustershell over a period of elapsed time, example, 5 minutes: CMODE_AA::> event log show -time >5m Time Node Severity Event Note-Take the output of the eventlogs and search the reasonfor the issue How to getaudit log in the clustermode NetAppsystem? By default,the audit log getrequestsare disable CMODE_AA: :> securityauditshow AuditingState for AuditingState for SetRequests: Get Requests: ------------------ ------------------ CLI: on off ONTAPI: on off
  • 5.
    Thenwe needto enableitasbelow. CMODE_AA::> securityauditmodify -cliget on CMODE_AA::> securityauditshow AuditingState for AuditingState for SetRequests: Get Requests: ------------------ ------------------ CLI: on on ONTAPI: on off Note-setrequestscanbe foundin the command-history.log file (/mroot/etc/log/mlog/command-history.log) Get requests can be found in the /mroot/etc/log/mlog/mgwd.log