Graphing and Solving Quadratic Inequalities in Two Variables: A Step-by-Step Guide
Learn to identify boundary graphs, represent solution regions, and interpret shaded areas for quadratic inequalities involving two variables using graphical methods and examples.
Learning Objectives
At theend of the lesson, the learners should be
able to:
• Identify the boundary graph of a quadratic
inequality in two variables.
• Represent the solution region of quadratic
inequalities on the coordinate plane.
• Interpret the shaded region and
determine whether given points satisfy the
inequality.
4.
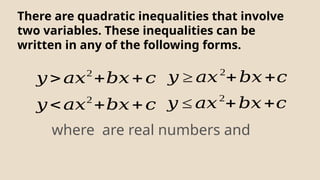
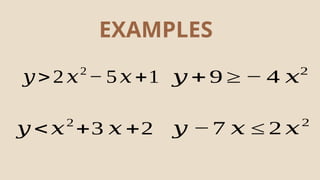
There are quadraticinequalities that involve
two variables. These inequalities can be
written in any of the following forms.
𝑦 >𝑎𝑥2
+𝑏𝑥+𝑐
𝑦 <𝑎𝑥2
+𝑏𝑥+𝑐
𝑦 ≥ 𝑎𝑥2
+𝑏𝑥+𝑐
𝑦 ≤ 𝑎𝑥2
+𝑏𝑥+𝑐
where are real numbers and
The solution setof quadratic inequalities
in two variables can be determined
graphically.
To do this, write the inequality as an
function, then show the graph. The graph
of the resulting parabola will be used to
graph the inequality.
REMEMBER THIS!
7.
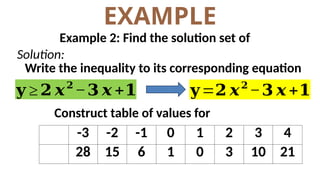
EXAMPLE
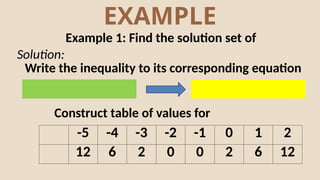
Example 1: Findthe solution set of
Solution:
Write the inequality to its corresponding equation
Construct table of values for
-5 -4 -3 -2 -1 0 1 2
12 6 2 0 0 2 6 12
8.
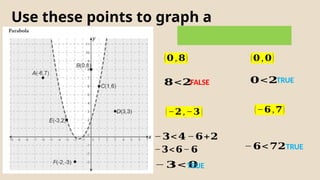
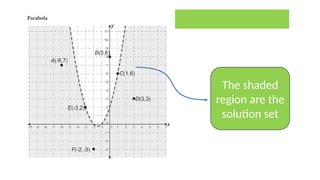
Use these pointsto graph a
parabola.
(𝟎,𝟖)
𝟖<𝟐FALSE
(𝟎,𝟎)
𝟎<𝟐TRUE
(−𝟐,−𝟑)
−𝟑<𝟔− 𝟔
−𝟑<𝟒−𝟔+𝟐
−𝟑< 𝟎
TRUE
(−𝟔,𝟕)
−𝟔<𝟕𝟐TRUE
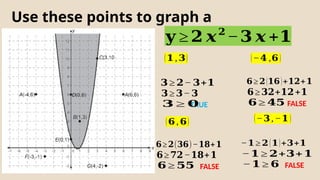
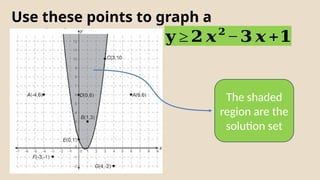
Use these pointsto graph a
parabola. 𝐲 ≥ 𝟐 𝒙𝟐
−𝟑 𝒙 +𝟏
The shaded
region are the
solution set
13.
1. Find thesolution set of then graph.
YOUR TURN!
2. Determine whether or not each of the
following points is a solution of the inequality .
Justify your answer.