Grade 11
Term 3 Revision
Development Geography
FOCUS Textbook – Pages 176-235
Presented by: Mr. Ismail
CHAPTER 1
The Concept of
Development
Units 1–4 | Terminology · Core Concepts · Indicators · Scale
Unit 1
Terminology
Unit 2
Core Concepts
Unit 3
Indicators
Unit 4
Scale
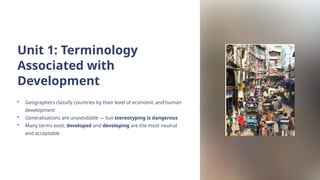
Unit 1: Terminology
Associated with
Development
• Geographers classify countries by their level of economic and human
development
• Generalisations are unavoidable — but stereotyping is dangerous
• Many terms exist; developed and developing are the most neutral
and acceptable
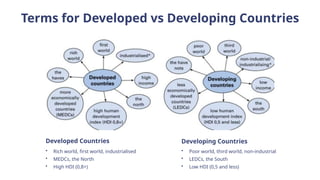
Terms for Developed vs Developing Countries
Developed Countries
• Rich world, first world, industrialised
• MEDCs, the North
• High HDI (0,8+)
Developing Countries
• Poor world, third world, non-industrial
• LEDCs, the South
• Low HDI (0,5 and less)
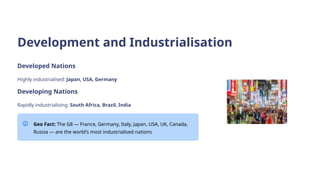
Development and Industrialisation
Developed Nations
Highly industrialised: Japan, USA, Germany
Developing Nations
Rapidly industrialising: South Africa, Brazil, India
Geo Fact: The G8 — France, Germany, Italy, Japan, USA, UK, Canada,
Russia — are the world's most industrialised nations
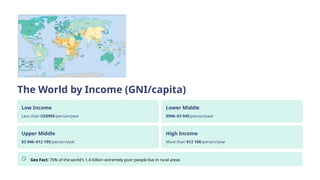
The World by Income (GNI/capita)
Low Income
Less than US$995/person/year
Lower Middle
$996–$3 945/person/year
Upper Middle
$3 946–$12 195/person/year
High Income
More than $12 196/person/year
Geo Fact: 70% of the world's 1,4 billion extremely poor people live in rural areas
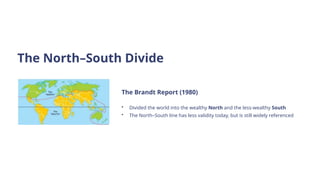
The North–South Divide
The Brandt Report (1980)
• Divided the world into the wealthy North and the less-wealthy South
• The North–South line has less validity today, but is still widely referenced
Key Terms: Unit 1
GNI
Gross National Income — total
value of all goods and services
produced in a country in a year,
including foreign earnings
GNI/capita
GNI divided by the country's
population — the average income
per person
MEDCs
More Economically Developed
Countries
LEDCs
Less Economically Developed Countries
HDI
Human Development Index
Unit 2: The Concept of Development
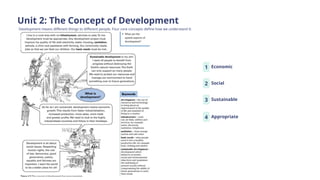
Development means different things to different people. Four core concepts define how we understand it:
1 Economic
2 Social
3 Sustainable
4 Appropriate
Four Core Concepts of Development
Economic
Faster industrialisation, increased production, more
trade and profits
Social
Human rights, rule of law, democracy, justice and
equality
Sustainable
Balancing economic, social and environmental
objectives for present and future generations
Appropriate
Meeting basic needs — electricity, water, housing,
sanitation, schools, clinics
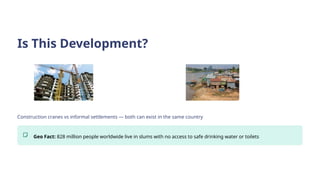
Is This Development?
Construction cranes vs informal settlements — both can exist in the same country
Geo Fact: 828 million people worldwide live in slums with no access to safe drinking water or toilets
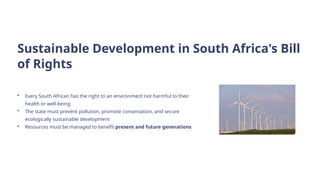
Sustainable Development in South Africa's Bill
of Rights
• Every South African has the right to an environment not harmful to their
health or well-being
• The state must prevent pollution, promote conservation, and secure
ecologically sustainable development
• Resources must be managed to benefit present and future generations
Key Terms: Unit 2
Development
Use of resources and technology to improve quality of life
and standard of living
Infrastructure
Road, rail, air links, utilities and services (water, electricity,
sanitation)
Sanitation
Clean sewage system and safe water
Basic needs
Food, clothing and shelter
Sustainable development
Balances economic, social and environmental objectives
without compromising future generations
Foreign exchange
Income earned by selling goods to other countries
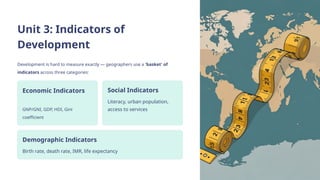
Unit 3: Indicators of
Development
Development is hard to measure exactly — geographers use a 'basket' of
indicators across three categories:
Economic Indicators
GNP/GNI, GDP, HDI, Gini
coefficient
Social Indicators
Literacy, urban population,
access to services
Demographic Indicators
Birth rate, death rate, IMR, life expectancy
Economic Indicators
GNP/GNI
Total value of all goods and
services produced, including
foreign earnings
GDP
Total value of all goods and
services produced within a
country in a year
GDP/capita
GDP divided by population —
average income per person
HDI
Combines life expectancy,
education and GDP/capita; world
average = 0,624
Gini coefficient
0 = total equality · 1 = total
inequality
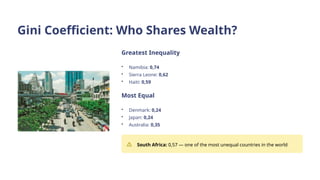
Gini Coefficient: Who Shares Wealth?
Greatest Inequality
• Namibia: 0,74
• Sierra Leone: 0,62
• Haiti: 0,59
Most Equal
• Denmark: 0,24
• Japan: 0,24
• Australia: 0,35
South Africa: 0,57 — one of the most unequal countries in the world
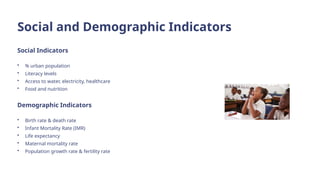
Social and Demographic Indicators
Social Indicators
• % urban population
• Literacy levels
• Access to water, electricity, healthcare
• Food and nutrition
Demographic Indicators
• Birth rate & death rate
• Infant Mortality Rate (IMR)
• Life expectancy
• Maternal mortality rate
• Population growth rate & fertility rate
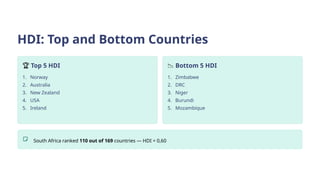
HDI: Top and Bottom Countries
🏆 Top 5 HDI
1. Norway
2. Australia
3. New Zealand
4. USA
5. Ireland
📉 Bottom 5 HDI
1. Zimbabwe
2. DRC
3. Niger
4. Burundi
5. Mozambique
South Africa ranked 110 out of 169 countries — HDI = 0,60
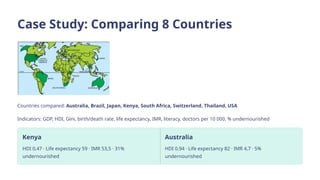
Case Study: Comparing 8 Countries
Countries compared: Australia, Brazil, Japan, Kenya, South Africa, Switzerland, Thailand, USA
Indicators: GDP, HDI, Gini, birth/death rate, life expectancy, IMR, literacy, doctors per 10 000, % undernourished
Kenya
HDI 0,47 · Life expectancy 59 · IMR 53,5 · 31%
undernourished
Australia
HDI 0,94 · Life expectancy 82 · IMR 4,7 · 5%
undernourished
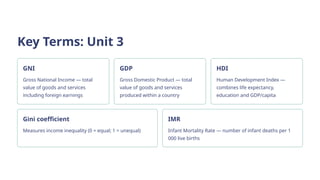
Key Terms: Unit 3
GNI
Gross National Income — total
value of goods and services
including foreign earnings
GDP
Gross Domestic Product — total
value of goods and services
produced within a country
HDI
Human Development Index —
combines life expectancy,
education and GDP/capita
Gini coefficient
Measures income inequality (0 = equal; 1 = unequal)
IMR
Infant Mortality Rate — number of infant deaths per 1
000 live births
Unit 4: Development at Different
Scales
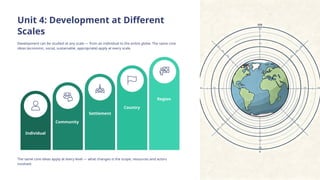
Development can be studied at any scale — from an individual to the entire globe. The same core
ideas (economic, social, sustainable, appropriate) apply at every scale.
Individual
Community
Settlement
Country
Region
The same core ideas apply at every level — what changes is the scope, resources and actors
involved.
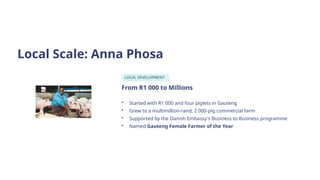
Local Scale: Anna Phosa
LOCAL DEVELOPMENT
From R1 000 to Millions
• Started with R1 000 and four piglets in Gauteng
• Grew to a multimillion-rand, 2 000-pig commercial farm
• Supported by the Danish Embassy's Business to Business programme
• Named Gauteng Female Farmer of the Year
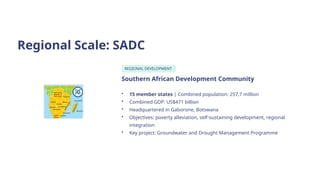
Regional Scale: SADC
REGIONAL DEVELOPMENT
Southern African Development Community
• 15 member states | Combined population: 257,7 million
• Combined GDP: US$471 billion
• Headquartered in Gaborone, Botswana
• Objectives: poverty alleviation, self-sustaining development, regional
integration
• Key project: Groundwater and Drought Management Programme
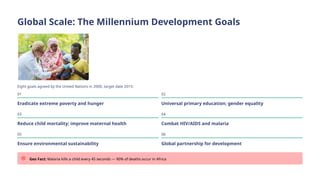
Global Scale: The Millennium Development Goals
Eight goals agreed by the United Nations in 2000, target date 2015:
01
Eradicate extreme poverty and hunger
02
Universal primary education; gender equality
03
Reduce child mortality; improve maternal health
04
Combat HIV/AIDS and malaria
05
Ensure environmental sustainability
06
Global partnership for development
Geo Fact: Malaria kills a child every 45 seconds — 90% of deaths occur in Africa
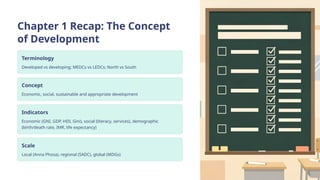
Chapter 1 Recap: The Concept
of Development
Terminology
Developed vs developing; MEDCs vs LEDCs; North vs South
Concept
Economic, social, sustainable and appropriate development
Indicators
Economic (GNI, GDP, HDI, Gini), social (literacy, services), demographic
(birth/death rate, IMR, life expectancy)
Scale
Local (Anna Phosa), regional (SADC), global (MDGs)
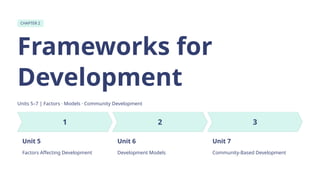
CHAPTER 2
Frameworks for
Development
Units 5–7 | Factors · Models · Community Development
Unit 5
Factors Affecting Development
Unit 6
Development Models
Unit 7
Community-Based Development
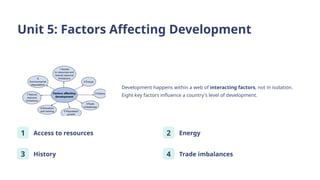
Unit 5: Factors Affecting Development
Development happens within a web of interacting factors, not in isolation.
Eight key factors influence a country's level of development.
1 Access to resources 2 Energy
3 History 4 Trade imbalances
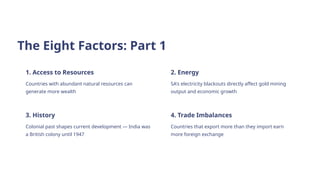
The Eight Factors: Part 1
1. Access to Resources
Countries with abundant natural resources can
generate more wealth
2. Energy
SA's electricity blackouts directly affect gold mining
output and economic growth
3. History
Colonial past shapes current development — India was
a British colony until 1947
4. Trade Imbalances
Countries that export more than they import earn
more foreign exchange
The Eight Factors: Part 2
5. Population Growth
Rapid growth can outpace economic development and
strain resources
6. Education and Training
A skilled workforce attracts investment and drives
innovation
7. Natural Resource Limitations
Landlocked countries or those with poor soils face
extra challenges
8. Environmental Degradation
Pollution, deforestation and land degradation reduce
productivity
Geo Fact: 1,5 billion people live in areas affected by political conflict and violence
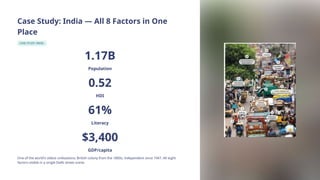
Case Study: India — All 8 Factors in One
Place
CASE STUDY: INDIA
1.17B
Population
0.52
HDI
61%
Literacy
$3,400
GDP/capita
One of the world's oldest civilisations; British colony from the 1800s; independent since 1947. All eight
factors visible in a single Delhi street scene.
Key Terms: Unit 5
Colony
A country under the political control of another country
Natural Resources
Materials found in nature used by people (e.g. minerals,
water, soil)
Degradation
The process of something being damaged or made
worse
EIA
Environmental Impact Assessment — a study to identify
and manage the environmental effects of a development
project before it begins
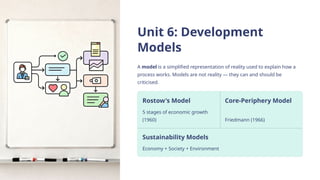
Unit 6: Development
Models
A model is a simplified representation of reality used to explain how a
process works. Models are not reality — they can and should be
criticised.
Rostow's Model
5 stages of economic growth
(1960)
Core-Periphery Model
Friedmann (1966)
Sustainability Models
Economy + Society + Environment
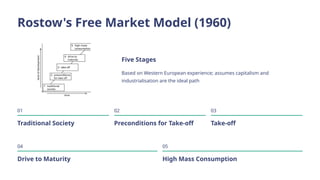
Rostow's Free Market Model (1960)
Five Stages
Based on Western European experience; assumes capitalism and
industrialisation are the ideal path
01
Traditional Society
02
Preconditions for Take-off
03
Take-off
04
Drive to Maturity
05
High Mass Consumption
Criticisms of Rostow's Model
Too narrow
Based only on West European countries — not universally applicable
Assumes capitalism
Not every country follows capitalism or industrialisation as the 'ideal'
path
Doesn't fit all
Many countries remain stuck at Stage 1 despite time and investment
Economic focus only
Focuses on economic growth only — ignores social development
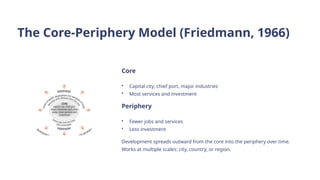
The Core-Periphery Model (Friedmann, 1966)
Core
• Capital city, chief port, major industries
• Most services and investment
Periphery
• Fewer jobs and services
• Less investment
Development spreads outward from the core into the periphery over time.
Works at multiple scales: city, country, or region.
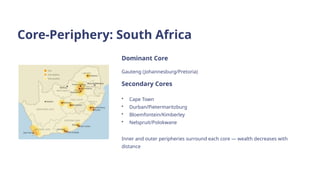
Core-Periphery: South Africa
Dominant Core
Gauteng (Johannesburg/Pretoria)
Secondary Cores
• Cape Town
• Durban/Pietermaritzburg
• Bloemfontein/Kimberley
• Nelspruit/Polokwane
Inner and outer peripheries surround each core — wealth decreases with
distance
Sustainability Models
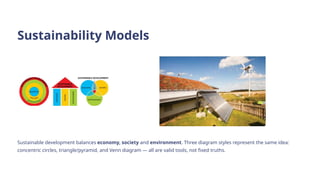
Sustainable development balances economy, society and environment. Three diagram styles represent the same idea:
concentric circles, triangle/pyramid, and Venn diagram — all are valid tools, not fixed truths.
Key Terms: Unit 6
Model
A simplified representation of reality used to explain a
process
Modernisation
The process of adapting to modern needs and habits
Capitalism
An economic system based on private ownership and
free markets
Tertiary Sector
The service sector of an economy (e.g. banking,
education, retail)
Unit 7: Community-Based
Development
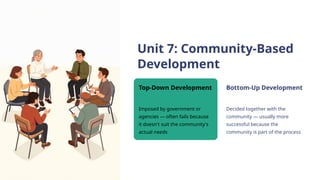
Top-Down Development
Imposed by government or
agencies — often fails because
it doesn't suit the community's
actual needs
Bottom-Up Development
Decided together with the
community — usually more
successful because the
community is part of the process
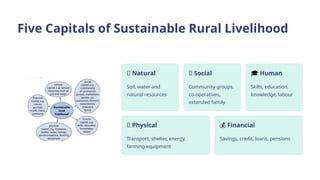
Five Capitals of Sustainable Rural Livelihood
🌿 Natural
Soil, water and
natural resources
🤝 Social
Community groups,
co-operatives,
extended family
🎓 Human
Skills, education,
knowledge, labour
🔧 Physical
Transport, shelter, energy,
farming equipment
💰 Financial
Savings, credit, loans, pensions
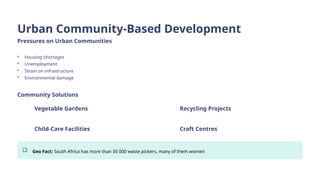
Urban Community-Based Development
Pressures on Urban Communities
• Housing shortages
• Unemployment
• Strain on infrastructure
• Environmental damage
Community Solutions
Vegetable Gardens Recycling Projects
Child-Care Facilities Craft Centres
Geo Fact: South Africa has more than 30 000 waste pickers, many of them women
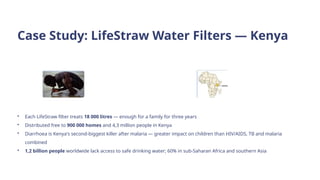
Case Study: LifeStraw Water Filters — Kenya
• Each LifeStraw filter treats 18 000 litres — enough for a family for three years
• Distributed free to 900 000 homes and 4,3 million people in Kenya
• Diarrhoea is Kenya's second-biggest killer after malaria — greater impact on children than HIV/AIDS, TB and malaria
combined
• 1,2 billion people worldwide lack access to safe drinking water; 60% in sub-Saharan Africa and southern Asia
Chapter 2 Recap: Frameworks
for Development
Factors
8 interacting factors —
resources, energy, history,
trade, population, education,
resource limits, environment
Models
Rostow (5 stages), Core-
Periphery (Friedmann),
Sustainability (economy +
society + environment)
Community Development
Top-down vs bottom-up; 5 capitals of rural livelihood; LifeStraw
(Kenya)
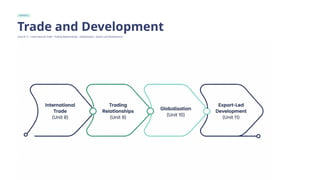
CHAPTER 3
Trade and Development
Units 8–11 | International Trade · Trading Relationships · Globalisation · Export-Led Development
Unit 8: International Trade and World Markets
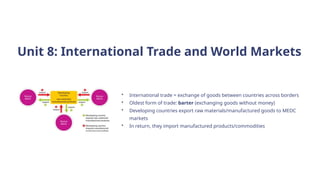
• International trade = exchange of goods between countries across borders
• Oldest form of trade: barter (exchanging goods without money)
• Developing countries export raw materials/manufactured goods to MEDC
markets
• In return, they import manufactured products/commodities
World's Most-Traded Commodities
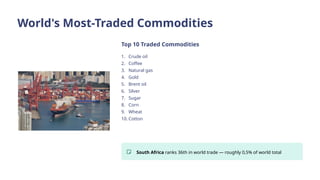
Top 10 Traded Commodities
1. Crude oil
2. Coffee
3. Natural gas
4. Gold
5. Brent oil
6. Silver
7. Sugar
8. Corn
9. Wheat
10. Cotton
South Africa ranks 36th in world trade — roughly 0,5% of world total
Top 10 World Trading Nations
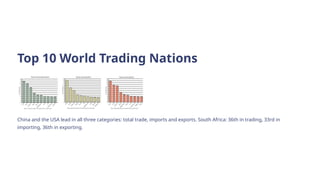
China and the USA lead in all three categories: total trade, imports and exports. South Africa: 36th in trading, 33rd in
importing, 36th in exporting.
Key Terms: Unit 8
Commodities
Raw materials or primary
agricultural products that can be
bought and sold
Barter
Exchanging goods or services
without using money
Export
Goods sold to another country
Import
Goods bought from another country
Raw Materials
Natural substances used to manufacture goods
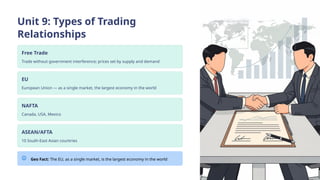
Unit 9: Types of Trading
Relationships
Free Trade
Trade without government interference; prices set by supply and demand
EU
European Union — as a single market, the largest economy in the world
NAFTA
Canada, USA, Mexico
ASEAN/AFTA
10 South-East Asian countries
Geo Fact: The EU, as a single market, is the largest economy in the world
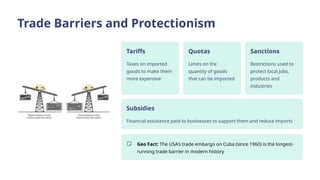
Trade Barriers and Protectionism
Tariffs
Taxes on imported
goods to make them
more expensive
Quotas
Limits on the
quantity of goods
that can be imported
Sanctions
Restrictions used to
protect local jobs,
products and
industries
Subsidies
Financial assistance paid to businesses to support them and reduce imports
Geo Fact: The USA's trade embargo on Cuba (since 1960) is the longest-
running trade barrier in modern history
Fairtrade
A trading partnership that pays farmers/producers better prices and ensures
better working conditions. Profits are shared more fairly with producers.
Fairtrade Products
• Coffee · Cocoa · Sugar · Tea
• Bananas · Cotton · Handicrafts
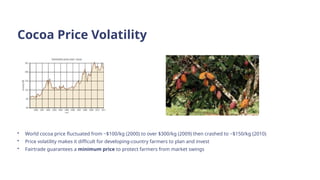
Cocoa Price Volatility
• World cocoa price fluctuated from ~$100/kg (2000) to over $300/kg (2009) then crashed to ~$150/kg (2010)
• Price volatility makes it difficult for developing-country farmers to plan and invest
• Fairtrade guarantees a minimum price to protect farmers from market swings
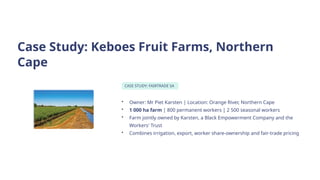
Case Study: Keboes Fruit Farms, Northern
Cape
CASE STUDY: FAIRTRADE SA
• Owner: Mr Piet Karsten | Location: Orange River, Northern Cape
• 1 000 ha farm | 800 permanent workers | 2 500 seasonal workers
• Farm jointly owned by Karsten, a Black Empowerment Company and the
Workers' Trust
• Combines irrigation, export, worker share-ownership and fair-trade pricing
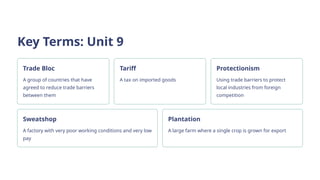
Key Terms: Unit 9
Trade Bloc
A group of countries that have
agreed to reduce trade barriers
between them
Tariff
A tax on imported goods
Protectionism
Using trade barriers to protect
local industries from foreign
competition
Sweatshop
A factory with very poor working conditions and very low
pay
Plantation
A large farm where a single crop is grown for export
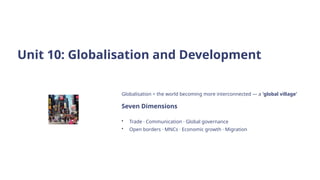
Unit 10: Globalisation and Development
Globalisation = the world becoming more interconnected — a 'global village'
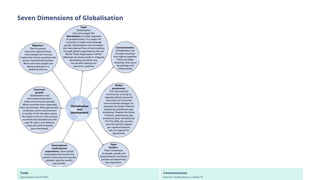
Seven Dimensions
• Trade · Communication · Global governance
• Open borders · MNCs · Economic growth · Migration
Seven Dimensions of Globalisation
Trade
Liberalisation via the WTO
Communication
Internet, mobile phones, satellite TV
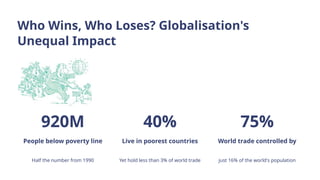
Who Wins, Who Loses? Globalisation's
Unequal Impact
920M
People below poverty line
Half the number from 1990
40%
Live in poorest countries
Yet hold less than 3% of world trade
75%
World trade controlled by
just 16% of the world's population
Criticisms of Globalisation
Cultural loss
Loss of family ties and cultural uniformity
Unemployment
Worsening unemployment and living conditions during financial crises
Unfair trade
Trade still controlled by quotas, tariffs and subsidies favouring wealthy countries
Environmental damage
Worsened environmental and ecological damage
Disease spread
Faster spread of diseases (HIV/AIDS, SARS)
Concentrated investment
Over 80% of direct investment concentrated in just 10 countries
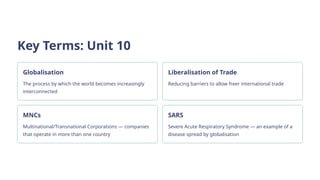
Key Terms: Unit 10
Globalisation
The process by which the world becomes increasingly
interconnected
Liberalisation of Trade
Reducing barriers to allow freer international trade
MNCs
Multinational/Transnational Corporations — companies
that operate in more than one country
SARS
Severe Acute Respiratory Syndrome — an example of a
disease spread by globalisation
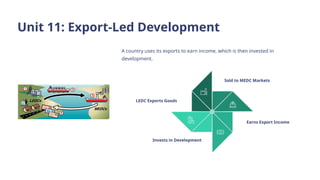
Unit 11: Export-Led Development
A country uses its exports to earn income, which is then invested in
development.
LEDC Exports Goods
Sold to MEDC Markets
Earns Export Income
Invests in Development
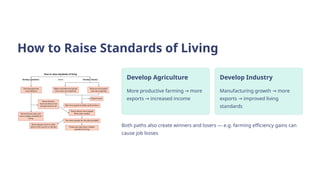
How to Raise Standards of Living
Develop Agriculture
More productive farming more
→
exports increased income
→
Develop Industry
Manufacturing growth more
→
exports improved living
→
standards
Both paths also create winners and losers — e.g. farming efficiency gains can
cause job losses
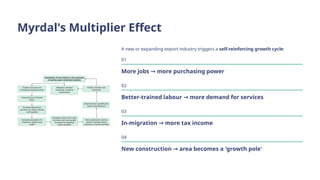
Myrdal's Multiplier Effect
A new or expanding export industry triggers a self-reinforcing growth cycle:
01
More jobs more purchasing power
→
02
Better-trained labour more demand for services
→
03
In-migration more tax income
→
04
New construction area becomes a 'growth pole'
→
Case Study: China's Export-Led Development
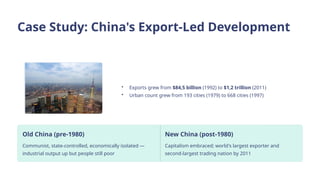
• Exports grew from $84,5 billion (1992) to $1,2 trillion (2011)
• Urban count grew from 193 cities (1979) to 668 cities (1997)
Old China (pre-1980)
Communist, state-controlled, economically isolated —
industrial output up but people still poor
New China (post-1980)
Capitalism embraced; world's largest exporter and
second-largest trading nation by 2011
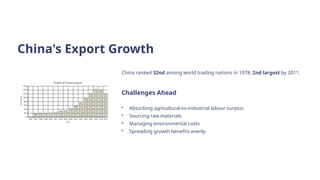
China's Export Growth
China ranked 32nd among world trading nations in 1978; 2nd largest by 2011.
Challenges Ahead
• Absorbing agricultural-to-industrial labour surplus
• Sourcing raw materials
• Managing environmental costs
• Spreading growth benefits evenly
Key Terms: Unit 11
Communism
A political and economic system
where the state owns all property
and controls the economy
Socialism
An economic system where the
state owns key industries and
redistributes wealth
Peasantry
Small-scale farmers who produce
mainly for their own use
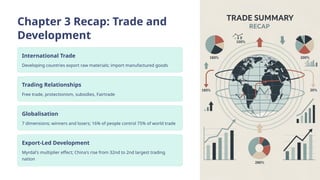
Chapter 3 Recap: Trade and
Development
International Trade
Developing countries export raw materials; import manufactured goods
Trading Relationships
Free trade, protectionism, subsidies, Fairtrade
Globalisation
7 dimensions; winners and losers; 16% of people control 75% of world trade
Export-Led Development
Myrdal's multiplier effect; China's rise from 32nd to 2nd largest trading
nation
CHAPTER 4
Development Issues and
Challenges
Units 12–14 | Women · Environment · State and Business
Unit 12
Women and Development
Unit 13
Development and the
Environment
Unit 14
Role of State and Business in SA
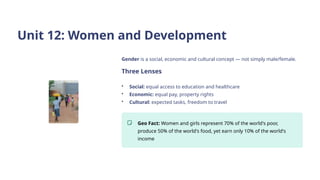
Unit 12: Women and Development
Gender is a social, economic and cultural concept — not simply male/female.
Three Lenses
• Social: equal access to education and healthcare
• Economic: equal pay, property rights
• Cultural: expected tasks, freedom to travel
Geo Fact: Women and girls represent 70% of the world's poor,
produce 50% of the world's food, yet earn only 10% of the world's
income
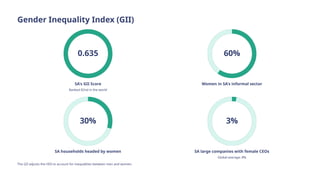
Gender Inequality Index (GII)
0.635
SA's GII Score
Ranked 82nd in the world
60%
Women in SA's informal sector
30%
SA households headed by women
3%
SA large companies with female CEOs
Global average: 8%
The GII adjusts the HDI to account for inequalities between men and women.
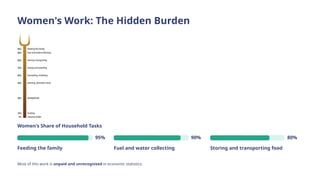
Women's Work: The Hidden Burden
Women's Share of Household Tasks
95%
Feeding the family
90%
Fuel and water collecting
80%
Storing and transporting food
Most of this work is unpaid and unrecognised in economic statistics.
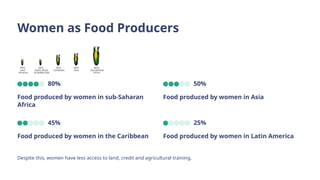
Women as Food Producers
80%
Food produced by women in sub-Saharan
Africa
50%
Food produced by women in Asia
45%
Food produced by women in the Caribbean
25%
Food produced by women in Latin America
Despite this, women have less access to land, credit and agricultural training.
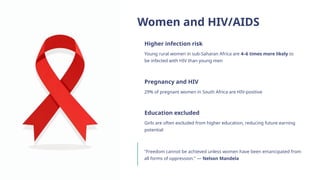
Women and HIV/AIDS
Higher infection risk
Young rural women in sub-Saharan Africa are 4–6 times more likely to
be infected with HIV than young men
Pregnancy and HIV
29% of pregnant women in South Africa are HIV-positive
Education excluded
Girls are often excluded from higher education, reducing future earning
potential
"Freedom cannot be achieved unless women have been emancipated from
all forms of oppression." — Nelson Mandela
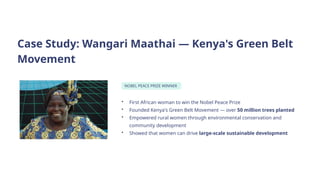
Case Study: Wangari Maathai — Kenya's Green Belt
Movement
NOBEL PEACE PRIZE WINNER
• First African woman to win the Nobel Peace Prize
• Founded Kenya's Green Belt Movement — over 50 million trees planted
• Empowered rural women through environmental conservation and
community development
• Showed that women can drive large-scale sustainable development
Key Terms: Unit 12
Gender
The social, economic and cultural roles and expectations
associated with being male or female
GII
Gender Inequality Index — measures gender-based
inequalities in health, empowerment and labour
Informal Sector
Economic activity not regulated or taxed by the
government
Permaculture
A system of agricultural and social design that mimics
natural ecosystems
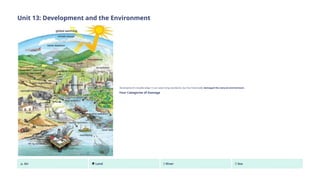
Unit 13: Development and the Environment
Development's double-edge: it can raise living standards, but has historically damaged the natural environment.
Four Categories of Damage
️
🌫️Air 🌍 Land 🌊 River 🌊 Sea
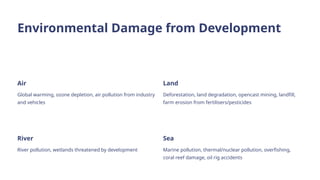
Environmental Damage from Development
Air
Global warming, ozone depletion, air pollution from industry
and vehicles
Land
Deforestation, land degradation, opencast mining, landfill,
farm erosion from fertilisers/pesticides
River
River pollution, wetlands threatened by development
Sea
Marine pollution, thermal/nuclear pollution, overfishing,
coral reef damage, oil rig accidents
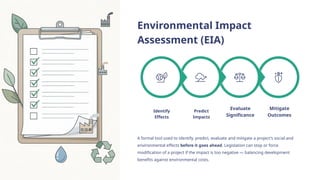
Environmental Impact
Assessment (EIA)
Mitigate
Outcomes
Evaluate
Significance
Predict
Impacts
Identify
Effects
A formal tool used to identify, predict, evaluate and mitigate a project's social and
environmental effects before it goes ahead. Legislation can stop or force
modification of a project if the impact is too negative — balancing development
benefits against environmental costs.
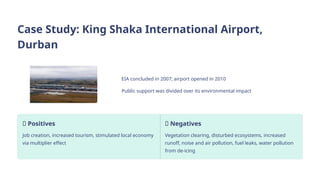
Case Study: King Shaka International Airport,
Durban
EIA concluded in 2007; airport opened in 2010
Public support was divided over its environmental impact
✅ Positives
Job creation, increased tourism, stimulated local economy
via multiplier effect
❌ Negatives
Vegetation clearing, disturbed ecosystems, increased
runoff, noise and air pollution, fuel leaks, water pollution
from de-icing
Carbon Emissions and Development
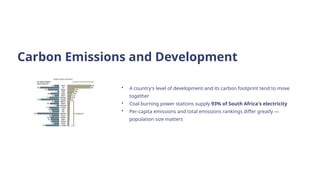
• A country's level of development and its carbon footprint tend to move
together
• Coal-burning power stations supply 93% of South Africa's electricity
• Per-capita emissions and total emissions rankings differ greatly —
population size matters
Key Terms: Unit 13
EIA (Environmental Impact
Assessment)
A study to identify and manage the
environmental effects of a
development project
Carbon Emissions
Greenhouse gases (mainly CO₂)
released by burning fossil fuels
Carbon Footprint
The total amount of greenhouse
gases produced by an individual,
organisation or country
Unit 14: The Role of the State and Business in
Development in South Africa
️
🏛️State
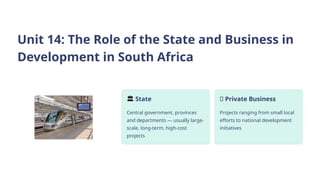
Central government, provinces
and departments — usually large-
scale, long-term, high-cost
projects
🏢 Private Business
Projects ranging from small local
efforts to national development
initiatives
South Africa's New Growth
Path (NGP)
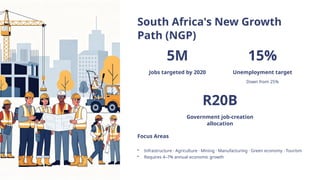
5M
Jobs targeted by 2020
15%
Unemployment target
Down from 25%
R20B
Government job-creation
allocation
Focus Areas
• Infrastructure · Agriculture · Mining · Manufacturing · Green economy · Tourism
• Requires 4–7% annual economic growth
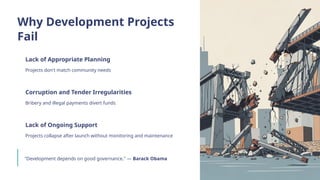
Why Development Projects
Fail
Lack of Appropriate Planning
Projects don't match community needs
Corruption and Tender Irregularities
Bribery and illegal payments divert funds
Lack of Ongoing Support
Projects collapse after launch without monitoring and maintenance
"Development depends on good governance." — Barack Obama
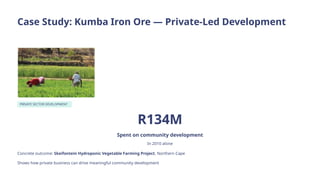
Case Study: Kumba Iron Ore — Private-Led Development
PRIVATE SECTOR DEVELOPMENT
R134M
Spent on community development
In 2010 alone
Concrete outcome: Skeifontein Hydroponic Vegetable Farming Project, Northern Cape
Shows how private business can drive meaningful community development
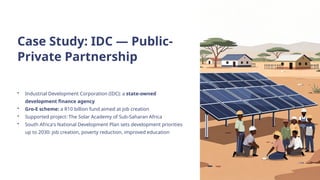
Case Study: IDC — Public-
Private Partnership
• Industrial Development Corporation (IDC): a state-owned
development finance agency
• Gro-E scheme: a R10 billion fund aimed at job creation
• Supported project: The Solar Academy of Sub-Saharan Africa
• South Africa's National Development Plan sets development priorities
up to 2030: job creation, poverty reduction, improved education
Key Terms: Unit 14
Green Economy
Economic activity that reduces
environmental risks and ecological
scarcities
Tender
A formal offer to supply goods or
services at a stated price
Food Security
Having reliable access to sufficient,
affordable and nutritious food
Beneficiation
Adding value to raw materials before exporting them
RDP
Reconstruction and Development Programme — South
Africa's post-apartheid development framework
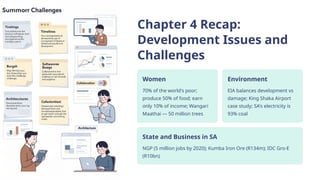
Chapter 4 Recap:
Development Issues and
Challenges
Women
70% of the world's poor;
produce 50% of food; earn
only 10% of income; Wangari
Maathai — 50 million trees
Environment
EIA balances development vs
damage; King Shaka Airport
case study; SA's electricity is
93% coal
State and Business in SA
NGP (5 million jobs by 2020); Kumba Iron Ore (R134m); IDC Gro-E
(R10bn)
CHAPTER 5
Role of Development Aid
Units 15–17 | Aid Concepts · Types of Aid · Impact of Aid
Unit 15
Aid and Co-operation
Unit 16
Types of Aid
Unit 17
Impact of Aid
Unit 15: Development Aid and Development
Co-operation
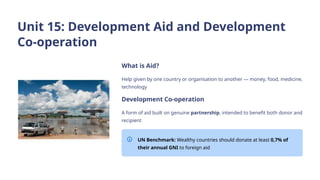
What is Aid?
Help given by one country or organisation to another — money, food, medicine,
technology
Development Co-operation
A form of aid built on genuine partnership, intended to benefit both donor and
recipient
UN Benchmark: Wealthy countries should donate at least 0,7% of
their annual GNI to foreign aid
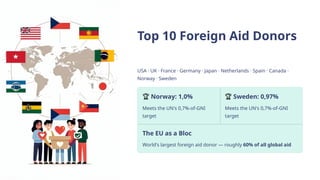
Top 10 Foreign Aid Donors
USA · UK · France · Germany · Japan · Netherlands · Spain · Canada ·
Norway · Sweden
🏆 Norway: 1,0%
Meets the UN's 0,7%-of-GNI
target
🏆 Sweden: 0,97%
Meets the UN's 0,7%-of-GNI
target
The EU as a Bloc
World's largest foreign aid donor — roughly 60% of all global aid
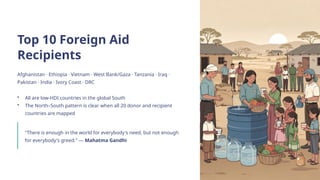
Top 10 Foreign Aid
Recipients
Afghanistan · Ethiopia · Vietnam · West Bank/Gaza · Tanzania · Iraq ·
Pakistan · India · Ivory Coast · DRC
• All are low-HDI countries in the global South
• The North–South pattern is clear when all 20 donor and recipient
countries are mapped
"There is enough in the world for everybody's need, but not enough
for everybody's greed." — Mahatma Gandhi
Key Terms: Unit 15
Aid
Help or assistance given by one
country or organisation to another
Development Co-
operation
A partnership approach to aid that
aims to benefit both donor and
recipient
GNI
Gross National Income — used to
calculate a country's aid
contribution as a percentage
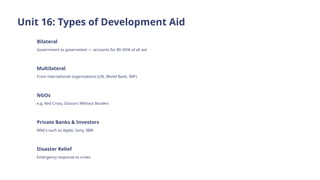
Unit 16: Types of Development Aid
Bilateral
Government to government — accounts for 80–85% of all aid
Multilateral
From international organisations (UN, World Bank, IMF)
NGOs
e.g. Red Cross, Doctors Without Borders
Private Banks & Investors
MNCs such as Apple, Sony, IBM
Disaster Relief
Emergency response to crises
Three Types: Technical, Conditional and
Humanitarian Aid
🔧 Technical Aid
Expertise, equipment and
technology — e.g. solar heating
systems, agricultural equipment,
dam building
️
⛓️Conditional ('Tied') Aid
Aid given with strings attached —
e.g. China develops African
infrastructure in exchange for
natural resources
🆘 Humanitarian Aid
Emergency relief — Red Cross,
Doctors Without Borders, UN, Gift
of the Givers
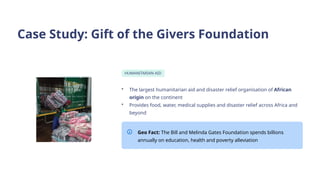
Case Study: Gift of the Givers Foundation
HUMANITARIAN AID
• The largest humanitarian aid and disaster relief organisation of African
origin on the continent
• Provides food, water, medical supplies and disaster relief across Africa and
beyond
Geo Fact: The Bill and Melinda Gates Foundation spends billions
annually on education, health and poverty alleviation
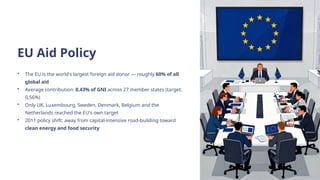
EU Aid Policy
• The EU is the world's largest foreign aid donor — roughly 60% of all
global aid
• Average contribution: 0,43% of GNI across 27 member states (target:
0,56%)
• Only UK, Luxembourg, Sweden, Denmark, Belgium and the
Netherlands reached the EU's own target
• 2011 policy shift: away from capital-intensive road-building toward
clean energy and food security
Key Terms: Unit 16
Bilateral Aid
Aid given directly from one
government to another
Multilateral Aid
Aid channelled through
international organisations
Humanitarian Aid
Emergency assistance provided to
people in crisis
Conditional/Tied Aid
Aid given with conditions attached that benefit the
donor
NGO
Non-Governmental Organisation — a non-profit group
working independently of government
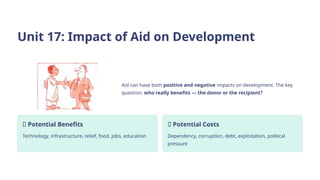
Unit 17: Impact of Aid on Development
Aid can have both positive and negative impacts on development. The key
question: who really benefits — the donor or the recipient?
✅ Potential Benefits
Technology, infrastructure, relief, food, jobs, education
❌ Potential Costs
Dependency, corruption, debt, exploitation, political
pressure
Positive Impacts of Aid
Access to Expertise
Modern technology and specialised skills
Infrastructure Funding
Expensive projects that countries cannot afford alone
Life-Saving Relief
Humanitarian and emergency assistance
Agricultural Yields
Improved food supply and farming methods
Job Creation
Via the multiplier effect
Education and Skills
Improved training and literacy
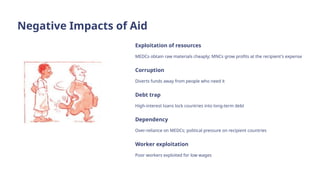
Negative Impacts of Aid
Exploitation of resources
MEDCs obtain raw materials cheaply; MNCs grow profits at the recipient's expense
Corruption
Diverts funds away from people who need it
Debt trap
High-interest loans lock countries into long-term debt
Dependency
Over-reliance on MEDCs; political pressure on recipient countries
Worker exploitation
Poor workers exploited for low wages