SEED AND
AGROCHEMICAL
PRODUCTION
INDUSTRY
Prepared for:
Professor Keifer
Professor McElfresh
Professor Marchese
Professor Lambert
September 16, 2014
1
Prepared by:
Team 2
Diana Wahl
Sharmaine Wilcox
Anthony Head
Ethan Dillhoff
Ryan Cobb
TRANSMITTAL DOCUMENT
2
September 16, 2014
EXECUTIVE SUMMARY
3
September 16, 2014
TABLE OF CONTENTS
INTRODUCTION
KEY SUCCESS FACTORS………………………………………………………………………………3
ENVIRONMENTAL ANALYSIS
INDUSTRY
• INTRODUCTION ……………………………………………………………………………………5
• SIZE AND GROWTH………………………………………………………………………….5
• TRENDS…………………………………………………………………………………......5
• INNOVATIVE TECHNOLOGY……………………………………………………………...….5
• SUPPLIERS & BUYERS………………………………………………………………………..5
MARKET
• SIZE AND GROWTH………………………………………………………………………………...6
• FUTURE…………………………………………………………………………………………….6
• WHEN AND WHY DO CUSTOMERS BUY…………………………………………………………….7
• GOVERNMENT REGULATIONS……………………………………………………………………...7
• CHARACTERISTICS OF PURCHASES………………………………………………………………...7
• PESTICIDES & FERTILIZERS…………………………………………………………………....7
• SEEDS……………………………………………………………………………………….7
COMPETITION
• PESTICIDE COMPETITION…………………………………………………………………………...8
• FERTILIZER COMPETITION…………………………………………………………………………...8
• RIVALRY…………………………………………………………………………………………...8
• GAINING A COMPETITIVE ADVANTAGE…………………………………………………………....8
KEY SUCCESS FACTORS
INTRODUCTION……………………………………………………………………….……9
YIELD POTENTIAL
• INNOVATIVE SEED AND CHEMICAL TECHNOLOGY...……………………………………………...10
• USE OF BIOTECHNOLOGY TO GENETICALLY MODIFY SEEDS..………………………………10
• SEED AND AGROCHEMICAL PRODUCT COLLABORATION……………………………………...…10
September 16, 2014 4
CONSUMER SAFETY
• MANUFACTURING CONTROL……………...……………………………………………….....11
• AGROCHEMICAL CONSUMER/ENVIRONMENTAL SAFETY..………………………………….…11
• SEED CONSUMER/ENVIRONMENTAL SAFETY…………………………………………………..12
• CROSS POLLINATION………………………………………………………………………….12
INTELLECTUAL PROPERTY
• SEED CONSUMER/ENVIRONMENTAL SAFETY…………………………………………………..12
• CROSS POLLINATION………………………………………………………………………….12
CONCLUSION
REFERENCES…………………………………………………………………………………..14
APPENDICES
• A. SIZE AND GROWTH………………………………………………………………………..18
• B. PEST ANALYSIS…………………………………………………………………………….18
• POLITICAL………………………………………………………………………………19
• ECONOMIC………………………………………………………………………….....20
• SOCIAL…………………………………………………………………………….......20
• TECHNOLOGY…………………………………………………………………………..21
• C. PORTERS FIVE FORCES……………………………………………………………………..22
• RIVALRY……………………………………………………………………………......23
• THREAT OF ENTRANTS………………………………………………………………......23
• THREAT OF SUBSTITUTES………………………………………………………………….23
• BARGAINING POWER OF SUPPLIERS………………………………………………….....24
• BARGAINING POWER OF BUYERS……………………………………………………….24
• D. TOP COMPANIES………………………………………………………………………….24
TABLE OF CONTENTS
September 16, 2014 5
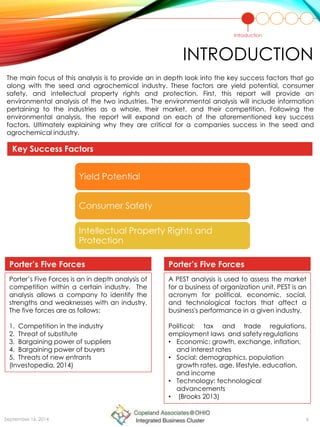
The main focus of this analysis is to provide an in depth look into the key success factors that go
along with the seed and agrochemical industry. These factors are yield potential, consumer
safety, and intellectual property rights and protection. First, this report will provide an
environmental analysis of the two industries. The environmental analysis will include information
pertaining to the industries as a whole, their market, and their competition. Following the
environmental analysis, the report will expand on each of the aforementioned key success
factors. Ultimately explaining why they are critical for a companies success in the seed and
agrochemical industry.
Introduction
Yield Potential
Consumer Safety
Intellectual Property Rights and
Protection
Key Success Factors
INTRODUCTION
September 16, 2014 6
A PEST analysis is used to assess the market
for a business of organization unit. PEST is an
acronym for political, economic, social,
and technological factors that affect a
business's performance in a given industry.
Political: tax and trade regulations,
employment laws and safety regulations
• Economic: growth, exchange, inflation,
and interest rates
• Social: demographics, population
growth rates, age, lifestyle, education,
and income
• Technology: technological
advancements
• (Brooks 2013)
Porter’s Five Forces is an in depth analysis of
competition within a certain industry. The
analysis allows a company to identify the
strengths and weaknesses with an industry.
The five forces are as follows:
1. Competition in the industry
2. Threat of substitute
3. Bargaining power of suppliers
4. Bargaining power of buyers
5. Threats of new entrants
(Investopedia, 2014)
Porter’s Five Forces Porter’s Five Forces
LIST OF ILLUSTRATIONS
7
September 16, 2014
INDUSTRY
Environmental
Analysis
The Crop Production industry has been around for 10,000 years but didn’t start to become a
globally competitive market until after World War II. The industrialization of the farming process
made the industry much more efficient. The increase in technology has allowed farmers to
maximize the amount of crop per acre, this is known as having a higher yield. One of the main
technologies that plays an impactful role in the increase in seed production has been
agricultural chemicals; therefore, agricultural chemicals have become an industry of their own.
Introduction
Data Source: Neville, 2013
Year Revenue $ Million Growth %
2014 13,136.4 4.5
2015 13,451.5 2.4
2016 13,896.6 3.3
2017 14,118.6 1.6
2018 14,443.3 2.3
2019 14,582.9 1.0
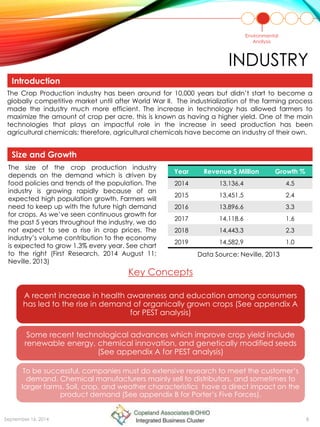
The size of the crop production industry
depends on the demand which is driven by
food policies and trends of the population. The
industry is growing rapidly because of an
expected high population growth. Farmers will
need to keep up with the future high demand
for crops. As we’ve seen continuous growth for
the past 5 years throughout the industry, we do
not expect to see a rise in crop prices. The
industry’s volume contribution to the economy
is expected to grow 1.3% every year. See chart
to the right (First Research, 2014 August 11;
Neville, 2013)
September 16, 2014 8
Key Concepts
Size and Growth
A recent increase in health awareness and education among consumers
has led to the rise in demand of organically grown crops (See appendix A
for PEST analysis)
Some recent technological advances which improve crop yield include
renewable energy, chemical innovation, and genetically modified seeds
(See appendix A for PEST analysis)
To be successful, companies must do extensive research to meet the customer’s
demand. Chemical manufacturers mainly sell to distributors, and sometimes to
larger farms. Soil, crop, and weather characteristics have a direct impact on the
product demand (See appendix B for Porter’s Five Forces).
MARKET
Size and Growth
According to Markets and Markets, the agricultural chemical industry has become a $203.6
million dollar market. The value and quantity of agrochemicals are growing, creating a pesticide
and fertilizer that is affordable and high quality (Markets and Markets, 2014; International Seed
Federation 2013).
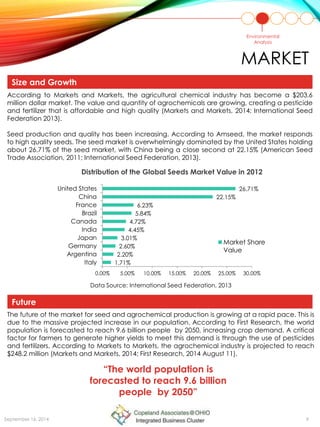
Seed production and quality has been increasing. According to Amseed, the market responds
to high quality seeds. The seed market is overwhelmingly dominated by the United States holding
about 26.71% of the seed market, with China being a close second at 22.15% (American Seed
Trade Association, 2011; International Seed Federation, 2013).
The future of the market for seed and agrochemical production is growing at a rapid pace. This is
due to the massive projected increase in our population. According to First Research, the world
population is forecasted to reach 9.6 billion people by 2050, increasing crop demand. A critical
factor for farmers to generate higher yields to meet this demand is through the use of pesticides
and fertilizers. According to Markets to Markets, the agrochemical industry is projected to reach
$248.2 million (Markets and Markets, 2014; First Research, 2014 August 11).
1.71%
2.20%
2.60%
3.01%
4.45%
4.72%
5.84%
6.23%
22.15%
26.71%
0.00% 5.00% 10.00% 15.00% 20.00% 25.00% 30.00%
Italy
Argentina
Germany
Japan
India
Canada
Brazil
France
China
United States
Distribution of the Global Seeds Market Value in 2012
Market Share
Value
Data Source: International Seed Federation, 2013
Environmental
Analysis
Size and Growth
Future
September 16, 2014 9
“The world population is
forecasted to reach 9.6 billion
people by 2050”
MARKET
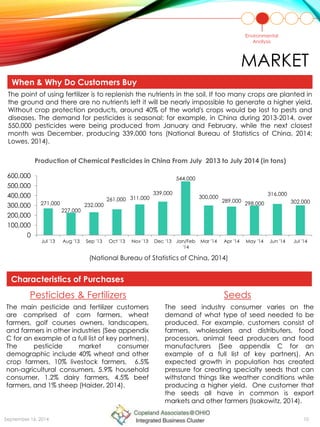
The point of using fertilizer is to replenish the nutrients in the soil. If too many crops are planted in
the ground and there are no nutrients left it will be nearly impossible to generate a higher yield.
Without crop protection products, around 40% of the world's crops would be lost to pests and
diseases. The demand for pesticides is seasonal; for example, in China during 2013-2014, over
550,000 pesticides were being produced from January and February, while the next closest
month was December, producing 339,000 tons (National Bureau of Statistics of China, 2014;
Lowes, 2014).
Characteristics of Purchases
Pesticides & Fertilizers Seeds
The main pesticide and fertilizer customers
are comprised of corn farmers, wheat
farmers, golf courses owners, landscapers,
and farmers in other industries (See appendix
C for an example of a full list of key partners).
The pesticide market consumer
demographic include 40% wheat and other
crop farmers, 10% livestock farmers, 6.5%
non-agricultural consumers, 5.9% household
consumer, 1.2% dairy farmers, 4.5% beef
farmers, and 1% sheep (Haider, 2014).
The seed industry consumer varies on the
demand of what type of seed needed to be
produced. For example, customers consist of
farmers, wholesalers and distributers, food
processors, animal feed producers and food
manufacturers (See appendix C for an
example of a full list of key partners). An
expected growth in population has created
pressure for creating specialty seeds that can
withstand things like weather conditions while
producing a higher yield. One customer that
the seeds all have in common is export
markets and other farmers (Isakowitz, 2014).
Environmental
Analysis
When & Why Do Customers Buy
Characteristics of Purchases
September 16, 2014 10
271,000
227,000
232,000
261,000 311,000
339,000
544,000
300,000
289,000 298,000
316,000
302,000
0
100,000
200,000
300,000
400,000
500,000
600,000
Jul '13 Aug '13 Sep '13 Oct '13 Nov '13 Dec '13 Jan/Feb
'14
Mar '14 Apr '14 May '14 Jun '14 Jul '14
Production of Chemical Pesticides in China From July 2013 to July 2014 (in tons)
(National Bureau of Statistics of China, 2014)
COMPETITION
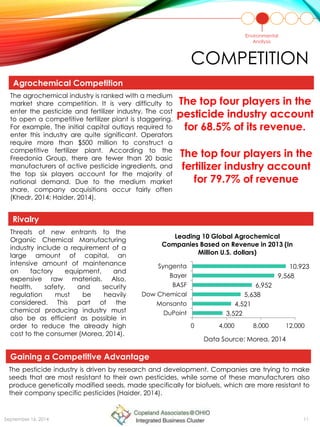
The agrochemical industry is ranked with a medium
market share competition. It is very difficulty to
enter the pesticide and fertilizer industry. The cost
to open a competitive fertilizer plant is staggering.
For example, The initial capital outlays required to
enter this industry are quite significant. Operators
require more than $500 million to construct a
competitive fertilizer plant. According to the
Freedonia Group, there are fewer than 20 basic
manufacturers of active pesticide ingredients, and
the top six players account for the majority of
national demand. Due to the medium market
share, company acquisitions occur fairly often
(Khedr, 2014; Haider, 2014).
The pesticide industry is driven by research and development. Companies are trying to make
seeds that are most resistant to their own pesticides, while some of these manufacturers also
produce genetically modified seeds, made specifically for biofuels, which are more resistant to
their company specific pesticides (Haider, 2014).
Environmental
Analysis
Agrochemical Competition
Gaining a Competitive Advantage
Rivalry
3,522
4,521
5,638
6,952
9,568
10,923
0 4,000 8,000 12,000
DuPoint
Monsanto
Dow Chemical
BASF
Bayer
Syngenta
Leading 10 Global Agrochemical
Companies Based on Revenue in 2013 (In
Million U.S. dollars)
September 16, 2014 11
The top four players in the
pesticide industry account
for 68.5% of its revenue.
The top four players in the
fertilizer industry account
for 79.7% of revenue
Threats of new entrants to the
Organic Chemical Manufacturing
industry include a requirement of a
large amount of capital, an
intensive amount of maintenance
on factory equipment, and
expensive raw materials. Also,
health, safety, and security
regulation must be heavily
considered. This part of the
chemical producing industry must
also be as efficient as possible in
order to reduce the already high
cost to the consumer (Morea, 2014).
Data Source: Morea, 2014
KEY SUCCESS FACTORS
Yield Potential
Consumer Safety
Intellectual Property Rights and
Protection
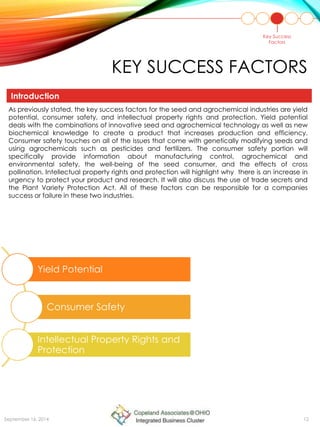
As previously stated, the key success factors for the seed and agrochemical industries are yield
potential, consumer safety, and intellectual property rights and protection. Yield potential
deals with the combinations of innovative seed and agrochemical technology as well as new
biochemical knowledge to create a product that increases production and efficiency.
Consumer safety touches on all of the issues that come with genetically modifying seeds and
using agrochemicals such as pesticides and fertilizers. The consumer safety portion will
specifically provide information about manufacturing control, agrochemical and
environmental safety, the well-being of the seed consumer, and the effects of cross
pollination. Intellectual property rights and protection will highlight why there is an increase in
urgency to protect your product and research. It will also discuss the use of trade secrets and
the Plant Variety Protection Act. All of these factors can be responsible for a companies
success or failure in these two industries.
Key Success
Factors
Introduction
September 16, 2014 12
YIELD POTENTIAL
Biotechnology is the alteration a cells DNA, “that overcome natural physiological reproductive
or recombination barriers”(WHO, 2005). Some forms of biotechnology in the industry include
cloning and tissue culture. Gene technology allows plant modification well beyond the plants
natural capabilities (WHO, 2005). Genetically modifying seeds leads to herbicide and insect
resistance, as well as an improved plant and root structure. “It has been estimated that 80% of
all plant problems start with soil and root problems” (Syngenta, 2011 – Root Health).
The farmers that were able to adapt to drought resistant seeds during the drought period that
took place in 2012 were the ones that excelled during that time. Now about 85% of corn seeds,
91%, of soybean seeds, and 80% of cotton seeds are all drought resistant (Plunkett, Steinberg,
Faulk & Snider, 2014).
Many companies have realized the opportunity of combining innovative seed and
agrochemical technology to produce higher yield. For example, Syngenta merged the two
divisions into one in 2011. Monsanto, has used product collaboration in order to increase their
product sales and have their own brand of seeds that are genetically modified to withstand
herbicides. When purchasing the genetically modified seeds from Monsanto, the farmer must
also purchase the Roundup to apply to the plants, forcing the farmer to purchase both products
from Monsanto. Roundup ready seeds are only resistant to the herbicide Roundup (Syngenta,
2014; Monsanto, 2014).
Key Success
Factors
Innovative Seed and Chemical Technology
Seed and Agrochemical Production Collaboration
September 16, 2014 13
1960 1970 1980 1990 2000 2010
Yield and Acreage Trend
Yield Area
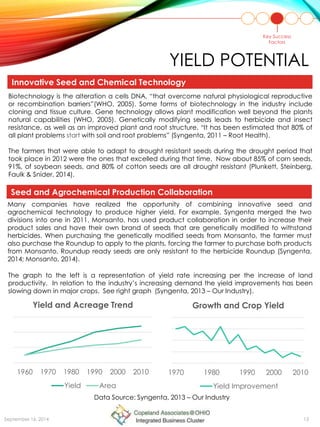
The graph to the left is a representation of yield rate increasing per the increase of land
productivity. In relation to the industry’s increasing demand the yield improvements has been
slowing down in major crops. See right graph (Syngenta, 2013 – Our Industry).
1970 1980 1990 2000 2010
Growth and Crop Yield
Yield Improvement
Data Source: Syngenta, 2013 – Our Industry
PRODUCTION, CONSUMER,
AND ENVIRONMENTAL SAFETY
Manufacturing safety is presented more in agrochemical production than in seed production.
Some chemicals may be solids, liquids, gases, flammable, explosive and/or toxic. Manufacturing
processes frequently involve high temperatures, high pressures and reactions which can be
dangerous. Hazards can be substantial, but are avoided by following the strict safety
procedures. Workers have to be trained in handling hazardous chemicals as well as the
chemical company safety measures. Workers are required to wear protective gear and have
that extensive knowledge from their training (College Grad, 2014; The Essential Chemical
Industry, 2013).
The federal government has regulated agrochemicals since the early 1900s. With human and
environmental health concerns rising over decades, several government bodies, including
Environmental Protection Agency (EPA) and World Health Organization (WHO), have established
guidelines needed to follow in order to produce agrochemicals. Before any crop product can
be approved for use, it has to go through a series of tests to ensure that there is no harm to
human or environmental health. There are also limits on how a product may be used, how often
it may be used and what protective clothing or equipment that must be used.
In recent years, there has been increasing pressure against the use of agrochemicals because of
their effect on air, land and consumer safety. Public concern can lead to increased regulation or
legislation, which could prevent companies from gaining governmental approval. Scientists have
also learned that some agrochemicals can leach through the soil, affecting the groundwater in
which we drink (EPA, 2014; WHO, 2005).
Key Success
Factors
Manufacturing Control
Agrochemical Consumer/Environmental Safety
September 16, 2014 14
In 1990, guidelines for use and release of GMO’s were created for human health and
environmental safety. Since then, many countries have established specific pre market
assessments of GMO’s and GM foods before they are released. Globally, countries are bound
to reach different decisions on assessing the products. Due to that concern, the international
regulatory systems covering GM food safety and environmental safety was established in 2003.
For seeds, the potential direct health effects are comparable to the known risks associated
with foods like allergies and toxicity of present components, the nutritional quality and
microbiological safety. The potential risk for environment include unintended effects on non-
target organisms, ecosystems and biodiversity; cross pollination (EPA, 2014).
Cross pollination of GM plants with other conventional or wild crops has a direct and indirect
effect on food safety. Pollen drift and insect pollination directly affect the seeds of a plant.
Unfortunately, identifying cross pollination is only possible in a laboratory. Some conclusions of
how to prevent cross pollination include isolation distances, buffer zones, pollen barriers, crop
rotation and monitoring crops during cultivation, harvest, storage, transport and processing.
Buffer zone is very popular on farms because it isolates GM products from non GM products.
Currently, there is no need to label products that are contaminated with 0.9% of the total
marketed product with genetically modified organisms. The main sources of that type of
contamination could be seed impurity, cross fertilization and mixing during transport, storage
and processing (EPA, 2014; WHO, 2005).
Key Success
Factors
92%
92%
0% 20% 40% 60% 80% 100%
It Should be labeled
accordingly
It Should Meet Mandatory
Government Standards for
Long Term Safety
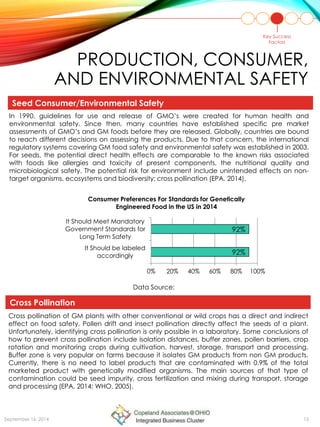
Consumer Preferences For Standards for Genetically
Engineered Food in the US in 2014
Data Source: Statista 2014
Seed Consumer/Environmental Safety
Cross Pollination
September 16, 2014 15
PRODUCTION, CONSUMER,
AND ENVIRONMENTAL SAFETY
Data Source:
INTELLECTUAL PROPERTY
RIGHTS AND PROTECTION
Key Success
Factors
In the United States there are multiple ways to protect property. The first way is called Trade
Secrets this is the most basic of Intellectual property. It is when the inventor doesn’t disclose
information about the invention but can be discovered and copied. Trade Secrets can be
enhanced by basically adding a licensing agreement but it will still only be limited protection.
They can also gain rights through the Plant Variety Protection Act which allows for breeders to
have commercial rights to a new product for over 20 years. Then there is utility patents which
allows the inventor to maintain and control the research and commercial uses of their product.
They can then specialize their patents by adding, a plant patent which controls the
reproduction of the plant. SOURCE
Intellectual property rights are vital to a seed and agrochemical companies success. Investing in
intellectual property rights promotes a companies “research and development, which untimely
enhances crop production and conversation of genetic resources” (Intellectual Property Rights
FAQ, 2013). For example, Monsanto, one of the largest seed companies, writes in their 10-K that
they “endeavor” gaining intellectual property rights in places where their products are
produced, used, and imported. Which is a common strategy among many successful seed and
agrochemical companies including Bayer and Dupont (Monsanto 10-K).
Intellectual property protection allows developers to be rewarded for their efforts, which, in turn,
puts extra emphasis on research and development. Intellectual property protection prevents
other companies from duplicating products and research efforts.
Intellectual Property Rights
Trade Secrets and Plant Variety Protection Act
Add something
September 16, 2014 16
Environmental
Analysis Industry
Increase of demand caused by health
awareness and education
Innovative technology increases crop yield
Market Large population increase leads to increase in
demand, despite supply shortage
Companies must comply with strict government
regulations
Competition Major players control majority of revenue
Competitive advantage is key to success
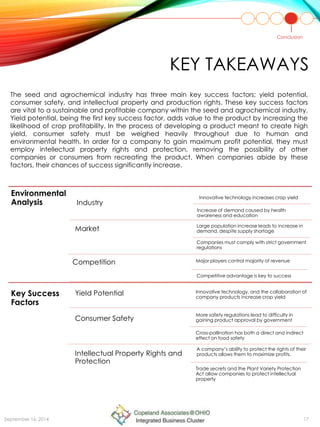
Key Success
Factors
Yield Potential Innovative technology, and the collaboration of
company products increase crop yield
Consumer Safety
More safety regulations lead to difficulty in
gaining product approval by government
Cross-pollination has both a direct and indirect
effect on food safety
Intellectual Property Rights and
Protection
A company’s ability to protect the rights of their
products allows them to maximize profits.
Trade secrets and the Plant Variety Protection
Act allow companies to protect intellectual
property
KEY TAKEAWAYS
The seed and agrochemical industry has three main key success factors; yield potential,
consumer safety, and intellectual property and production rights. These key success factors
are vital to a sustainable and profitable company within the seed and agrochemical industry.
Yield potential, being the first key success factor, adds value to the product by increasing the
likelihood of crop profitability. In the process of developing a product meant to create high
yield, consumer safety must be weighed heavily throughout due to human and
environmental health. In order for a company to gain maximum profit potential, they must
employ intellectual property rights and protection, removing the possibility of other
companies or consumers from recreating the product. When companies abide by these
factors, their chances of success significantly increase.
Conclusion
September 16, 2014 17
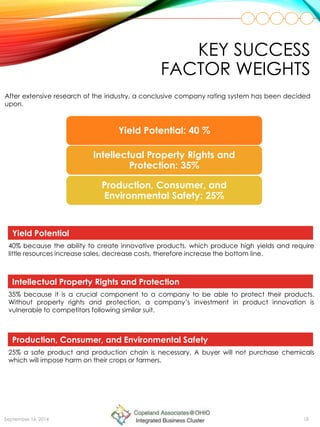
KEY SUCCESS
FACTOR WEIGHTS
September 16, 2014 18
Yield Potential
40% because the ability to create innovative products, which produce high yields and require
little resources increase sales, decrease costs, therefore increase the bottom line.
After extensive research of the industry, a conclusive company rating system has been decided
upon.
Yield Potential: 40 %
Intellectual Property Rights and
Protection: 35%
Production, Consumer, and
Environmental Safety: 25%
Intellectual Property Rights and Protection
35% because it is a crucial component to a company to be able to protect their products.
Without property rights and protection, a company’s investment in product innovation is
vulnerable to competitors following similar suit.
Production, Consumer, and Environmental Safety
25% a safe product and production chain is necessary. A buyer will not purchase chemicals
which will impose harm on their crops or farmers.
Monsanto is one of the world’s top providers of agricultural products. They offer several products
from seeds, herbicides, biotechnology, among others that are aimed to help farmers increase
crop productivity, efficiency, and provide better and safer products for consumers. Monsanto’s
genetically altered seeds are able to tolerate Roundup, which is it’s flagship product and also the
world’s top herbicide. Among these seeds, the company also provides Asgrow, DEKALB,
Deltapine, and Seminis seeds. Recently, Monsanto has strayed away from being a company
focused on agrochemicals to one focused on seeds and biotech (Mergent, 2014; Hoovers, 2014).
MONSANTO ANALYSIS
Strategy
September 16, 2014 19
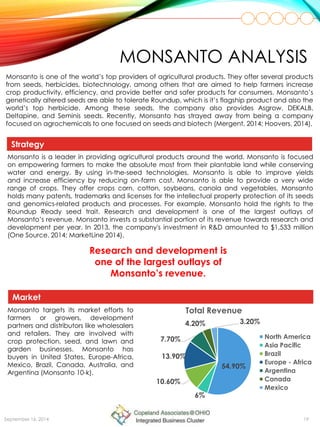
54.90%
6%
10.60%
13.90%
7.70%
4.20% 3.20%
Total Revenue
North America
Asia Pacific
Brazil
Europe - Africa
Argentina
Canada
Mexico
Monsanto is a leader in providing agricultural products around the world. Monsanto is focused
on empowering farmers to make the absolute most from their plantable land while conserving
water and energy. By using in-the-seed technologies, Monsanto is able to improve yields
and increase efficiency by reducing on-farm cost. Monsanto is able to provide a very wide
range of crops. They offer crops corn, cotton, soybeans, canola and vegetables. Monsanto
holds many patents, trademarks and licenses for the intellectual property protection of its seeds
and genomics-related products and processes. For example, Monsanto hold the rights to the
Roundup Ready seed trait. Research and development is one of the largest outlays of
Monsanto’s revenue. Monsanto invests a substantial portion of its revenue towards research and
development per year. In 2013, the company's investment in R&D amounted to $1,533 million
(One Source. 2014; MarketLine 2014).
Monsanto targets its market efforts to
farmers or growers, development
partners and distributors like wholesalers
and retailers. They are involved with
crop protection, seed, and lawn and
garden businesses. Monsanto has
buyers in United States, Europe-Africa,
Mexico, Brazil, Canada, Australia, and
Argentina (Monsanto 10-k).
Market
Research and development is
one of the largest outlays of
Monsanto’s revenue.
MONSANTO ANALYSIS
Future Prospects
September 16, 2014 20
Strengths Weakness Opportunities Threats
•Leading market
position
•Strong focus on
research and
development
•Diversified operation
•Legal Proceedings •Growing demand for
food products with
reduced saturated
fat and trans-fat
•Strategic
agreements and
acquisitions
•Growing population,
especially in Asia
•Infringement of
intellectual property
rights GMO’s
regulations
•Seasonal nature of
sales of the seeds and
genomics segment
•Risks associated with
conducting business
outside the US
Financial Situation
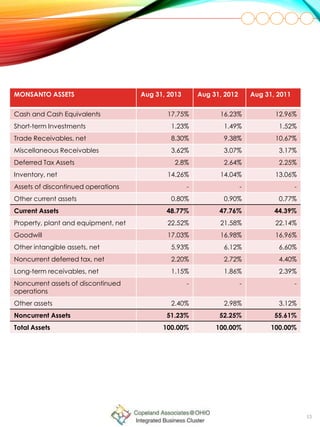
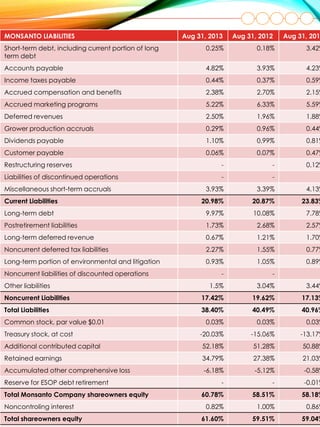
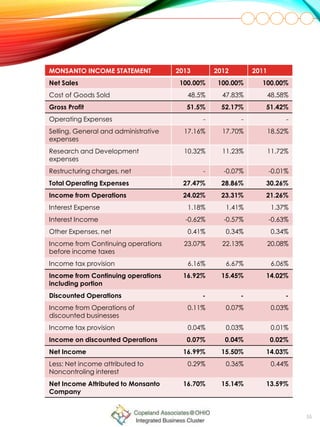
(See Appendix blah blah for detailed information)
Monsanto’s made a commitment in 2008 to sustainable agriculture by producing more,
conserving more and improving lives everywhere by 2030. They want to be able to meet the
needs of a growing population by doubling yields in core crops. They will reach their goal through
advanced plant breeding, biotechnology and improved farm management practices.
Monsanto also commits to using one-third fewer resources such as land, water, and energy while
holding the goal of doubling crop yields. They are working with their partners to develop better
conservation system and are improving on-farm practices. Monsanto set a goal to help farmers
improve their quality of life to result in helping people prosper through healthier diets, educational
opportunities and improving local economies (Monsanto, 2014).
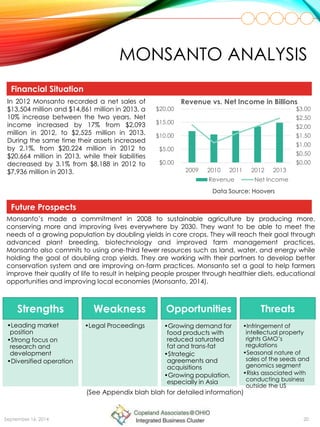
In 2012 Monsanto recorded a net sales of
$13,504 million and $14,861 million in 2013, a
10% increase between the two years. Net
income increased by 17% from $2,093
million in 2012, to $2,525 million in 2013.
During the same time their assets increased
by 2.1%, from $20,224 million in 2012 to
$20,664 million in 2013, while their liabilities
decreased by 3.1% from $8,188 in 2012 to
$7,936 million in 2013.
$0.00
$0.50
$1.00
$1.50
$2.00
$2.50
$3.00
$0.00
$5.00
$10.00
$15.00
$20.00
2009 2010 2011 2012 2013
Revenue vs. Net Income in Billions
Revenue Net Income
Data Source: Hoovers
SYNGENTA ANALYSIS
Strategy
Syngenta is an agricultural business operating in the crop protection and seeds industry. The
company is involved in a range of products designed to improve crop yields and food quality.
The crop protection chemicals include controlling weeds, insects and diseases in crops. Most
products work in the professional products sector like public health and turf. The seed side has
three sectors: seeds for field crops, vegetable and flower seeds, and pot and bedding plants.
(One Source, 2014).
Syngenta regards itself to address the increasing complexity of the challenges farmers face.
Syngenta’s main strategy is to integrate, innovate and outperform in the agriculture industry. So
in 2011, Syngenta merged its two major divisions, Crop Protection and Seeds, into one single
division. Under this strategy, Syngenta innovates by expanding crop based product pipeline and
local market strategies. They outperform by aiming to create value for their shareholders first by
creating value for their customers. Syngenta has broad patent and trademark portfolios. They
protect its investments in research and development as well as manufacturing and marketing.
The level and type of protection depends on the country according to local laws and
international agreements (Duncan, 2014; Syngenta, 2014 February 13; Syngenta, 2014).
September 16, 2014 21
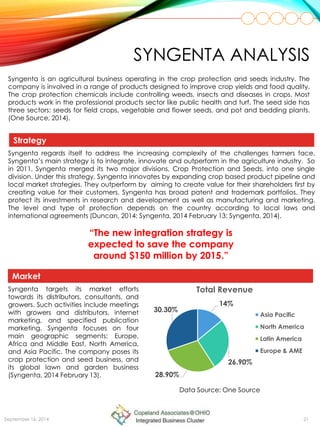
Market
Syngenta targets its market efforts
towards its distributors, consultants, and
growers. Such activities include meetings
with growers and distributors, internet
marketing, and specified publication
marketing. Syngenta focuses on four
main geographic segments: Europe,
Africa and Middle East, North America,
and Asia Pacific. The company poses its
crop protection and seed business, and
its global lawn and garden business
(Syngenta, 2014 February 13).
“The new integration strategy is
expected to save the company
around $150 million by 2015.”
14%
26.90%
28.90%
30.30%
Total Revenue
Asia Pacific
North America
Latin America
Europe & AME
Data Source: One Source
SYNGENTA ANALYSIS
September 16, 2014 22
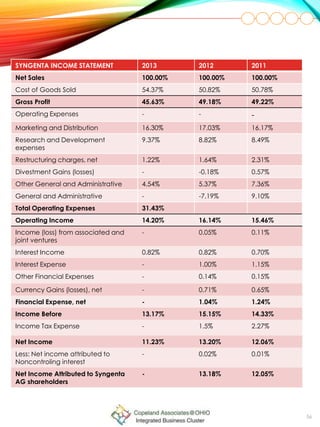
Financial Situation
Syngenta expects that increased emphasis will be placed on developing products that provide
benefits to food and feed processors, fuel production, retail trade and consumers. Syngenta has
a growth plan that includes six commitments for change. By 2020 they commit to make crops
more efficient by increasing the average productivity by 20% without using more land, water, or
inputs. They plan to rescue more farmland by improving the fertility. They will help biodiversity
flourish by enhancing it on 5 million hectares of land. Syngenta will help people stay safe by
training farm workers on labor safety, especially in developing countries. They will also look after
every worker by ensuring fair labor conditions across the entire network. Lastly, they want to
empower smallholders by enabling them to increase productivity by 50% (Syngenta, 2014
February 13; Syngenta, 2014).
Future Prospects
Strengths Weakness Opportunities Threats
•Comprehensive
portfolio of
agricultural and non-
agricultural products
•Global footprint
driving growth
•Reliance on single
supplier for certain
important products
•Acquisitions likely to
further strengthen
Syngenta’s seeds
business
•New crop protection
products may drive
the company’s top-
line growth
•Consumer and
government
resistance to GMO’s
•Intense competition
likely to put position
under Stringent laws,
regulations and
standards
(See Appendix blah blah for detailed information)
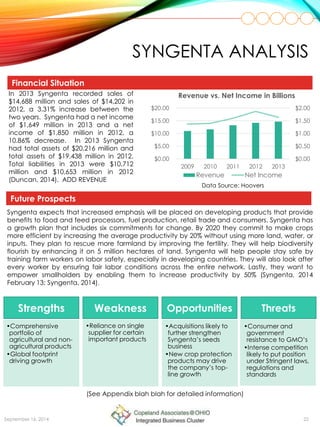
In 2013 Syngenta recorded sales of
$14,688 million and sales of $14,202 in
2012, a 3.31% increase between the
two years. Syngenta had a net income
of $1,649 million in 2013 and a net
income of $1,850 million in 2012, a
10.86% decrease. In 2013 Syngenta
had total assets of $20,216 million and
total assets of $19,438 million in 2012.
Total liabilities in 2013 were $10,712
million and $10,653 million in 2012
(Duncan, 2014). ADD REVENUE
$0.00
$0.50
$1.00
$1.50
$2.00
$0.00
$5.00
$10.00
$15.00
$20.00
2009 2010 2011 2012 2013
Revenue vs. Net Income in Billions
Revenue Net Income
Data Source: Hoovers
COMPANY COMPARISON:
YIELD POTENTIAL
September 16, 2014 23
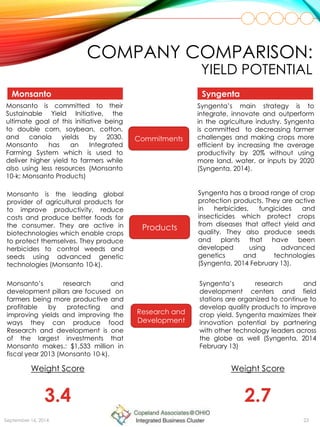
Monsanto Syngenta
Products
Commitments
Syngenta’s main strategy is to
integrate, innovate and outperform
in the agriculture industry. Syngenta
is committed to decreasing farmer
challenges and making crops more
efficient by increasing the average
productivity by 20% without using
more land, water, or inputs by 2020
(Syngenta, 2014).
Research and
Development
Syngenta has a broad range of crop
protection products. They are active
in herbicides, fungicides and
insecticides which protect crops
from diseases that affect yield and
quality. They also produce seeds
and plants that have been
developed using advanced
genetics and technologies
(Syngenta, 2014 February 13).
Monsanto is committed to their
Sustainable Yield Initiative, the
ultimate goal of this initiative being
to double corn, soybean, cotton,
and canola yields by 2030.
Monsanto has an Integrated
Farming System which is used to
deliver higher yield to farmers while
also using less resources (Monsanto
10-k; Monsanto Products)
Monsanto is the leading global
provider of agricultural products for
to improve productivity, reduce
costs and produce better foods for
the consumer. They are active in
biotechnologies which enable crops
to protect themselves. They produce
herbicides to control weeds and
seeds using advanced genetic
technologies (Monsanto 10-k).
Monsanto’s research and
development pillars are focused on
farmers being more productive and
profitable by protecting and
improving yields and improving the
ways they can produce food
Research and development is one
of the largest investments that
Monsanto makes.: $1,533 million in
fiscal year 2013 (Monsanto 10-k).
Syngenta’s research and
development centers and field
stations are organized to continue to
develop quality products to improve
crop yield. Syngenta maximizes their
innovation potential by partnering
with other technology leaders across
the globe as well (Syngenta, 2014
February 13)
Weight Score
3.4
Weight Score
2.7
September 16, 2014 24
COMPANY COMPARISON:
INTELLECTUAL PROPERTY RIGHTS AND
PROTECTION
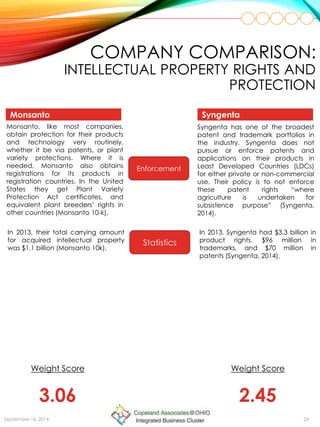
Monsanto Syngenta
Statistics
Enforcement
Weight Score
3.06
Weight Score
2.45
Monsanto, like most companies,
obtain protection for their products
and technology very routinely,
whether it be via patents, or plant
variety protections. Where it is
needed, Monsanto also obtains
registrations for its products in
registration countries. In the United
States they get Plant Variety
Protection Act certificates, and
equivalent plant breeders’ rights in
other countries (Monsanto 10-k).
In 2013, their total carrying amount
for acquired intellectual property
was $1.1 billion (Monsanto 10k).
Syngenta has one of the broadest
patent and trademark portfolios in
the industry. Syngenta does not
pursue or enforce patents and
applications on their products in
Least Developed Countries (LDCs)
for either private or non-commercial
use. Their policy is to not enforce
these patent rights “where
agriculture is undertaken for
subsistence purpose” (Syngenta,
2014).
In 2013, Syngenta had $3.3 billion in
product rights, $96 million in
trademarks, and $70 million in
patents (Syngenta, 2014).
September 16, 2014 25
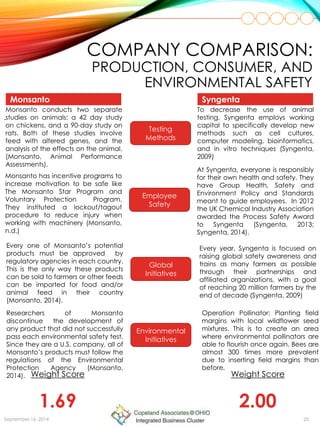
Monsanto
Employee
Safety
Testing
Methods
COMPANY COMPARISON:
PRODUCTION, CONSUMER, AND
ENVIRONMENTAL SAFETY
Global
Initiatives
Environmental
Initiatives
.
Syngenta
Weight Score
1.69
Weight Score
2.00
Monsanto conducts two separate
studies on animals: a 42 day study
on chickens, and a 90-day study on
rats. Both of these studies involve
feed with altered genes, and the
analysis of the effects on the animal.
(Monsanto, Animal Performance
Assessments).
Monsanto has incentive programs to
increase motivation to be safe like
The Monsanto Star Program and
Voluntary Protection Program.
They instituted a lockout/tagout
procedure to reduce injury when
working with machinery (Monsanto,
n.d.)
To decrease the use of animal
testing, Syngenta employs working
capital to specifically develop new
methods such as cell cultures,
computer modeling, bioinformatics,
and in vitro techniques (Syngenta,
2009)
Every year, Syngenta is focused on
raising global safety awareness and
trains as many farmers as possible
through their partnerships and
affiliated organizations, with a goal
of reaching 20 million farmers by the
end of decade (Syngenta, 2009)
Operation Pollinator: Planting field
margins with local wildflower seed
mixtures. This is to create an area
where environmental pollinators are
able to flourish once again. Bees are
almost 300 times more prevalent
due to inserting field margins than
before.
At Syngenta, everyone is responsibly
for their own health and safety. They
have Group Health, Safety and
Environment Policy and Standards
meant to guide employees. In 2012
the UK Chemical Industry Association
awarded the Process Safety Award
to Syngenta (Syngenta, 2013;
Syngenta, 2014).
Researchers of Monsanto
discontinue the development of
any product that did not successfully
pass each environmental safety test.
Since they are a U.S. company, all of
Monsanto’s products must follow the
regulations of the Environmental
Protection Agency (Monsanto,
2014).
Every one of Monsanto’s potential
products must be approved by
regulatory agencies in each country.
This is the only way these products
can be sold to farmers or other feeds
can be imported for food and/or
animal feed in their country
(Monsanto, 2014).
COMPANY
RECOMMENDATION
September 16, 2014 26
After extension research, the findings support Monsanto as being the most well positioned
company within the Seed and Agrochemical Production Industry. The conclusion is represented
by research within the areas of yield potential, intellectual property rights and protection,
production, Consumer, and environmental safety, as well as an in depth financial analysis of
both Syngenta and Monsanto, supporting the conclusion that Monsanto is leading the industry.
Yield Potential
Yield potential is the most important key success factor in the agrochemical and seed industry.
Monsanto generates multiple products with the goal of increasing the amount of yields for
farmers. Monsanto states that it’s goal is to double corn, soybean, cotton and canola yields by
2030. Although, Syngenta does want to increase their yield potential and productivity by 20%,
Monsanto has been outperforming them in the seed industry, as seen in recent financial
statements.
Monsanto actively pursues the protection of upholding Intellectual property ownership
throughout all markets involved in. This active pursuit decreases the chance of unauthorized use
of patented seeds and chemicals, while increasing revenues and the return on research and
development capital investments. Syngenta, on the other hand, does not pursue protecting
property rights in lesser developed nations because they do not want to further hinder
subsistence farming. Although this tactic is ethically applauded, it does not generate the
amount of revenue which Monsanto acquires each year. Although Monsanto’s R&D expense to
sales ratio has decreased from 11.72% in 2011 to 10.32% in 2013, Monsanto has increased its R&D
yearly investment by $16 million from 2012 to 2013.
Intellectual Property Rights and Protection
Production, consumer, and environmental safety is extremely valuable and essential to any
agrochemical and seed company. This is because they are constantly dealing with potentially
dangerous materials that could harm the employees, the consumer, and the environment.
Monsanto and Syngenta both completely excelled in consumer safety. When comparing
Monsanto and Syngenta in their safety practices it was apparent Syngenta excelled more than
Monsanto. Despite Monsanto's excellent star program which was considered a Voluntary
Protection Program Syngenta has multiple practices that have a much more positive impact. For
example Operation Pollinator which has already made bees 300 times more prevalent. They also
are much better at educating farmers about global safety. Monsanto is much better at
employee safety but between the consumer and environment Syngenta proves to be dominant
giving them the competitive edge.
Production, Consumer and Environmental Safety
27
COMPANY
RECOMMENDATION
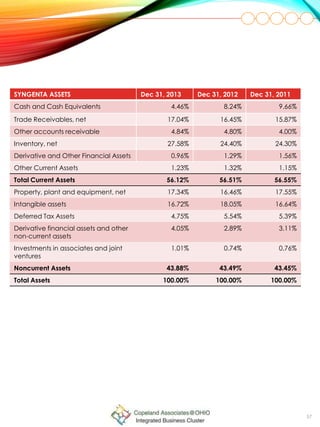
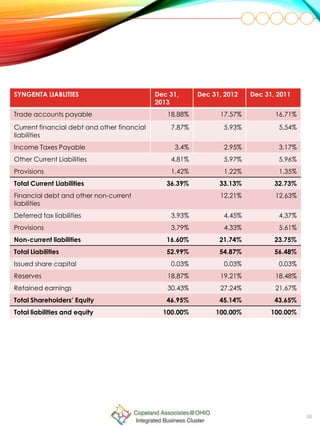
Financial Analysis
Financially, Monsanto has proven to outperform Syngenta in most aspects. Firstly, through the
findings of financial ratios, Monsanto has proven to be more liquid, more profitable, and more
efficient.
During 2011 and 2012, Monsanto’s Net Income
was nearly the same as that of Syngenta;
however, in 2013 Monsanto earned a Net
Income of 153% of Syngenta’s Net Income,
compared to earning 113% in 2012, and 110%
in 2011. With a continued increase in Net
Income, Monsanto has doubled Return on
Assets to 12.1% within three years. In 2013,
Syngenta was obtaining an ROA of 10.2%.
Recently, a merger proposition between
Monsanto and Syngenta dissolved due to
Monsanto’s decision to repurchase $10 billion in
stock. This large increase in treasury stock,
funded by a $4.5 billion bond, sends a strong
message to investors that corporate is confident
in the financial stability and future growth of the
company. Clearly investors support this claim
with a current 22.65 price to earnings ratio,
compared to a ratio of 17.98 price to earnings
for Syngenta.
Gaining a Better
Financial Position:
Separation From the
Competition:
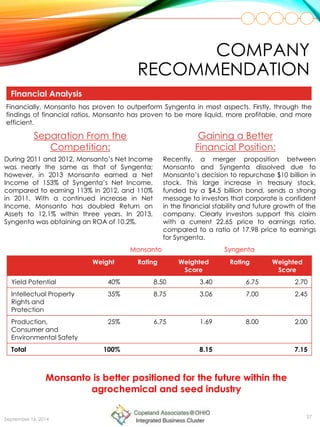
Weight Rating Weighted
Score
Rating Weighted
Score
Yield Potential 40% 8.50 3.40 6.75 2.70
Intellectual Property
Rights and
Protection
35% 8.75 3.06 7.00 2.45
Production,
Consumer and
Environmental Safety
25% 6.75 1.69 8.00 2.00
Total 100% 8.15 7.15
Monsanto Syngenta
Monsanto is better positioned for the future within the
agrochemical and seed industry
September 16, 2014
REFERENCES
• Agricultural Chemical Manufacturing. (2014, July 21). Retrieved from First
Research: http://mergent.firstresearch-
learn.com.proxy.library.ohiou.edu/industry_detail.aspx?pid=161&chapter=1
• American Seed Trade Association. (2011 June). Existing U.S. Seed Industry
Production Practices That Address Coexistence. Retrieved by American
Seed Trade Association http://www.amseed.org/pdfs/issues/biotech/asta-
coexistence-production-practices.pdf
• College Grad. (2014). Chemicals Manufacturing Industries, Except Pharmaceutical
and Medicine Manufacturing. Retrieved by:
http://www.collegegrad.com/industries/manuf03.shtml
• Charles, Dan. (2013 May). Fertilizer World. Retrieved by National Geographic
http://ngm.nationalgeographic.com/2013/05/fertilized-world/charles-text
• Environmental Protection Agency (EPA). (2014 April 4). Overview of Risk Assessment
in the Pesticide Industry. Retrieved by Environmental Protection Agency:
http://www.epa.gov/pesticides/about/overview_risk_assess.htm
• First Research. (2014 July 28). Crop Production. Retrieved by First Research
http://mergent.firstresearch-
learn.com.proxy.library.ohiou.edu/industry.aspx?chapter=12&pid=35
• First Research. (2014 August 11). Chemical Manufacturing. Retrieved by First
Research http://mergent.firstresearch-
learn.com.proxy.library.ohiou.edu/industry.aspx?chapter=0&pid=17
• GM Education. (n.d.). Contamination of Crops. Retrieved by GM Education:
http://www.gmeducation.org/environment/p149075-contamination-of-
crops.html
Conclusion
September 16, 2014 28
REFERENCES
• GPS. (2013 September 27). Agriculture. Retrieved by GPS
http://www.gps.gov/applications/agriculture/
• Grace Communications Foundation. (2014). Pesticides. Retrieved Communications
Foundation http://www.sustainabletable.org/263/pesticides
• Haider, Zeeshan. (2014 July). Pesticide Manufacturing. Retrieved by IBISworld
http://clients1.ibisworld.com.proxy.library.ohiou.edu/reports/us/industry/def
ault.aspx?indid=484
• Intellectual Property Rights FAQ. (2013). Retrieved September 14, 2014, from
American Seed Trade Association website:
http://www.amseed.org/issues/intellectual-property/ip-rights-faq/
• International Seed Federation. (2013, June). Distribution of the global seeds market
value in 2012, by country. Retrieved from International Seed Foundation:
http://www.statista.com.proxy.library.ohiou.edu/statistics/262285/global-
seeds-market-share/
• Isakowitz, Lucas. (2014 July). Vegetable Farming in the US. Retrieved from IBISWorld.
http://clients1.ibisworld.com.proxy.library.ohiou.edu/reports/us/industry/def
ault.aspx?entid=15]
• Khedr, O. (2014, May). Fertilizer Manufacturing in the US. Retrieved September 4,
2014, from IBISWorld website:
http://clients1.ibisworld.com.proxy.library.ohiou.edu/reports/us/industry/def
ault.aspx?entid=480
• Lowes. (2014). Fertilizer Buying Guide. Retrieved from Lowes website:
http://www.lowes.com/cd_Fertilizer+Buying+Guide_543192373_
• MarketsandMarkets. (2014, February). Worldwide agrochemical market revenue in
2013 and 2018 (in billion U.S. dollars). Retrieved from Statista website:
http://www.statista.com/statistics/311953/agrochemical-market-value-
worldwide-by-type/
• McKitterick, Will. (2014, April) Farm Supplies Wholesaling. Retrieved by IBISworld
http://clients1.ibisworld.com.proxy.library.ohiou.edu/reports/us/industry/def
ault.aspx?entid=994
Conclusion
September 16, 2014 29
REFERENCES
• Morea, Stephen. (July 2014). Organic Chemical Manufacturing in the US. Retrieved
by IBISworld
http://clients1.ibisworld.com.proxy.library.ohiou.edu/reports/us/industry/co
mpetitivelandscape.aspx?entid=467
• Monsanto Company (2013). Form 10-K 2013. Retrieved from SEC EDGAR:
http://www.sec.gov/edgar.shtml
• National Bureau of Statistics of China. (2014, August). Production of chemical
pesticides in China. Retrieved by the National Bureau of Statistics of China:
http://www.statista.com.proxy.library.ohiou.edu/statistics/226213/productio
n-of-chemical-pesticides-in-china-by-month/
• Neville, Antal. (2013, September). Crop Services in US. Retrieved by IBIS World:
http://clients1.ibisworld.com.proxy.library.ohiou.edu/reports/us/industry/def
ault.aspx?entid=89
• Plunkett, Jack W., Plunkett, M. B., Steinberg, J. S., Faulk, J., & Snider, I. J. (2014).
Introduction to the Food & Beverage Industry. Food, Beverage & Tobacco
Industry. Retrieved September 4, 2014, from
http://www.plunkettresearchonline.com
• Syngenta. (2013). Our Industry 2013. Retrieved from Syngenta:
http://europe.nxtbook.com/nxteu/Syngenta/ourindustry_2013/index.php#/
12
• Syngenta. (2011). Root Health- The Key to Improving Yield. Retrieved from Sygenta
website:http://www.syngenta.com/global/corporate/SiteCollectionDocum
ents/pdf/publications/products/Whitepaper_V9-screen.pdf
• The Essential Chemical Industry. (2013, July 21). The Chemical Industry. Retrieved
by: Promoting Science: The University of New York:
http://www.essentialchemicalindustry.org/the-chemical-industry/the-
chemical-industry.html
• U.S. Environmental Protection Agency. (2012 May 9). What is a Pesticide? Retrieved
from U.S Environmental Protection Agency
http://www.epa.gov/kidshometour/pest.htm
• U.S. Environmental Protection Agency. (2010 August). Source Water Protection
Practices Bulletin Retrieved from U.S Environmental Protection Agency
http://www.epa.gov/safewater/sourcewater/pubs/fs_swpp_fertilizer.pdf
• World Health Organization (WHO). (2005, June). Modern food biotechnology, 30September 16, 2014
Conclusion
APPENDICES
A
Political Economic
Social Technology
Conclusion
PEST
September 16, 2014 31
Political
The American Association of American Plant Food Control Officials
(AAPFCO):
The Association of American Plant Food Control Officials also known as AAPFCO is one of the
premier regulators of fertilizers. Their main purpose is to generate uniformity among all fertilizers
without damaging consumers needs, the environment, or competition in the industry. It is one of
the leading regulators in the United States (American Seed Trade Association, 2011).
The Association of Official Seed Certifying Agencies (AOSCA):
The Association of Official Seed Certifying Agencies, AOSCA, sets quality standards throughout
the industry of seed production. Acts taken to ensure seed quality throughout production
include steps within the planting, harvesting, cleaning, and storage processes. These such steps
may either be taking by seed companies or growers producing the seeds for such companies.
Examples of steps taken within these processes include having an in depth knowledge of
surrounding crops, employing crop rotation, and continuous growth inspection. Maintaining the
purity of the seeds is very important for acceptance in the market and commercial sales
(American Seed Trade Association, 2011).
Conclusion
APPENDICES
September 16, 2014 32
Organic Trends:
High media attention on nutrition during the past five years has encouraged awareness and
education among consumers. People have shifted from processed foods to choosing fresh
options or even organically grown foods. Organically grown plants are in high demand and have
been affecting competition in the industry. Farmers have increased their production of higher-
quality foods without the use chemicals or altered seeds, which is more expensive for the
customer. Consumer concern led to pesticide alternatives like the implementation of insects that
repel other harmful pests. The demand for organic chemicals produced has risen over the past
five years. Due to these trends, revenue for the organic chemical manufacturing is expected to
increase 2.9% in 2014 (First Research, 2014 July 28; Isakowitz, 2014; Morea, 2014).
Social
Some recent technological advances that help growers improve crop yield include GPS
guidance and renewable energy. GPS guidance allows farmers to work in conditions such as rain,
fog and darkness and is used for yield mapping, farm planning and soil sampling. Updated
management systems are also a result of the AOSCA standards. Solar power is the most popular
renewable energy source. However, chemical innovation and genetically modified seeds take
precedence over other advances (GPS, 2013; First Research, 2014 July 28; Steinberg, Faulk, and
Snider, 2014; American Seed Trade Association, 2011).
Current green trends have increased
farm’s production of renewable energy
to more than 140% since 2007, 80% of
those being small farms.
(Steinberg, Faulk, and Snider, 2014)
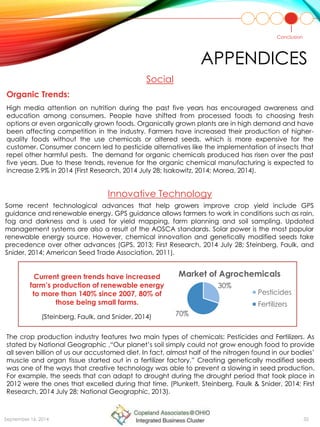
30%
70%
Market of Agrochemicals
Pesticides
Fertilizers
The crop production industry features two main types of chemicals: Pesticides and Fertilizers. As
stated by National Geographic ,“Our planet’s soil simply could not grow enough food to provide
all seven billion of us our accustomed diet. In fact, almost half of the nitrogen found in our bodies’
muscle and organ tissue started out in a fertilizer factory.” Creating genetically modified seeds
was one of the ways that creative technology was able to prevent a slowing in seed production.
For example, the seeds that can adapt to drought during the drought period that took place in
2012 were the ones that excelled during that time. (Plunkett, Steinberg, Faulk & Snider, 2014; First
Research, 2014 July 28; National Geographic, 2013).
Innovative Technology
Conclusion
APPENDICES
September 16, 2014 33
B
Porters
Competitive
Rivalry
Threat of
New
Entrants
Bargaining
Power of
Buyers
Threat of
Substitutes
Bargaining
Power of
Suppliers
Porter’s Five Forces
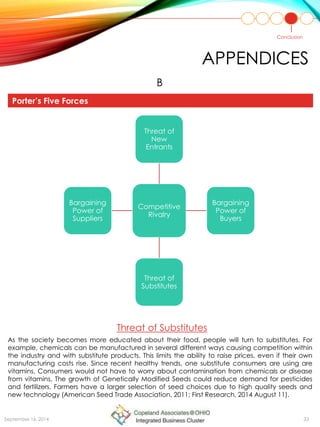
Threat of Substitutes
As the society becomes more educated about their food, people will turn to substitutes. For
example, chemicals can be manufactured in several different ways causing competition within
the industry and with substitute products. This limits the ability to raise prices, even if their own
manufacturing costs rise. Since recent healthy trends, one substitute consumers are using are
vitamins. Consumers would not have to worry about contamination from chemicals or disease
from vitamins. The growth of Genetically Modified Seeds could reduce demand for pesticides
and fertilizers. Farmers have a larger selection of seed choices due to high quality seeds and
new technology (American Seed Trade Association, 2011; First Research, 2014 August 11).
Conclusion
APPENDICES
Bargaining Power of Suppliers Bargaining Power of Buyers
Chemical manufacturers mainly sell to
distributors, while only a few go directly to
larger farms. They also sell large quantities to
fertilizer and pesticide mixers to create various
chemicals suitable for different soil, crop and
weather characteristics. External factors can
ultimately determine farmers demand for
supplies. Generally, farmers will purchase
supplies locally. The climate of a location also
determines what type of supplies farmers
need. Fertilizers are the top product sold
because farmers need the nutrients to grow
products. For the seed industry, the main
buyer is vegetable and fruit farmers (Isakowitz,
July 2014; McKitterick, 2014; Haider, 2014).
To be a successful supplier in this industry,
manufacturers need to have an
understanding of the consumer’s demand. For
example, market research sends information
to the seed industry about what should be
produced so that farmers can produce the
wants and needs of the consumer.
International trade in the chemical industry is
big because fertilizers need potash and
phosphorus rock which is only available in a
few countries. The US is a net exporter of
pesticides while fertilizers are imported. Thus
giving farmers the ability to inexpensively
outsource to international sellers causing
overall profit to rise (First Research, 2014
August 11; American Seed Trade Association,
2011).
September 16, 2014 34
C
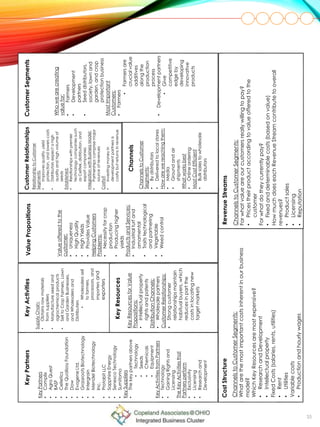
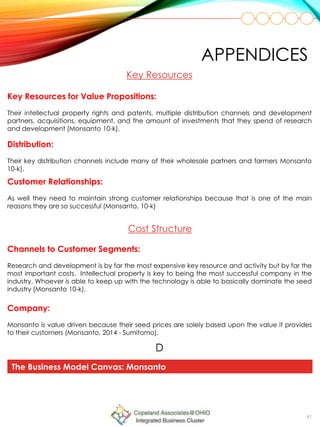
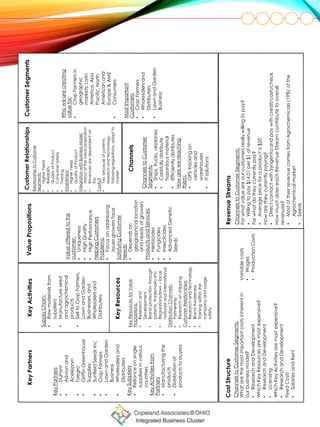
The Business Model Canvas: Monsanto
35
35
KeyPartnersKeyActivities
KeyResources
ValuePropositionsCustomerRelationships
Channels
CustomerSegments
CostStructureRevenueStreams
Whowearecreating
valuefor:
•Farmers
•Development
partners
•Seeddistributors,
society,lawnand
garden,andcrop
protectionbusiness
MostImportant
Customers:
•Farmers
•Farmersare
crucialvalue
additives
alongthe
production
process
•Developmentpartners
•Give
competitive
edgeby
developing
innovative
products
SupplyChain:
•Obtainsrawmaterials
fromsuppliers
•Manufactureseedand
agrochemicalproducts
•SelltoCropFarmers,Lawn
andGardenBusinesses,
andWholesalersand
Distributers
•Wholesalerssell
tofarmers,
processors,and
importersand
exporters
KeyPartners
•Complix
•AgraQuest
•BASF
•Celletics
•TheQualisoyFoundation
•Dow
•EvogeneLtd.
•GrassrootsBiotechnology
•Intergrain
•MendelBiotechnology
Inc.
•ProtabitLLC
•SapphireEnergy
•SenescoTechnology
•Sumitomo
KeySuppliers
•Thekeypartnersabove
•Technology
•Seeds
•Chemicals
•Equipment
KeyActivitiesfromPartners
•Technology
•GainingRightsand
Licensing
TheKeyActivitiesthat
Partnersperform
•Exclusivity
•Licensing
•Researchand
Development
KeyResourcesforValue
Propositions:
•Intellectualproperty
rightsandpatents
DistributionChannels:
•Wholesalepartners
CustomerRelationships:
•Strongcustomer
relationshipsmaintain
habitualbuyers,which
reducesinpartthe
costsinlocatingnew
targetmarkets
RelationshiptoCustomer
Segments:
•Improvesquality,yield
protection,andlowerscosts
•Distributorsexpectahigh
qualityandhighvolumeof
seeds
Established:
•Relationshipswithpremier
technologycompaniessuch
asCelltek,distribution,and
exportcompanies
IntegrationwithBusinessModel:
•Partnershipscomprisemajor
sourceofrevenues
Costly?
•Investingmoneyin
developmentpartnersis
costlybutreturnsinrevenue
ChannelstoCustomerSegments:
Whatarethemostimportantcostsinherentinourbusiness
model?
WhichKeyResourcesaremostexpensive?
•ResearchandDevelopment
•Intellectualproperty
FixedCosts(salaries,rents,utilities)
•Rent
•Utilities
Variablecosts
•Productionandhourlywages
ChannelstoCustomerSegments:
Forwhatvalueareourcustomersreallywillingtopay?
•Pricestheirproductaccordingtovalueofferedtothe
customer
Forwhatdotheycurrentlypay?
•Fixedanddeterminablecosts(basedonvalue)
HowmuchdoeseachRevenueStreamcontributetooverall
revenues?
•Productsales
•Licensing
•Reputation
Valueofferedtothe
customer:
•Uniqueness
•HighQuality
•HighYields
•ProvidesValue
HelpingCustomers
Problems:
•Necessityforcrop
production
•Producinghigher
yields
ProductsandServices:
•Industrialturfand
ornamental
•Traitstechnological
andpartnering
•Vegetable
•Weedcontrol
ChannelstoCustomer
Segments:
•Bydistributors
•Deliveredtolocalstores
Howarewereachingthem:
•Media
•Groundandair
shipments
Whatworksbest
•Onlineordering
MostCostEfficient
•Bulksalestowholesale
distributors
36
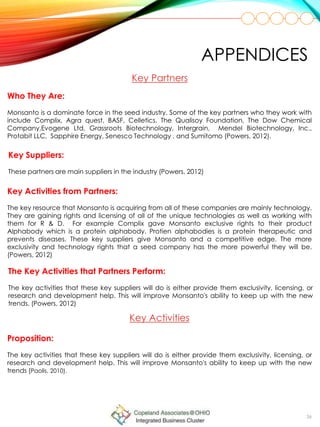
Who They Are:
Monsanto is a dominate force in the seed industry. Some of the key partners who they work with
include Complix, Agra quest, BASF, Celletics, The Qualisoy Foundation, The Dow Chemical
Company,Evogene Ltd, Grassroots Biotechnology, Intergrain, Mendel Biotechnology, Inc.,
Protabit LLC, Sapphire Energy, Senesco Technology , and Sumitomo (Powers, 2012).
Key Partners
Key Suppliers:
These partners are main suppliers in the industry (Powers, 2012)
Key Activities from Partners:
The key resource that Monsanto is acquiring from all of these companies are mainly technology.
They are gaining rights and licensing of all of the unique technologies as well as working with
them for R & D. For example Complix gave Monsanto exclusive rights to their product
Alphabody which is a protein alphabody. Protien alphabodies is a protein therapeutic and
prevents diseases. These key suppliers give Monsanto and a competitive edge. The more
exclusivity and technology rights that a seed company has the more powerful they will be.
(Powers, 2012)
The Key Activities that Partners Perform:
The key activities that these key suppliers will do is either provide them exclusivity, licensing, or
research and development help. This will improve Monsanto's ability to keep up with the new
trends. (Powers, 2012)
Key Activities
Proposition:
The key activities that these key suppliers will do is either provide them exclusivity, licensing, or
research and development help. This will improve Monsanto's ability to keep up with the new
trends (Paolis, 2010).
APPENDICES
37
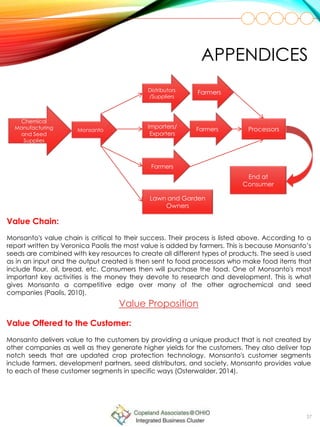
Chemical
Manufacturing
and Seed
Supplies
Monsanto
Distributors
/Suppliers
Importers/
Exporters
Farmers
Lawn and Garden
Owners
Farmers
Farmers
Processors
End at
Consumer
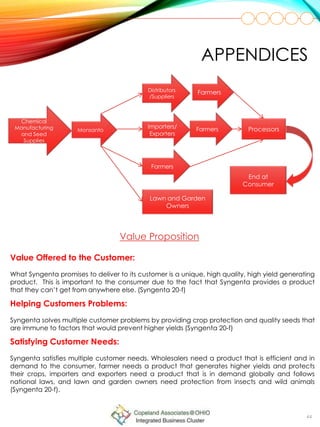
Value Chain:
Monsanto's value chain is critical to their success. Their process is listed above. According to a
report written by Veronica Paolis the most value is added by farmers. This is because Monsanto’s
seeds are combined with key resources to create all different types of products. The seed is used
as in an input and the output created is then sent to food processors who make food items that
include flour, oil, bread, etc. Consumers then will purchase the food. One of Monsanto's most
important key activities is the money they devote to research and development. This is what
gives Monsanto a competitive edge over many of the other agrochemical and seed
companies (Paolis, 2010).
APPENDICES
Value Offered to the Customer:
Monsanto delivers value to the customers by providing a unique product that is not created by
other companies as well as they generate higher yields for the customers. They also deliver top
notch seeds that are updated crop protection technology. Monsanto's customer segments
include farmers, development partners, seed distributors, and society. Monsanto provides value
to each of these customer segments in specific ways (Osterwalder, 2014).
Value Proposition
Helping Customers Problems:
The problem that they are helping consumers solve is that there are many environmental factors
that can impact the yield that can impact a seeds yield output. Some of the factors that impact
plant growth include temperature, moisture supply, radiant energy, etc. As well as insects and
animals who have an tendency to destroy plant growth and provide a strong amount of crop
production (Monsanto, 2014 - ).
Satisfying Customer Needs:
The needs that we are satisfying include the necessity for crop protection and the need to
generate higher yields to meet the growing demand because of the growing population
(Monsanto, 2014).
Products and Services:
The main bundles and products that they offer to each customer segment crop protection,
industrial turf and ornamental, traits technological and partnering, vegetable, and weed control
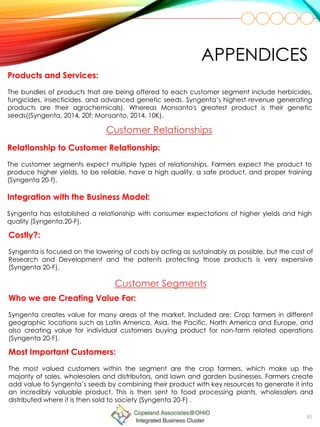
(Monsanto, 2014).
APPENDICES
Who we are Creating Value For:
Monsanto is creating value for farmers, development partners, seed distributors, society, lawn and
garden, and crop protection business (Paolis, 2010).
Customer Segments
Most Important Customers:
The most important customers include farmers and development partners. Farmers create add
value to Monsanto's seeds by combining their product with key resources to generate it into an
incredibly valuable product. The development partners are incredibly important because of
Monsanto’s funding into research and development. Without their development partners they
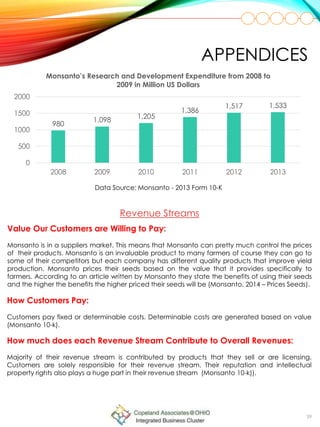
would not be able to develop the high quality products that they have. As shown in the graph by
Monsanto - 2013 Form 10-K, with information provided by Monsanto they spent a total of $1,533
million on research and development which is about $200 million than Syngenta. Indirectly they
affect all people who by processed food and crops. Directly they affect all of their main
customers (Monsanto - 2013 Form 10-K, Paolis, 2010).
39
980
1,098 1,205
1,386
1,517 1,533
0
500
1000
1500
2000
2008 2009 2010 2011 2012 2013
Monsanto’s Research and Development Expenditure from 2008 to
2009 in Million US Dollars
Data Source: Monsanto - 2013 Form 10-K
Value Our Customers are Willing to Pay:
Monsanto is in a suppliers market. This means that Monsanto can pretty much control the prices
of their products. Monsanto is an invaluable product to many farmers of course they can go to
some of their competitors but each company has different quality products that improve yield
production. Monsanto prices their seeds based on the value that it provides specifically to
farmers. According to an article written by Monsanto they state the benefits of using their seeds
and the higher the benefits the higher priced their seeds will be (Monsanto, 2014 – Prices Seeds).
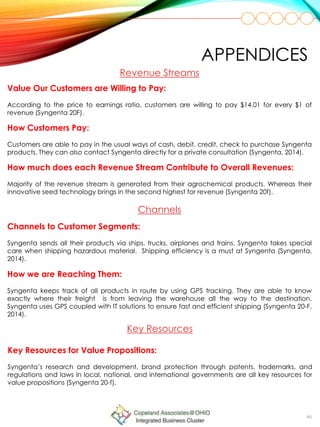
Revenue Streams
How Customers Pay:
Customers pay fixed or determinable costs. Determinable costs are generated based on value
(Monsanto 10-k).
How much does each Revenue Stream Contribute to Overall Revenues:
Majority of their revenue stream is contributed by products that they sell or are licensing.
Customers are solely responsible for their revenue stream. Their reputation and intellectual
property rights also plays a huge part in their revenue stream (Monsanto 10-k)).
APPENDICES
40
Channels to Customer Segments:
They want to be reached with distributors and the Monsanto company itself. They also want it
delivered or in stores near their locations because farmers are in rural areas and its hard to
necessarily find time to go to the stores to themselves (Paolis, 2010).
Channels
How we are Reaching Them:
Right now they are reaching them through media, delivery trucks, flight, and shipments.
Specifically when seeds are sent from Latin America Monsanto will fly the seeds to their
distribution centers all across the worlds (Paolis, 2010).
How Our Channels Integrated:
Their channels are integrated into their system by providing all farmers and distributors with easy
access to their seeds by not only selling it in one specific place (Paolis, 2010).
APPENDICES
Which Ones Work Best?:
The ones that work the best is being able to order on their website. This is because farmers do not
have to leave their crops to buy their agrochemicals and seeds which saves time. This is
incredibly important because when farmers waste time they lose money and potentially yield
(Paolis, 2010).
Which Ones are Most Cost-Efficient?:
The most cost efficient is bulk selling the products into their wholesale distributors because it will
be less of a delivery fee than shipping less product to one person’s house. It allows Monsanto to
move inventory way quicker (Paolis, 2010).
How we are Integrating Them with Customer Routines:
Monsanto is integrating their product with the customer routines by making them incredibly
accessible to farmers and distributors who are their main customer. They also are licensing their
technology and products which allows them to save costs because they don’t have to worry
about delivery costs. (Paolis, 2010).
41
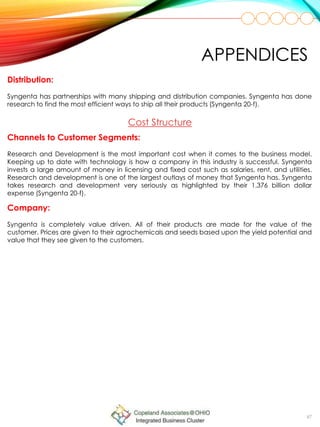
Distribution:
Their key distribution channels include many of their wholesale partners and farmers Monsanto
10-k).
Key Resources
Key Resources for Value Propositions:
Their intellectual property rights and patents, multiple distribution channels and development
partners, acquisitions, equipment, and the amount of investments that they spend of research
and development (Monsanto 10-k).
Customer Relationships:
As well they need to maintain strong customer relationships because that is one of the main
reasons they are so successful (Monsanto, 10-k)
APPENDICES
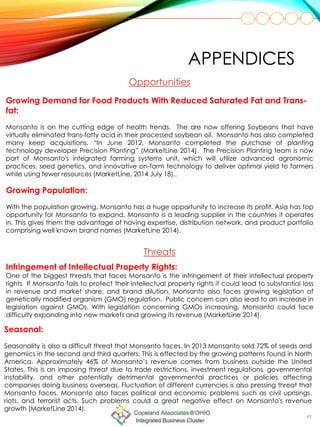
Cost Structure
Channels to Customer Segments:
Research and development is by far the most expensive key resource and activity but by far the
most important costs. Intellectual property is key to being the most successful company in the
industry. Whoever is able to keep up with the technology is able to basically dominate the seed
industry (Monsanto 10-k).
Company:
Monsanto is value driven because their seed prices are solely based upon the value it provides
to their customers (Monsanto, 2014 - Sumitomo).
D
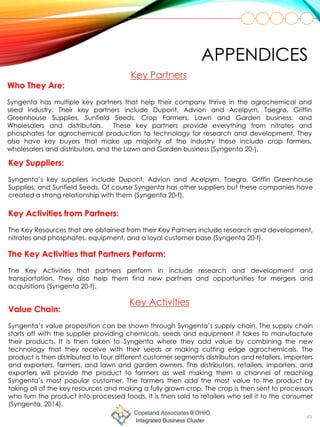
The Business Model Canvas: Monsanto
42
KeyPartnersKeyActivities
KeyResources
ValuePropositionsCustomerRelationships
Channels
CustomerSegments
Valueofferedtothe
customer:
•Uniqueness
•HighQuality
•HighPerformance
HelpingCustomers
Problems:
•Focusonaddressing
issuesgrowersface
SatisfyingCustomer
Needs:
•Dependson
geographicallocation
andneedsofgrowers
ProductsandServices:
•Herbicides
•Fungicides
•Insecticides
•AdvancedGenetic
Seeds
Whowearecreating
valuefor:
•CropFarmersin
geographic
markets:Latin
America,Asia
Pacific,North
Americanand
Europe&AME
•Consumers
MostImportant
Customers:
•CropFarmers
•Wholesalersand
Distributers
•LawnandGarden
Business
SupplyChain:
•Rawmaterialsfrom
suppliers
•Manufactureseed
andagrochemical
products
•SelltoCropFarmers,
LawnandGarden
Businesses,and
Wholesalersand
Distributers
KeyPartners
•DuPont
•Advionand
Acelepryn
•Taegro
•GriffinGreenhouse
Supplies
•SunfleldSeedsInc
•CropFarmers
•LawnandGarden
Business
•Wholesalersand
Distributers
KeySuppliers
•Relianceonsingle
suppliersinvarious
countries
KeyActivitiesfrom
Partners
•Manufacturingthe
products
•Distributionof
productstobuyers
KeyResourcesforValue
Propositions:
•Researchand
Development
•Brandprotectionthrough
patents,trademarksetc.
•Regulations/laws–local,
nationalandinternational
DistributionChannels:
•Partnership
•Researchonshipping
CustomerRelationships:
•ResearchandTechnology
•BrandAwareness
•Trainingwithinthe
companyandusage
safety
RelationshiptoCustomer
Segments:
•HigherYields
•Reliability
•QualityofProduct
•ConsumerSafety
•Training
Established:
•HigherYields
•QualityofProduct
IntegrationwithBusinessModel:
•Aboutofthevalueproposition
•Revenuesaredependenton
this
Costly?
•Yes,becauseofpatents,
researchandtechnology,
followingregulations,adaptto
market
ChannelstoCustomer
Segments:
•Ships,trucks,airplanes
•Carefullydistribute
hazardousmaterial
•Efficientlydistributes
Howarewereaching
them:
•GPStrackingon
vehiclesand
warehouses
•ITsolutions
ChannelstoCustomerSegments:
Whatarethemostimportantcostsinherentin
ourbusinessmodel?
•ResearchandDevelopment
WhichKeyResourcesaremostexpensive?
•ResearchandDevelopment
•Licensing
WhichKeyActivitiesaremostexpensive?
•ResearchandDevelopment
FixedCosts
•SalariesandRent
CostStructureRevenueStreams
ChannelstoCustomerSegments:
Forwhatvalueareourcustomersreallywillingtopay?
•Willingtopay$14.01per$1ofrevenue
Forwhatdotheycurrentlypay?
•Averagepriceforaproductis$20
Howaretheycurrentlypaying?
•DirectcontactwithSyngentaandpaywithcredit/cash/check
HowmuchdoeseachRevenueStreamcontributetooverall
revenues?
•MostoftheirrevenuecomesfromAgrochemicals(19%)ofthe
Agrochemicalmarket
•Seeds
Variablecosts
•Wages
•ProductionCosts
43
Who They Are:
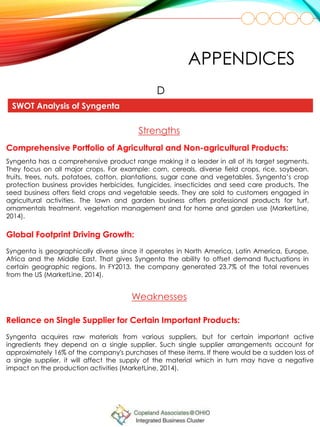
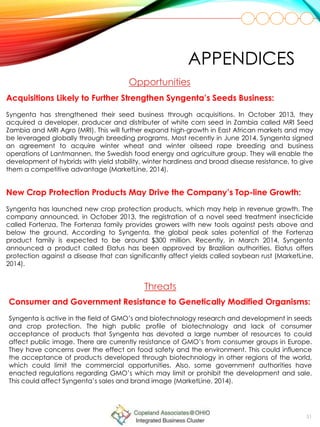
Syngenta has multiple key partners that help their company thrive in the agrochemical and
seed industry. Their key partners include Dupont, Advion and Acelpyrn, Taegro, Griffin
Greenhouse Supplies, Sunfield Seeds, Crop Farmers, Lawn and Garden business, and
Wholesalers and distributors. These key partners provide everything from nitrates and
phosphates for agrochemical production to technology for research and development. They
also have key buyers that make up majority of the industry these include crop farmers,
wholesalers and distributors, and the Lawn and Garden business (Syngenta 20-).
Key Partners
Key Suppliers:
Syngenta’s key suppliers include Dupont, Advion and Acelpyrn, Taegro, Griffin Greenhouse
Supplies, and Sunfield Seeds. Of course Syngenta has other suppliers but these companies have
created a strong relationship with them (Syngenta 20-f).
Key Activities from Partners:
The Key Resources that are obtained from their Key Partners include research and development,
nitrates and phosphates, equipment, and a loyal customer base (Syngenta 20-f).
The Key Activities that Partners Perform:
The Key Activities that partners perform in include research and development and
transportation. They also help them find new partners and opportunities for mergers and
acquisitions (Syngenta 20-f).
APPENDICES
Key Activities
Value Chain:
Syngenta’s value proposition can be shown through Syngenta’s supply chain. The supply chain
starts off with the supplier providing chemicals, seeds and equipment it takes to manufacture
their products. It is then taken to Syngenta where they add value by combining the new
technology that they receive with their seeds or making cutting edge agrochemicals. The
product is then distributed to four different customer segments distributors and retailers, importers
and exporters, farmers, and lawn and garden owners. The distributors, retailers, importers, and
exporters will provide the product to farmers as well making them a channel of reaching
Syngenta’s most popular customer. The farmers then add the most value to the product by
taking all of the key resources and making a fully grown crop. The crop is then sent to processors
who turn the product into processed foods. It is then sold to retailers who sell it to the consumer
(Syngenta, 2014).
44
Chemical
Manufacturing
and Seed
Supplies
Monsanto
Distributors
/Suppliers
Importers/
Exporters
Farmers
Lawn and Garden
Owners
Farmers
Farmers
Processors
End at
Consumer
APPENDICES
Value Offered to the Customer:
What Syngenta promises to deliver to its customer is a unique, high quality, high yield generating
product. This is important to the consumer due to the fact that Syngenta provides a product
that they can’t get from anywhere else. (Syngenta 20-f)
Value Proposition
Helping Customers Problems:
Syngenta solves multiple customer problems by providing crop protection and quality seeds that
are immune to factors that would prevent higher yields (Syngenta 20-f)
Satisfying Customer Needs:
Syngenta satisfies multiple customer needs. Wholesalers need a product that is efficient and in
demand to the consumer, farmer needs a product that generates higher yields and protects
their crops, importers and exporters need a product that is in demand globally and follows
national laws, and lawn and garden owners need protection from insects and wild animals
(Syngenta 20-f).
45
Products and Services:
The bundles of products that are being offered to each customer segment include herbicides,
fungicides, insecticides, and advanced genetic seeds. Syngenta’s highest revenue generating
products are their agrochemicals). Whereas Monsanto's greatest product is their genetic
seeds((Syngenta, 2014, 20f; Monsanto, 2014, 10K).
Customer Relationships
Relationship to Customer Relationship:
The customer segments expect multiple types of relationships. Farmers expect the product to
produce higher yields, to be reliable, have a high quality, a safe product, and proper training
(Syngenta 20-f).
Integration with the Business Model:
Syngenta has established a relationship with consumer expectations of higher yields and high
quality (Syngenta,20-F).
APPENDICES
Costly?:
Syngenta is focused on the lowering of costs by acting as sustainably as possible, but the cost of
Research and Development and the patents protecting those products is very expensive
(Syngenta 20-F).
Who we are Creating Value For:
Syngenta creates value for many areas of the market. Included are: Crop farmers in different
geographic locations such as Latin America, Asia, the Pacific, North America and Europe, and
also creating value for individual customers buying product for non-farm related operations
(Syngenta 20-F).
Customer Segments
Most Important Customers:
The most valued customers within the segment are the crop farmers, which make up the
majority of sales, wholesalers and distributors, and lawn and garden businesses. Farmers create
add value to Syngenta’s seeds by combining their product with key resources to generate it into
an incredibly valuable product. This is then sent to food processing plants, wholesalers and
distributed where it is then sold to society (Syngenta 20-F) .
46
Value Our Customers are Willing to Pay:
According to the price to earnings ratio, customers are willing to pay $14.01 for every $1 of
revenue (Syngenta 20F).
Revenue Streams
How Customers Pay:
Customers are able to pay in the usual ways of cash, debit, credit, check to purchase Syngenta
products. They can also contact Syngenta directly for a private consultation (Syngenta, 2014).
How much does each Revenue Stream Contribute to Overall Revenues:
Majority of the revenue stream is generated from their agrochemical products. Whereas their
innovative seed technology brings in the second highest for revenue (Syngenta 20f).
APPENDICES
Channels to Customer Segments:
Syngenta sends all their products via ships, trucks, airplanes and trains. Syngenta takes special
care when shipping hazardous material. Shipping efficiency is a must at Syngenta (Syngenta,
2014).
Channels
How we are Reaching Them:
Syngenta keeps track of all products in route by using GPS tracking. They are able to know
exactly where their freight is from leaving the warehouse all the way to the destination.
Syngenta uses GPS coupled with IT solutions to ensure fast and efficient shipping (Syngenta 20-F,
2014).
Key Resources
Key Resources for Value Propositions:
Syngenta’s research and development, brand protection through patents, trademarks, and
regulations and laws in local, national, and international governments are all key resources for
value propositions (Syngenta 20-f).
47
Distribution:
Syngenta has partnerships with many shipping and distribution companies. Syngenta has done
research to find the most efficient ways to ship all their products (Syngenta 20-f).
Cost Structure
Channels to Customer Segments:
Research and Development is the most important cost when it comes to the business model.
Keeping up to date with technology is how a company in this industry is successful. Syngenta
invests a large amount of money in licensing and fixed cost such as salaries, rent, and utilities.
Research and development is one of the largest outlays of money that Syngenta has. Syngenta
takes research and development very seriously as highlighted by their 1.376 billion dollar
expense (Syngenta 20-f).
Company:
Syngenta is completely value driven. All of their products are made for the value of the
customer. Prices are given to their agrochemicals and seeds based upon the yield potential and
value that they see given to the customers.
APPENDICES
48
APPENDICES
SWOT Analysis of Monsanto
D
Strengths
Leading Market Position:
Monsanto is able to offer a seeds that have high yields that are recognized as brand names.
Monsanto can easily break into new geographies because they have such a well recognized
product portfolio. With such a strong brand portfolio, Monsanto is able to enhance its market
leadership position (MarketLine, 2014 July 18).
Strong Focus on Research and Development:
Monsanto is one of the largest suppliers of agricultural needs because of their ability to deliver
innovative products to farmers. Monsanto is able to provide seeds that are weed and drought
resistant that at the same time have high yield potential. Research and development is one of
the largest investments that Monsanto makes. Investing amounted to $1,533 million in fiscal
year 2013 (MarketLine, 2014 July 18)..
Weaknesses
Legal Proceeding:
Monsanto has been in multiple lawsuits. One of which is one where the Arkansas Teacher
Retirement System filed a lawsuit because Monsanto was making false and misleading
statements regarding its earnings guidance for 2009 and 2010. The EPA has also had problems
with Monsanto. The EPA issued a Notice of Violation at the phosphorous manufacturing
plant. With these problems, shareholders have doubt in Monsanto and lead to a lack of
customer confidence in the company (MarketLine, 2014 July 18).
49
Growing Demand for Food Products With Reduced Saturated Fat and Trans-
fat:
Monsanto is on the cutting edge of health trends. The are now offering Soybeans that have
virtually eliminated trans-fatty acid in their processed soybean oil. Monsanto has also completed
many keep acquisitions. “In June 2012, Monsanto completed the purchase of planting
technology developer Precision Planting” (MarketLine 2014). The Precision Planting team is now
part of Monsanto's integrated farming systems unit, which will utilize advanced agronomic
practices, seed genetics, and innovative on-farm technology to deliver optimal yield to farmers
while using fewer resources (MarketLine, 2014 July 18)..
APPENDICES
Opportunities
Growing Population:
With the population growing, Monsanto has a huge opportunity to increase its profit. Asia has top
opportunity for Monsanto to expand. Monsanto is a leading supplier in the countries it operates
in. This gives them the advantage of having expertise, distribution network, and product portfolio
comprising well known brand names (MarketLine 2014).
Threats
Infringement of Intellectual Property Rights:
One of the biggest threats that faces Monsanto is the infringement of their intellectual property
rights If Monsanto fails to protect their intellectual property rights it could lead to substantial loss
in revenue and market share, and brand dilution. Monsanto also faces growing legislation of
genetically modified organism (GMO) regulation. Public concern can also lead to an increase in
legislation against GMOs. With legislation concerning GMOs increasing, Monsanto could face
difficulty expanding into new markets and growing its revenue (MarketLine 2014).
Seasonal:
Seasonality is also a difficult threat that Monsanto faces. In 2013 Monsanto sold 72% of seeds and
genomics in the second and third quarters. This is effected by the growing patterns found in North
America. Approximately 46% of Monsanto’s revenue comes from business outside the United
States. This is an imposing threat due to trade restrictions, investment regulations, governmental
instability, and other potentially detrimental governmental practices or policies affecting
companies doing business overseas. Fluctuation of different currencies is also pressing threat that
Monsanto faces. Monsanto also faces political and economic problems such as civil uprisings,
riots, and terrorist acts. Such problems could a great negative effect on Monsanto's revenue
growth (MarketLine 2014).
APPENDICES
Strengths
Weaknesses
Reliance on Single Supplier for Certain Important Products:
Syngenta acquires raw materials from various suppliers, but for certain important active
ingredients they depend on a single supplier. Such single supplier arrangements account for
approximately 16% of the company's purchases of these items. If there would be a sudden loss of
a single supplier, it will affect the supply of the material which in turn may have a negative
impact on the production activities (MarketLine, 2014).
SWOT Analysis of Syngenta
D
Global Footprint Driving Growth:
Syngenta is geographically diverse since it operates in North America, Latin America, Europe,
Africa and the Middle East. That gives Syngenta the ability to offset demand fluctuations in
certain geographic regions. In FY2013, the company generated 23.7% of the total revenues
from the US (MarketLine, 2014).
Comprehensive Portfolio of Agricultural and Non-agricultural Products:
Syngenta has a comprehensive product range making it a leader in all of its target segments.
They focus on all major crops. For example: corn, cereals, diverse field crops, rice, soybean,
fruits, trees, nuts, potatoes, cotton, plantations, sugar cane and vegetables. Syngenta’s crop
protection business provides herbicides, fungicides, insecticides and seed care products. The
seed business offers field crops and vegetable seeds. They are sold to customers engaged in
agricultural activities. The lawn and garden business offers professional products for turf,
ornamentals treatment, vegetation management and for home and garden use (MarketLine,
2014).
51
Opportunities
Acquisitions Likely to Further Strengthen Syngenta’s Seeds Business:
Syngenta has strengthened their seed business through acquisitions. In October 2013, they
acquired a developer, producer and distributer of white corn seed in Zambia called MRI Seed
Zambia and MRI Agro (MRI). This will further expand high-growth in East African markets and may
be leveraged globally through breeding programs. Most recently in June 2014, Syngenta signed
an agreement to acquire winter wheat and winter oilseed rape breeding and business
operations of Lantmannen, the Swedish food energy and agriculture group. They will enable the
development of hybrids with yield stability, winter hardiness and broad disease resistance, to give
them a competitive advantage (MarketLine, 2014).
APPENDICES
New Crop Protection Products May Drive the Company’s Top-line Growth:
Syngenta has launched new crop protection products, which may help in revenue growth. The
company announced, in October 2013, the registration of a novel seed treatment insecticide
called Fortenza. The Fortenza family provides growers with new tools against pests above and
below the ground. According to Syngenta, the global peak sales potential of the Fortenza
product family is expected to be around $300 million. Recently, in March 2014, Syngenta
announced a product called Elatus has been approved by Brazilian authorities. Elatus offers
protection against a disease that can significantly affect yields called soybean rust (MarketLine,
2014).
Threats
Consumer and Government Resistance to Genetically Modified Organisms:
Syngenta is active in the field of GMO’s and biotechnology research and development in seeds
and crop protection. The high public profile of biotechnology and lack of consumer
acceptance of products that Syngenta has devoted a large number of resources to could
affect public image. There are currently resistance of GMO’s from consumer groups in Europe.
They have concerns over the effect on food safety and the environment. This could influence
the acceptance of products developed through biotechnology in other regions of the world,
which could limit the commercial opportunities. Also, some government authorities have
enacted regulations regarding GMO’s which may limit or prohibit the development and sale.
This could affect Syngenta’s sales and brand image (MarketLine, 2014).
52
APPENDICES
Intense Competition Likely to Put Syngenta's Market Position Under Duress:
Syngenta operates in the crop protection industry which is a highly competitive environment. It
is mainly comprised of agricultural businesses or large chemical companies. The top
competitors are BASF, Bayer, The Dow Chemical Company, DuPont and Monsanto Company.
Syngenta also competes with generic producers. The company competes on factors like
product range, product development and differentiation, geographical coverage, price and
customer service. Competition in the seeds business is anywhere from small producers
competing in local markets. The major competitors include Monsanto Company, Vilmorin, KWS
SAAT, Bayer, Dow and Takii & Co. Intense competition may affect their market position.
Syngenta is subject to increasing laws, regulations and standards.If the company fails to comply
they could face legal proceedings and remediation liabilities. Syngenta’s operational and
financial position could be affected (MarketLine, 2014).
53
MONSANTO ASSETS Aug 31, 2013 Aug 31, 2012 Aug 31, 2011
Cash and Cash Equivalents 17.75% 16.23% 12.96%
Short-term Investments 1.23% 1.49% 1.52%
Trade Receivables, net 8.30% 9.38% 10.67%
Miscellaneous Receivables 3.62% 3.07% 3.17%
Deferred Tax Assets 2.8% 2.64% 2.25%
Inventory, net 14.26% 14.04% 13.06%
Assets of discontinued operations - - -
Other current assets 0.80% 0.90% 0.77%
Current Assets 48.77% 47.76% 44.39%
Property, plant and equipment, net 22.52% 21.58% 22.14%
Goodwill 17.03% 16.98% 16.96%
Other intangible assets, net 5.93% 6.12% 6.60%
Noncurrent deferred tax, net 2.20% 2.72% 4.40%
Long-term receivables, net 1.15% 1.86% 2.39%
Noncurrent assets of discontinued
operations
- - -
Other assets 2.40% 2.98% 3.12%
Noncurrent Assets 51.23% 52.25% 55.61%
Total Assets 100.00% 100.00% 100.00%
54
MONSANTO LIABILITIES Aug 31, 2013 Aug 31, 2012 Aug 31, 201
Short-term debt, including current portion of long
term debt
0.25% 0.18% 3.42%
Accounts payable 4.82% 3.93% 4.23%
Income taxes payable 0.44% 0.37% 0.59%
Accrued compensation and benefits 2.38% 2.70% 2.15%
Accrued marketing programs 5.22% 6.33% 5.59%
Deferred revenues 2.50% 1.96% 1.88%
Grower production accruals 0.29% 0.96% 0.44%
Dividends payable 1.10% 0.99% 0.81%
Customer payable 0.06% 0.07% 0.47%
Restructuring reserves - - 0.12%
Liabilities of discontinued operations - -
Miscellaneous short-term accruals 3.93% 3.39% 4.13%
Current Liabilities 20.98% 20.87% 23.83%
Long-term debt 9.97% 10.08% 7.78%
Postretirement liabilities 1.73% 2.68% 2.57%
Long-term deferred revenue 0.67% 1.21% 1.70%
Noncurrent deferred tax liabilities 2.27% 1.55% 0.77%
Long-term portion of environmental and litigation 0.93% 1.05% 0.89%
Noncurrent liabilities of discounted operations - -
Other liabilities 1.5% 3.04% 3.44%
Noncurrent Liabilities 17.42% 19.62% 17.13%
Total Liabilities 38.40% 40.49% 40.96%
Common stock, par value $0.01 0.03% 0.03% 0.03%
Treasury stock, at cost -20.03% -15.06% -13.17%
Additional contributed capital 52.18% 51.28% 50.88%
Retained earnings 34.79% 27.38% 21.03%
Accumulated other comprehensive loss -6.18% -5.12% -0.58%
Reserve for ESOP debt retirement - - -0.01%
Total Monsanto Company shareowners equity 60.78% 58.51% 58.18%
Noncontroling interest 0.82% 1.00% 0.86%
Total shareowners equity 61.60% 59.51% 59.04%
55
MONSANTO INCOME STATEMENT 2013 2012 2011
Net Sales 100.00% 100.00% 100.00%
Cost of Goods Sold 48.5% 47.83% 48.58%
Gross Profit 51.5% 52.17% 51.42%
Operating Expenses - - -
Selling, General and administrative
expenses
17.16% 17.70% 18.52%
Research and Development
expenses
10.32% 11.23% 11.72%
Restructuring charges, net - -0.07% -0.01%
Total Operating Expenses 27.47% 28.86% 30.26%
Income from Operations 24.02% 23.31% 21.26%
Interest Expense 1.18% 1.41% 1.37%
Interest Income -0.62% -0.57% -0.63%
Other Expenses, net 0.41% 0.34% 0.34%
Income from Continuing operations
before income taxes
23.07% 22.13% 20.08%
Income tax provision 6.16% 6.67% 6.06%
Income from Continuing operations
including portion
16.92% 15.45% 14.02%
Discounted Operations - - -
Income from Operations of
discounted businesses
0.11% 0.07% 0.03%
Income tax provision 0.04% 0.03% 0.01%
Income on discounted Operations 0.07% 0.04% 0.02%
Net Income 16.99% 15.50% 14.03%
Less: Net income attributed to
Noncontroling interest
0.29% 0.36% 0.44%
Net Income Attributed to Monsanto
Company
16.70% 15.14% 13.59%
56
SYNGENTA INCOME STATEMENT 2013 2012 2011
Net Sales 100.00% 100.00% 100.00%
Cost of Goods Sold 54.37% 50.82% 50.78%
Gross Profit 45.63% 49.18% 49.22%
Operating Expenses - - -
Marketing and Distribution 16.30% 17.03% 16.17%
Research and Development
expenses
9.37% 8.82% 8.49%
Restructuring charges, net 1.22% 1.64% 2.31%
Divestment Gains (losses) - -0.18% 0.57%
Other General and Administrative 4.54% 5.37% 7.36%
General and Administrative - -7.19% 9.10%
Total Operating Expenses 31.43%
Operating Income 14.20% 16.14% 15.46%
Income (loss) from associated and
joint ventures
- 0.05% 0.11%
Interest Income 0.82% 0.82% 0.70%
Interest Expense - 1.00% 1.15%
Other Financial Expenses - 0.14% 0.15%
Currency Gains (losses), net - 0.71% 0.65%
Financial Expense, net - 1.04% 1.24%
Income Before 13.17% 15.15% 14.33%
Income Tax Expense - 1.5% 2.27%
Net Income 11.23% 13.20% 12.06%
Less: Net income attributed to
Noncontroling interest
- 0.02% 0.01%
Net Income Attributed to Syngenta
AG shareholders
- 13.18% 12.05%
57
SYNGENTA ASSETS Dec 31, 2013 Dec 31, 2012 Dec 31, 2011
Cash and Cash Equivalents 4.46% 8.24% 9.66%
Trade Receivables, net 17.04% 16.45% 15.87%
Other accounts receivable 4.84% 4.80% 4.00%
Inventory, net 27.58% 24.40% 24.30%
Derivative and Other Financial Assets 0.96% 1.29% 1.56%
Other Current Assets 1.23% 1.32% 1.15%
Total Current Assets 56.12% 56.51% 56.55%
Property, plant and equipment, net 17.34% 16.46% 17.55%
Intangible assets 16.72% 18.05% 16.64%
Deferred Tax Assets 4.75% 5.54% 5.39%
Derivative financial assets and other
non-current assets
4.05% 2.89% 3.11%
Investments in associates and joint
ventures
1.01% 0.74% 0.76%
Noncurrent Assets 43.88% 43.49% 43.45%
Total Assets 100.00% 100.00% 100.00%
58
SYNGENTA LIABLITIES Dec 31,
2013
Dec 31, 2012 Dec 31, 2011
Trade accounts payable 18.88% 17.57% 16.71%
Current financial debt and other financial
liabilities
7.87% 5.93% 5.54%
Income Taxes Payable 3.4% 2.95% 3.17%
Other Current Liabilities 4.81% 5.97% 5.96%
Provisions 1.42% 1.22% 1.35%
Total Current Liabilities 36.39% 33.13% 32.73%
Financial debt and other non-current
liabilities
12.21% 12.63%
Deferred tax liabilities 3.93% 4.45% 4.37%
Provisions 3.79% 4.33% 5.61%
Non-current liabilities 16.60% 21.74% 23.75%
Total Liabilities 52.99% 54.87% 56.48%
Issued share capital 0.03% 0.03% 0.03%
Reserves 18.87% 19.21% 18.48%
Retained earnings 30.43% 27.24% 21.67%
Total Shareholders’ Equity 46.95% 45.14% 43.65%
Total liabilities and equity 100.00% 100.00% 100.00%