This journal is © The Royal Society of Chemistry 2021 J. Mater. Chem. C, 2021, 9, 9791–9819 | 9791
Cite this: J. Mater. Chem. C, 2021,
9, 9791
Computational electromagnetics in
plasmonic nanostructures
Amirmostafa Amirjani * and S. K. Sadrnezhaad *
Plasmonic nanostructures have emerging applications in solar cells, photodynamic therapies, surface-
enhanced Raman scattering detection, and photocatalysis due to the excitation of localized surface
plasmons. The exciting electric field resulting from the collective oscillation of free electrons is highly
dependent on the dielectric medium, shape, size, composition, and configuration of plasmonic
nanostructures. From an engineering perspective, one can tune the optimal properties in the desired
applications of geometrical parameters such as the shape, size, and nanoparticles’ configuration. Such
optimization should be performed analytically (with exact solutions) or numerically (with specific
approximations). Despite the accuracy of the analytical approaches (such as Mie theory), they have
mainly been limited to arbitrary and simple geometries, i.e. spheres. This review revisited the theory of
mostly implemented numerical approaches for simulating the optical response of plasmonic
nanostructures. This paper discusses the finite difference time domain (FDTD), finite element method
(FEM), discrete dipole approximation (DDA), and boundary element method (BEM) from both theoretical
and practical points of view. The most recent applications of numerical simulations in different fields are
presented and discussed. This comprehensive review can be promisingly considered as a guide for the
researchers.
1 Introduction
The importance of light–matter interaction can be traced back
to antiquity, followed by Islam’s golden age of science and the
European Renaissance. Until the eighteenth century, the nature
of light was still unknown and the ‘‘corpuscular theory of light’’
Department of Materials Science and Engineering, Sharif University of Technology,
P. O. Box: 11155-9466, Tehran, Iran. E-mail: amirjani@sharif.edu,
sadrnezh@sharif.edu
Amirmostafa Amirjani
Amirmostafa Amirjani is a
tenure-track assistant professor
at the Department of Materials
Science and Engineering, Sharif
University of Technology,
Tehran, Iran. He received his
BSc and PhD at Amirkabir
University of Technology (Tehran
Polytechnic), Tehran, Iran. He
entitled Iran’s National Elites
Foundation award for four years
between 2014 and 2018. After
graduation, he continued his
research as a scientist at École
polytechnique fédérale de Lausanne (EPFL), Switzerland between
2018 and 2020. His research interests include the size and shape-
controlled synthesis of nanostructures, optical sensors, and
plasmonics.
S. K. Sadrnezhaad
Sayed Khatiboleslam Sadrnezhaad
is a distinguished professor at the
Department of Materials Science
and Engineering of the Sharif
University of Technology. He
received his PhD from the
Massachusetts Institute of
Technology in 1979 and his BSc
from the Sharif University of
Technology in 1974. He was
entitled as 1% world’s top
scientists by ESI citation database
from Thomson Reuters, 2015 and
2016. He is the holder of a research
chair from the Iran National Science Foundation (INSF). His current
interest is in the emerging bio–nano and SMA fields of the materials
science and engineering discipline.
Received 15th April 2021,
Accepted 6th July 2021
DOI: 10.1039/d1tc01742j
rsc.li/materials-c
Journal of
Materials Chemistry C
REVIEW
9792 | J. Mater. Chem. C, 2021, 9, 9791–9819 This journal is © The Royal Society of Chemistry 2021
was generally accepted among the scientists.1
The nineteenth
century was a breakthrough in the ‘‘wave theory of light,’’ which
was started by Thomas Young’s double-slit experiment and
flourished by Maxwell’s dynamical theory of the electro-
magnetic field.2
At present, the light–matter interaction is still
essential; however, there is a solid understanding of the nature
of light with extraordinary properties being discovered
every day.
One of the most exciting phenomena in this regard since the
last decade was the interaction of light with metallic nano-
particles, studied in a new photonic branch called plasmonics.
The excitation of surface plasmons enables various linear and
non-linear optical properties such as optical sensors,3–7
nanoantennas, light-harvesting, and photocatalysis,8
to name a
few.9–13
The emerging applications of surface plasmon resonance
(SPR) are not the primary goal of this review, and one can refer to
the most recent reviews from Homola et al. and Chen et al. on this
topic.14,15
The underlying mechanism for this extraordinary optical
behavior is the near-field distribution of electromagnetic fields
resulting from light interaction with the oscillating electrons at
the surface of plasmonic nanoparticles.16–19
This interaction is
highly dependent on the size, shape, configuration, medium,
and dielectric function of the nanostructure. The formulation
of light interaction with plasmonic nanostructures can be used
in the pre-design process to reach the final application’s
desired configuration and properties. The efforts for this
formulation started from the pioneering work of Gustav Mie,
who proposed an analytical solution to Maxwell’s equation for a
spherical system. This theory has been adapted to other
structures but is mainly limited to spheroidal shapes.19
In the
case of a spherical nanostructure, one can write the scattering
and absorption cross-sections as
Csca ¼
2
x2
X
1
j¼1
ð2j þ 1Þðjajj2
þ jbjj2
Þ (1)
Cabs ¼
2
x2
X
1
j¼1
2j þ 1
ð ÞRefaj þ bjg (2)
where x is the size parameter and equals 2pr/l, and the aj and bj
values are the expansion coefficients expressed by Riccati–
Bessel functions. Also, j is an integer representing the dipole
( j = 1), quadrupole ( j = 2), and higher modes of excitations ( j =
3, 4,. . .). One can calculate the extinction cross-section by the
summation of Csca and Cabs. The exact solution to Maxwell’s
equations obtained from this method is reliable. Howbeit, as
mentioned earlier, Mie’s theory is not valid for heterogeneous
nanostructures with complex and irregular geometries. In this
regard, several numerical methods have been developed to
address this issue. Finite-difference time-domain, discrete
dipole approximation, the finite element method, and the
boundary element method are the most used methods.20
Numerical simulation of light interaction with plasmonic
nanoparticles is not simply a descriptive study but has practical
use in engineering applications. This review revisits the theory
of the methods mentioned above for numerical simulation of
light interaction with plasmonic nanostructures was first
revisited. Then, the most recent efforts for using each method
are presented and discussed from an application point of view
along with the positive and negative aspects of each approach.
This review is not intended to present a compilation of previous
efforts on numerical simulation of plasmonic nanostructures.
Instead, it aims to give an in-depth insight into each method’s
possible application. The authors believe that this review can
be used as a guideline for researchers in the field who are
interested in numerical simulations.
2 Finite-difference time-domain
(FDTD)
The FDTD method, as a finite-difference technique, changes
the Maxwell’s differential equations to difference equations in
an explicit time-stepping scheme. Kane Yee developed this
method in 1996.21
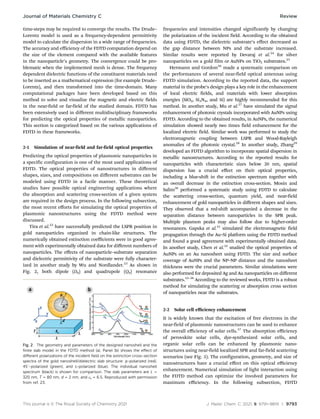
By dividing the physical space into finite
small meshes (Yee cells, see Fig. 1) and also Dt time step for
time discretization, the H-fields and E-fields can be calculated
after a first-order approximation was made. For example, at
first, the electric field vector components are solved at a given
time in the schematized Yee cell (Fig. 1). In the next time step,
the magnetic field vector components are solved for the
same cell. This process is continued for many iterations until
convergence is obtained.
According to the Maxwell’s equations (eqn (3)), the exact
value of the E-field at any time step is dependent on the
distribution of the H-field in space at that timeframe, and this
is also true vice versa; e.g., the exact value of the H-field at any
time step is dependent on the local distribution of the E-field.
r  H ¼
1
c
4pJ þ
@E
@t
 
(3)
Calculating the numerical curve for the E-field and H-field is
complicated, especially in a three-dimensional space. With the
Yee lattice aid, the FDTD approach can solve Maxwell’s
difference equations in a leapfrog manner, even though many
Fig. 1 Schematic representation of Yee cells for the discretization of
magnetic and electric fields in space.
Review Journal of Materials Chemistry C
This journal is © The Royal Society of Chemistry 2021 J. Mater. Chem. C, 2021, 9, 9791–9819 | 9793
time-steps may be required to converge the results. The Drude–
Lorentz model is used as a frequency-dependent permittivity
model to calculate the dispersion in a wide range of frequencies.
The accuracy and efficiency of the FDTD computation depend on
the size of the element compared with the available features
in the nanoparticle’s geometry. The convergence could be pro-
blematic when the implemented mesh is dense. The frequency
dependent dielectric functions of the constituent materials need
to be inserted as a mathematical expression (for example Drude–
Lorentz), and then transformed into the time-domain. Many
computational packages have been developed based on this
method to solve and visualize the magnetic and electric fields
in the near-field or far-field of the studied domain. FDTD has
been extensively used in different multidisciplinary frameworks
for predicting the optical properties of metallic nanoparticles.
This section is categorized based on the various applications of
FDTD in these frameworks.
2-1 Simulation of near-field and far-field optical properties
Predicting the optical properties of plasmonic nanoparticles in
a specific configuration is one of the most used applications of
FDTD. The optical properties of nanostructures in different
shapes, sizes, and compositions on different substrates can be
modeled using FDTD in a facile manner. These theoretical
studies have possible optical engineering applications where
the absorption and scattering cross-section of a given system
are required in the design process. In the following subsection,
the most recent efforts for simulating the optical properties of
plasmonic nanostructures using the FDTD method were
discussed.
Tira et al.22
have successfully predicted the LSPR position in
gold nanoparticles organized in chain-like structures. The
numerically obtained extinction coefficients were in good agree-
ment with experimentally obtained data for different numbers of
nanoparticles. The effects of nanoparticle–substrate separation
and dielectric permittivity of the substrate were fully character-
ized in another study by Wu and Nordlander.23
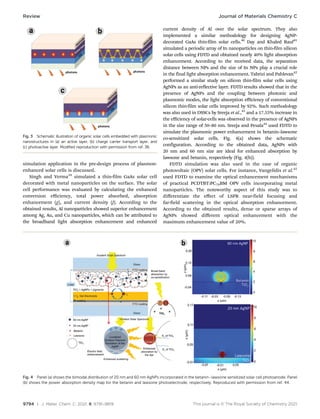
As shown in
Fig. 2, both dipole (D0) and quadrupole (Q0) resonance
frequencies and intensities changed significantly by changing
the polarization of the incident field. According to the obtained
data using FDTD, the dielectric substrate’s effect decreased as
the gap distance between NPs and the substrate increased.
Similar results were reported by Devaraj et al.24
for silver
nanoparticles on a gold film or AuNPs on TiO2 substrates.25
Hermann and Gordon26
made a systematic comparison on
the performances of several near-field optical antennas using
FDTD simulation. According to the reported data, the support
material in the probe’s design plays a key role in the enhancement
of local electric fields, and materials with lower absorption
energies (SiO2, Si3N4, and Si) are highly recommended for this
method. In another study, Mu et al.27
have simulated the signal
enhancement of photonic crystals incorporated with AuNPs using
FDTD. According to the obtained results, in AuNPs, the numerical
simulation showed nearly two times field enhancement for the
localized electric field. Similar work was performed to study the
electromagnetic coupling between LSPR and Wood-Rayleigh
anomalies of the photonic crystal.28
In another study, Zhang29
developed an FDTD algorithm to incorporate spatial dispersion in
metallic nanostructures. According to the reported results for
nanoparticles with characteristic sizes below 20 nm, spatial
dispersion has a crucial effect on their optical properties,
including a blue-shift in the extinction spectrum together with
an overall decrease in the extinction cross-section. Mosin and
Salim30
performed a systematic study using FDTD to calculate
the scattering cross-section, quantum yield, and near-field
enhancement of gold nanoparticles in different shapes and sizes.
They observed that a red-shift accompanied a decrease in the
separation distance between nanoparticles in the SPR peak.
Multiple plasmon peaks may also follow due to higher-order
resonances. Gapska et al.31
simulated the electromagnetic field
propagation through the Au–Si platform using the FDTD method
and found a good agreement with experimentally obtained data.
In another study, Chen et al.32
studied the optical properties of
AuNPs on an Au nanosheet using FDTD. The size and surface
coverage of AuNPs and the NP–NP distance and the nanosheet
thickness were the crucial parameters. Similar simulations were
also performed for deposited Ag and Au nanoparticles on different
substrates.33–36
According to the reviewed works, FDTD is a robust
method for simulating the scattering or absorption cross section
of nanoparticles near the substrates.
2-2 Solar cell efficiency enhancement
It is widely known that the excitation of free electrons in the
near-field of plasmonic nanostructures can be used to enhance
the overall efficiency of solar cells.37
The absorption efficiency
of perovskite solar cells, dye-synthesized solar cells, and
organic solar cells can be enhanced by plasmonic nano-
structures using near-field localized SPR and far-field scattering
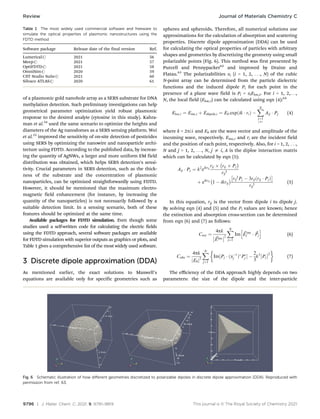
scenarios (see Fig. 3). The configuration, geometry, and size of
nanostructures have a crucial effect on this optical efficiency
enhancement. Numerical simulation of light interaction using
the FDTD method can optimize the involved parameters for
maximum efficiency. In the following subsection, FDTD
Fig. 2 The geometry and parameters of the designed nanoshell and the
finite slab model in the FDTD method (a). Panel (b) shows the effect of
different polarizations of the incident field on the extinction cross-section
spectra of the gold nanoshell/dielectric slab structure: p-polarized (red),
451-polarized (green), and s-polarized (blue). The individual nanoshell
spectrum (black) is shown for comparison. The slab parameters are L =
320 nm, T = 80 nm, d = 2 nm, and es = 6.5. Reproduced with permission
from ref. 23.
Journal of Materials Chemistry C Review
9794 | J. Mater. Chem. C, 2021, 9, 9791–9819 This journal is © The Royal Society of Chemistry 2021
simulation application in the pre-design process of plasmon-
enhanced solar cells is discussed.
Singh and Verma39
simulated a thin-film GaAs solar cell
decorated with metal nanoparticles on the surface. The solar
cell performance was evaluated by calculating the enhanced
conversion efficiency, total power absorbed, absorption
enhancement (g), and current density (J). According to the
obtained results, Al nanoparticles showed superior enhancement
among Ag, Au, and Cu nanoparticles, which can be attributed to
the broadband light absorption enhancement and enhanced
current density of Al over the solar spectrum. They also
implemented a similar methodology for designing AgNP-
decorated GaAs thin-film solar cells.40
Day and Khaled Rauf41
simulated a periodic array of In nanoparticles on thin-film silicon
solar cells using FDTD and obtained nearly 40% light absorption
enhancement. According to the received data, the separation
distance between NPs and the size of In NPs play a crucial role
in the final light absorption enhancement. Tabrizi and Pahlevan42
performed a similar study on silicon thin-film solar cells using
AgNPs as an anti-reflective layer. FDTD results showed that in the
presence of AgNPs and the coupling between photonic and
plasmonic modes, the light absorption efficiency of conventional
silicon thin-film solar cells improved by 92%. Such methodology
was also used in DSSCs by Sreeja et al.,43
and a 17.55% increase in
the efficiency of solar-cells was observed in the presence of AgNPs
in the size range of 50–80 nm. Sreeja and Pesala44
used FDTD to
simulate the plasmonic power enhancement in betanin–lawsone
co-sensitized solar cells. Fig. 4(a) shows the schematic
configuration. According to the obtained data, AgNPs with
20 nm and 60 nm size are ideal for enhanced absorption by
lawsone and betanin, respectively (Fig. 4(b)).
FDTD simulation was also used in the case of organic
photovoltaic (OPV) solar cells. For instance, Vangelidis et al.45
used FDTD to examine the optical enhancement mechanisms
of practical PCDTBT:PC70BM OPV cells incorporating metal
nanoparticles. The noteworthy aspect of this study was to
differentiate the effect of LSPR near-field focusing and
far-field scattering in the optical absorption enhancement.
According to the obtained results, dense or sparse arrays of
AgNPs showed different optical enhancement with the
maximum enhancement value of 20%.
Fig. 4 Panel (a) shows the bimodal distribution of 20 nm and 60 nm AgNPs incorporated in the betanin–lawsone sensitized solar cell photoanode. Panel
(b) shows the power absorption density map for the betanin and lawsone photoelectrode, respectively. Reproduced with permission from ref. 44.
Fig. 3 Schematic illustration of organic solar cells embedded with plasmonic
nanostructures in (a) an active layer, (b) charge carrier transport layer, and
(c) photoactive layer. Modified reproduction with permission from ref. 38.
Review Journal of Materials Chemistry C
This journal is © The Royal Society of Chemistry 2021 J. Mater. Chem. C, 2021, 9, 9791–9819 | 9795
A similar study was also performed by Sreeja and Pesala46
for efficiency enhancement of betanin–chlorophyll co-
sensitized natural pigment solar cells using different size
profiles of AgNPs. The absorption enhancement of organic
solar cells using plasmonic AgNPs in different concentrations
was studied by Ciesielski et al.47
They have found that
the dominant mechanism of absorption enhancement is
different when individual AgNPs or a continuous layer of
AgNPs is modeled. This should be considered in FDTD
simulations. Royanian et al.48
enhanced the efficiency of
copper indium gallium selenide (CIGS) solar cells by
spherical AuNPs using FDTD simulation. The numerical
studies revealed that the plasmonic AuNPs increased the
efficiency up to 19% by restricting, absorbing, navigating, or
scattering the incident light. In another study, AuNPs were
used in the light-trapping layer inside the photoactive layer
to enhance the perovskite solar cell’s multiple scattering and
light absorptions.49
According to the FDTD simulations,
employment of AuNPs on both sides resulted in a maximum
efficiency improvement. These studies suggest that FDTD
provides a suitable framework for simulating the enhancement
from incorporating single nanoparticles or arrays of nano-
particles in the solar cell architecture. Not only the geometrical
features of nanoparticles (size, morphology, etc.), but also the
actual position of nanoparticles could be optimized using
FDTD simulation.
2-3 Sensing application/SERS analysis enhancement
Surface-enhanced Raman scattering (SERS) detection is based
on the electromagnetic and chemical enhancement and Raman
signal from the desired molecule in the proximity of metallic
nanostructures.50
Localized surface plasmon resonance excitation
from the noble metal nanostructures can enhance the Raman
signal by intensifying the molecule’s polarization. However,
several parameters include the distance between the nano-
structure and the molecule, the shape and size of the plasmonic
nanostructure, the substrate’s composition, etc., which cannot be
identified thoroughly without experimental measurements.
However, numerical simulations can investigate the effect of
pertinent parameters on the excited electromagnetic fields. FDTD
simulation is widely used for this purpose, and in the following
section, the most recent works were reviewed.
Berto-rosello et al.51
used 3D-FDTD numerical simulation to
evaluate the performance of gold-coated nano-porous anodic
alumina as a reflectometry-based plasmonic biosensor.
According to the obtained data, thinner gold coatings increased
the sensitivity, but the measurement resolution was also
decreased. Sheena et al.52
studied the ability of AgNPs on a Si
substrate for in situ cellular DNA detection using FDTD. The
obtained results showed that the sensing platform’s SERS
efficiency was maximum when non-identical NPs were used
(see Fig. 5(a)). In another work, by Luo et al.53
FDTD was used
as a preliminary study to simulate the electric field distribution
Fig. 5 Panel (a) shows the FDTD electromagnetic field enhancement simulation of AgNPs in identical and non-identical sizes of 5 nm, 8 nm, and
12 nm. Panel (b) shows the schematic illustration of a plasmonic gold nanohole array for surface-enhanced Raman scattering detection
of DNA methylation. Panel (c) and (d) show the schematic combination of AgNWs and AgNPs as hot spots in SERS substrates and
the numerical simulation of maximum enhancement using FDTD, respectively. All of the figures are reproduced with permission from ref. 52, 53
and 55.
Journal of Materials Chemistry C Review
9796 | J. Mater. Chem. C, 2021, 9, 9791–9819 This journal is © The Royal Society of Chemistry 2021
of a plasmonic gold nanohole array as a SERS substrate for DNA
methylation detection. Such preliminary investigations can help
geometrical parameter optimization yield robust plasmonic
response to the desired analyte (cytosine in this study). Kahra-
man et al.54
used the same scenario to optimize the heights and
diameters of the Ag nanodomes as a SERS sensing platform. Wei
et al.55
improved the sensitivity of on-site detection of pesticides
using SERS by optimizing the nanowire and nanoparticle archi-
tecture using FDTD. According to the published data, by increas-
ing the quantity of AgNWs, a larger and more uniform EM field
distribution was obtained, which helps SERS detection’s sensi-
tivity. Crucial parameters in SERS detection, such as the thick-
ness of the substrate and the concentration of plasmonic
nanoparticles, can be optimized straightforwardly using FDTD.
However, it should be mentioned that the maximum electro-
magnetic field enhancement (for instance, by increasing the
quantity of the nanoparticles) is not necessarily followed by a
suitable detection limit. In a sensing scenario, both of these
features should be optimized at the same time.
Available packages for FDTD simulation. Even though some
studies used a self-written code for calculating the electric fields
using the FDTD approach, several software packages are available
for FDTD simulation with superior outputs as graphics or plots, and
Table 1 gives a comprehensive list of the most widely used software.
3 Discrete dipole approximation (DDA)
As mentioned earlier, the exact solutions to Maxwell’s
equations are available only for specific geometries such as
spheres and spheroids. Therefore, all numerical solutions use
approximations for the calculation of absorption and scattering
properties. Discrete dipole approximation (DDA) can be used
for calculating the optical properties of particles with arbitrary
shapes and geometries by discretizing the geometry using small
polarizable points (Fig. 6). This method was first presented by
Purcell and Pennypacker62
and improved by Draine and
Flatau.63
The polarizabilities ai (i = 1, 2, . . ., N) of the cubic
N-point array can be determined from the particle dielectric
functions and the induced dipole Pi for each point in the
presence of a plane wave field is Pi = aiEloc,i. For i = 1, 2,. . .,
N, the local field (Eloc,i) can be calculated using eqn (4):64
Eloc;i ¼ Einc;i þ Edipole;i ¼ E0 exp ik  ri
ð Þ 
X
N
j¼1
jai
Aij  Pj (4)
where k = 2p/l and E0 are the wave vector and amplitude of the
incoming wave, respectively. Einc,i and ri are the incident field
and the position of each point, respectively. Also, for i = 1, 2, . . .,
N and j = 1, 2, . . ., N, j a i, A is the diploe interaction matrix
which can be calculated by eqn (5):
Aij  Pj ¼ k2
eikrij
rij  rij  Pj
 
rij
3
þ eikrij
1  ikrij
  rij
2
Pj  3rijðrij  PjÞ
 
rij
5
(5)
In this equation, rij is the vector from dipole i to dipole j.
By solving eqn (4) and (5) and the Pi values are known; hence
the extinction and absorption cross-section can be determined
from eqn (6) and (7) as follows:
Cext ¼
4pk
~
Einc


2
X
N
j¼1
Im ~
Ej
inc
 ~
Pj
h i
(6)
Cabs ¼
4pk
E0
j j2
X
N
j¼1
Im½Pj  ða1
j Þ
P
j  
2
3
k3
Pj


2
	 

(7)
The efficiency of the DDA approach highly depends on two
parameters: the size of the dipole and the inter-particle
Table 1 The most widely used commercial software and freeware to
simulate the optical properties of plasmonic nanostructures using the
FDTD method
Software package Release date of the final version Ref.
Lumericalr 2021 56
Meepr 2021 57
OptiFDTDr 2021 58
OmniSimr 2020 59
CST Studio Suiter 2021 60
Silvaco ATLASr 2020 61
Fig. 6 Schematic illustration of how different geometries discretized to polarizable dipoles in discrete dipole approximation (DDA). Reproduced with
permission from ref. 63.
Review Journal of Materials Chemistry C
This journal is © The Royal Society of Chemistry 2021 J. Mater. Chem. C, 2021, 9, 9791–9819 | 9797
distance between the dipoles. For a given system, the size of the
dipoles should be much smaller than the wavelength of the
light and be able to reproduce the actual geometry accurately.
Usually, the number of dipoles N 4 106
should be used.
The optical constants could be easily inserted from the
experimental data, for example real and imaginary parts versus
wavelength. The DDA method has been used for calculating the
optical properties of plasmonic nanostructures in different
frameworks. In the following section, the most recent efforts
were presented and discussed.
3-1 Simulation of near-field and far-field optical properties
DDA can be used for arbitrary and non-arbitrary geometries to
simulate the optical properties of plasmonic nanostructures in
intricate designs. Roopak et al.65
simulated the broadband
scattering of coated and non-coated Au nanostructures in
different geometries using DDA. According to the obtained
data, in the same radii, the core–shell nanospheroid geometry
showed better tunability in surface plasmon resonance.
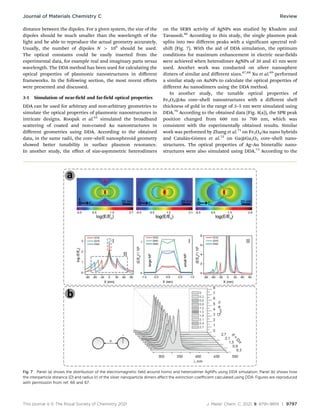
In another study, the effect of size-asymmetric heterodimers
on the SERS activity of AgNPs was studied by Khadem and
Tavassoli.66
According to this study, the single plasmon peak
splits into two different peaks with a significant spectral red-
shift (Fig. 7). With the aid of DDA simulation, the optimum
conditions for maximum enhancement in electric near-fields
were achieved when heterodimer AgNPs of 30 and 45 nm were
used. Another work was conducted on silver nanosphere
dimers of similar and different sizes.67,68
Xu et al.69
performed
a similar study on AuNPs to calculate the optical properties of
different Au nanodimers using the DDA method.
In another study, the tunable optical properties of
Fe3O4@Au core–shell nanostructures with a different shell
thickness of gold in the range of 3–5 nm were simulated using
DDA.70
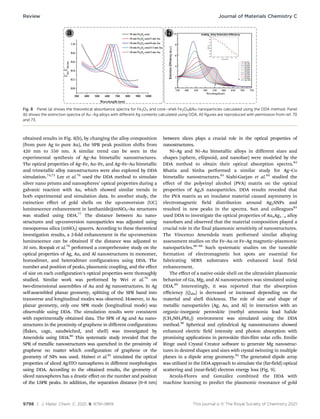
According to the obtained data (Fig. 8(a)), the SPR peak
position changed from 600 nm to 700 nm, which was
consistent with the experimentally obtained results. Similar
work was performed by Zhang et al.71
on Fe3O4/Au nano hybrids
and Catalán-Gómez et al.72
on Ga@Ga2O3 core–shell nano-
structures. The optical properties of Ag–Au bimetallic nano-
structures were also simulated using DDA.73
According to the
Fig. 7 Panel (a) shows the distribution of the electromagnetic field around homo and heterodimer AgNPs using DDA simulation. Panel (b) shows how
the interparticle distance (D) and radius (r) of the silver nanoparticle dimers affect the extinction coefficient calculated using DDA. Figures are reproduced
with permission from ref. 66 and 67.
Journal of Materials Chemistry C Review
9798 | J. Mater. Chem. C, 2021, 9, 9791–9819 This journal is © The Royal Society of Chemistry 2021
obtained results in Fig. 8(b), by changing the alloy composition
(from pure Ag to pure Au), the SPR peak position shifts from
420 nm to 550 nm. A similar trend can be seen in the
experimental synthesis of Ag–Au bimetallic nanostructures.
The optical properties of Ag–Fe, Au–Fe, and Ag–Fe–Au bimetallic
and trimetallic alloy nanostructures were also explored by DDA
simulation.74,75
Lee et al.76
used the DDA method to simulate
silver nano prisms and nanospheres’ optical properties during a
galvanic reaction with Au, which showed similar trends in
both experimental and simulation data. In another study, the
extinction effect of gold shells on the up-conversion (UC)
luminescence enhancement in lanthanide@mSiO2–Au structures
was studied using DDA.77
The distance between Au nano-
structures and up-conversion nanoparticles was adjusted using
mesoporous silica (mSiO2) spacers. According to these theoretical
investigation results, a 2-fold enhancement in the up-conversion
luminescence can be obtained if the distance was adjusted to
30 nm. Roopak et al.78
performed a comprehensive study on the
optical properties of Ag, Au, and Al nanostructures in monomer,
homodimer, and heterodimer configurations using DDA. The
number and position of peaks, plasmonic coupling, and the effect
of size on each configuration’s optical properties were thoroughly
studied. Similar work was performed by Wei et al.79
on
two-dimensional assemblies of Au and Ag nanostructures. In Ag
self-assembled planar geometry, splitting of the SPR band into
transverse and longitudinal modes was observed. However, in Au
planar geometry, only one SPR mode (longitudinal mode) was
observable using DDA. The simulation results were consistent
with experimentally obtained data. The SPR of Ag and Au nano-
structures in the proximity of graphene in different configurations
(flakes, cage, sandwiched, and shell) was investigated by
Amendola using DDA.80
This systematic study revealed that the
SPR of metallic nanostructures was quenched in the proximity of
graphene no matter which configuration of graphene or the
geometry of NPs was used. Haiwei et al.81
simulated the optical
properties of sliced Ag/ITO nanospheres in different morphologies
using DDA. According to the obtained results, the geometry of
sliced nanospheres has a drastic effect on the number and position
of the LSPR peaks. In addition, the separation distance (0–8 nm)
between slices plays a crucial role in the optical properties of
nanostructures.
Ni–Ag and Ni–Au bimetallic alloys in different sizes and
shapes (sphere, ellipsoid, and nanobar) were modeled by the
DDA method to obtain their optical absorption spectra.82
Bhatia and Sinha performed a similar study for Ag–Co
bimetallic nanostructures.83
Siabi-Garjan et al.84
studied the
effect of the polyvinyl alcohol (PVA) matrix on the optical
properties of Ag2S nanoparticles. DDA results revealed that
the PVA matrix as an insulator material caused asymmetry in
electromagnetic field distribution around Ag2SNPs and
resulted in new peaks in the spectra. Sun and colleagues85
used DDA to investigate the optical properties of AuxAg1x alloy
nanobars and observed that the material composition played a
crucial role in the final plasmonic sensitivity of nanostructures.
The Vincenzo Amendola team performed similar alloying
assessment studies on the Fe–Au or Fe–Ag magnetic–plasmonic
nanoparticles.86–88
Such systematic studies on the tuneable
formation of electromagnetic hot spots are essential for
fabricating SERS substrates with enhanced local field
enhancement.
The effect of a native oxide shell on the ultraviolet plasmonic
behavior of Ga, Mg, and Al nanostructures was simulated using
DDA.89
Interestingly, it was reported that the absorption
efficiency (Qabs) is decreased or increased depending on the
material and shell thickness. The role of size and shape of
metallic nanoparticles (Ag, Au, and Al) in interaction with an
organic–inorganic perovskite (methyl ammonia lead halide
(CH3NH3PbI3)) environment was simulated using the DDA
method.90
Spherical and cylindrical Ag nanostructures showed
enhanced electric field intensity and photon absorption with
promising applications in perovskite thin-film solar cells. Emilie
Ringe used Crystal Creator software to generate Mg nanostruc-
tures in desired shapes and sizes with crystal twinning in multiple
planes in a dipole array geometry.91
The generated dipole array
was utilized in the DDA approach to simulate the (far-field) optical
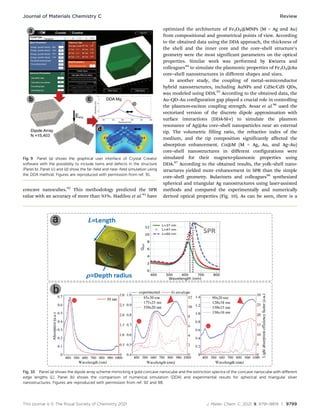
scattering and (near-field) electron energy loss (Fig. 9).
Arzola-Flores and González combined the DDA with
machine learning to predict the plasmonic resonance of gold
Fig. 8 Panel (a) shows the theoretical absorbance spectra for Fe3O4 and core–shell Fe3O4@Au nanoparticles calculated using the DDA method. Panel
(b) shows the extinction spectra of Au–Ag alloys with different Ag contents calculated using DDA. All figures are reproduced with permission from ref. 70
and 73.
Review Journal of Materials Chemistry C
This journal is © The Royal Society of Chemistry 2021 J. Mater. Chem. C, 2021, 9, 9791–9819 | 9799
concave nanocubes.92
This methodology predicted the SPR
value with an accuracy of more than 93%. Hadilou et al.93
have
optimized the architecture of Fe3O4@MNPs (M = Ag and Au)
from compositional and geometrical points of view. According
to the obtained data using the DDA approach, the thickness of
the shell and the inner core and the core–shell structure’s
geometry were the most significant parameters on the optical
properties. Similar work was performed by Kwizera and
colleagues94
to simulate the plasmonic properties of Fe3O4@Au
core–shell nanostructures in different shapes and sizes.
In another study, the coupling of metal–semiconductor
hybrid nanostructures, including AuNPs and CdSe/CdS QDs,
was modeled using DDA.95
According to the obtained data, the
Au–QD–Au configuration gap played a crucial role in controlling
the plasmon-exciton coupling strength. Avsar et al.96
used the
vectorized version of the discrete dipole approximation with
surface interactions (DDA-SI-v) to simulate the plasmon
resonance of Ag@Au core–shell nanoparticles near an external
tip. The volumetric filling ratio, the refractive index of the
medium, and the tip composition significantly affected the
absorption enhancement. Co@M (M = Ag, Au, and Ag–Au)
core–shell nanostructures in different configurations were
simulated for their magneto-plasmonic properties using
DDA.97
According to the obtained results, the yolk–shell nano-
structures yielded more enhancement in SPR than the simple
core–shell geometry. Bulavinets and colleagues98
synthesized
spherical and triangular Ag nanostructures using laser-assisted
methods and compared the experimentally and numerically
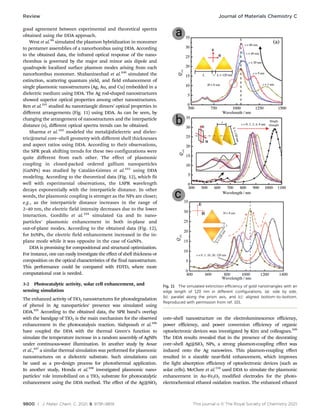
derived optical properties (Fig. 10). As can be seen, there is a
Fig. 9 Panel (a) shows the graphical user interface of Crystal Creator
software with the possibility to include twins and defects in the structure
(Panel b). Panel (c) and (d) show the far-field and near-field simulation using
the DDA method. Figures are reproduced with permission from ref. 91.
Fig. 10 Panel (a) shows the dipole array scheme mimicking a gold concave nanocube and the extinction spectra of the concave nanocube with different
edge lengths (L). Panel (b) shows the comparison of numerical simulation (DDA) and experimental results for spherical and triangular silver
nanostructures. Figures are reproduced with permission from ref. 92 and 98.
Journal of Materials Chemistry C Review
9800 | J. Mater. Chem. C, 2021, 9, 9791–9819 This journal is © The Royal Society of Chemistry 2021
good agreement between experimental and theoretical spectra
obtained using the DDA approach.
West et al.99
simulated the plasmon hybridization in monomer
to pentamer assemblies of a nanorhombus using DDA. According
to the obtained data, the infrared optical response of the nano-
rhombus is governed by the major and minor axis dipole and
quadrupole localized surface plasmon modes arising from each
nanorhombus monomer. Shabaninezhad et al.100
simulated the
extinction, scattering quantum yield, and field enhancement of
single plasmonic nanostructures (Ag, Au, and Cu) embedded in a
dielectric medium using DDA. The Ag rod-shaped nanostructures
showed superior optical properties among other nanostructures.
Ren et al.101
studied Au nanotriangle dimers’ optical properties in
different arrangements (Fig. 11) using DDA. As can be seen, by
changing the arrangement of nanostructures and the interparticle
distance (s), different optical spectra trends can be obtained.
Sharma et al.102
modeled the metal@dielectric and dielec-
tric@metal core–shell geometry with different shell thicknesses
and aspect ratios using DDA. According to their observations,
the SPR peak shifting trends for these two configurations were
quite different from each other. The effect of plasmonic
coupling in closed-packed ordered gallium nanoparticles
(GaNPs) was studied by Catalán-Gómez et al.103
using DDA
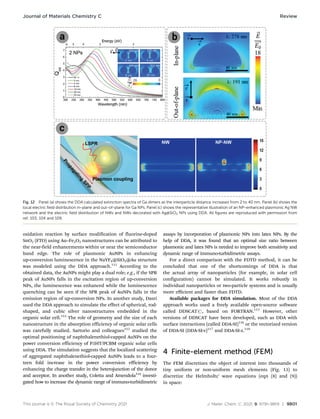
modeling. According to the theoretical data (Fig. 12), which fit
well with experimental observations, the LSPR wavelength
decays exponentially with the interparticle distance. In other
words, the plasmonic coupling is stronger as the NPs are closer;
e.g., as the interparticle distance increases in the range of
2–40 nm, the electric field intensity decreases due to the lower
interaction. Gordillo et al.104
simulated Ga and In nano-
particles’ plasmonic enhancement in both in-plane and
out-of-plane modes. According to the obtained data (Fig. 12),
for InNPs, the electric field enhancement increased in the in-
plane mode while it was opposite in the case of GaNPs.
DDA is promising for compositional and structural optimization.
For instance, one can easily investigate the effect of shell thickness or
composition on the optical characteristics of the final nanostructure.
This performance could be compared with FDTD, where more
computational cost is needed.
3-2 Photocatalytic activity, solar cell enhancement, and
sensing simulation
The enhanced activity of TiO2 nanostructures for photodegradation
of phenol in Ag nanoparticles’ presence was simulated using
DDA.105
According to the obtained data, the SPR band’s overlap
with the bandgap of TiO2 is the main mechanism for the observed
enhancement in the photocatalysis reaction. Siahpoush et al.106
have coupled the DDA with the thermal Green’s function to
simulate the temperature increase in a random assembly of AgNPs
under continuous-wave illumination. In another study by Avsar
et al.,107
a similar thermal simulation was performed for plasmonic
nanostructures on a dielectric substrate. Such simulations can
be used as a pre-design process for photothermal application.
In another study, Honda et al.108
investigated plasmonic nano-
particles’ role immobilized on a TiO2 substrate for photocatalytic
enhancement using the DDA method. The effect of the Ag@SiO2
core–shell nanostructure on the electroluminescence efficiency,
power efficiency, and power conversion efficiency of organic
optoelectronic devices was investigated by Kim and colleagues.109
The DDA results revealed that in the presence of the decorating
core–shell Ag@SiO2 NPs, a strong plasmon-coupling effect was
induced onto the Ag nanowires. This plasmon-coupling effect
resulted in a sizeable near-field enhancement, which improves
the light absorption efficiency of optoelectronic devices (such as
solar cells). McClure et al.110
used DDA to simulate the plasmonic
enhancement in Au–Fe2O3 modified electrodes for the photo-
electrochemical ethanol oxidation reaction. The enhanced ethanol
Fig. 11 The simulated extinction efficiency of gold nanotriangles with an
edge length of 120 nm in different configurations. (a): side by side,
(b): parallel along the prism axis, and (c): aligned bottom-to-bottom.
Reproduced with permission from ref. 101.
Review Journal of Materials Chemistry C
This journal is © The Royal Society of Chemistry 2021 J. Mater. Chem. C, 2021, 9, 9791–9819 | 9801
oxidation reaction by surface modification of fluorine-doped
SnO2 (FTO) using Au–Fe2O3 nanostructures can be attributed to
the near-field enhancements within or near the semiconductor
band edge. The role of plasmonic AuNPs in enhancing
up-conversion luminescence in the NaYF4@SiO2@Au structure
was modeled using the DDA approach.111
According to the
obtained data, the AuNPs might play a dual role; e.g., if the SPR
peak of AuNPs falls in the excitation region of up-conversion
NPs, the luminescence was enhanced while the luminescence
quenching can be seen if the SPR peak of AuNPs falls in the
emission region of up-conversion NPs. In another study, Dasri
used the DDA approach to simulate the effect of spherical, rod-
shaped, and cubic silver nanostructures embedded in the
organic solar cell.112
The role of geometry and the size of each
nanostructure in the absorption efficiency of organic solar cells
was carefully studied. Sartorio and colleagues113
studied the
optimal positioning of naphthalenethiol-capped AuNPs on the
power conversion efficiency of P3HT/PCBM organic solar cells
using DDA. The simulation suggests that the localized scattering
of aggregated naphthalenethiol-capped AuNPs leads to a four-
teen fold increase in the power conversion efficiency by
enhancing the charge transfer in the heterojunction of the donor
and acceptor. In another study, Coletta and Amendola114
investi-
gated how to increase the dynamic range of immuno-turbidimetric
assays by incorporation of plasmonic NPs into latex NPs. By the
help of DDA, it was found that an optimal size ratio between
plasmonic and latex NPs is needed to improve both sensitivity and
dynamic range of immuno-turbidimetric assays.
For a direct comparison with the FDTD method, it can be
concluded that one of the shortcomings of DDA is that
the actual array of nanoparticles (for example, in solar cell
configuration) cannot be simulated. It works robustly in
individual nanoparticles or two-particle systems and is usually
more efficient and faster than FDTD.
Available packages for DDA simulation. Most of the DDA
approach works used a freely available open-source software
called DDSCATr, based on FORTRAN.115
However, other
versions of DDSCAT have been developed, such as DDA with
surface interactions (called DDA-SI)116
or the vectorized version
of DDA-SI (DDA-SI-v)117
and DDA-SI-z.118
4 Finite-element method (FEM)
The FEM discretizes the object of interest into thousands of
tiny uniform or non-uniform mesh elements (Fig. 13) to
discretize the Helmholtz’ wave equations (eqn (8) and (9))
in space:
Fig. 12 Panel (a) shows the DDA calculated extinction spectra of Ga dimers as the interparticle distance increases from 2 to 40 nm. Panel (b) shows the
local electric field distribution in-plane and out-of-plane for Ga NPs. Panel (c) shows the representative illustration of an NP-enhanced plasmonic Ag NW
network and the electric field distribution of NWs and NWs decorated with Ag@SiO2 NPs using DDA. All figures are reproduced with permission from
ref. 103, 104 and 109.
Journal of Materials Chemistry C Review
9802 | J. Mater. Chem. C, 2021, 9, 9791–9819 This journal is © The Royal Society of Chemistry 2021
r2
E + k2
E = 0 (8)
r2
H + k2
H = 0 (9)
These equations are solved numerically for each element
to find the satisfying fields in the pre-defined boundary condi-
tions. The material parameters could be set via the wavevector
equation (eqn (10)):
k2
(r) = o2
e(r)m(r)/c2
(10)
The process is finished as the H and E field gradient between
adjacent elements reaches a specific criterion. The FEM
simulation can be performed in one, two, or three dimensions,
even with complex geometrical features. The mesh refinement
process is critical, especially in geometries with special features.
The main difference between the FEM and FDTD method is that
the FEM is capable of dividing the computational domain into
elements of any shape. This feature is highly desired in
simulating complex geometries where the FDTD method suffers
from the stair-casing problem due to the cubical nature of the
elements. The FEM could be exploited to calculate both near-
and far-field optical properties. Scattering and perfectly matched
layer (PML) boundary conditions are often used for single
nanostructures. The dielectric constants of materials can be
easily inserted as a file containing numbers in the (x, y) format
(such as the Lorentz–Drude dispersion model).
The potential applications of the FEM for the numerical
simulation of optical properties in plasmonic nanostructures
were discussed in the following sections.
4-1 Simulation of near-field and far-field optical properties
Most of the efforts with the FEM were implemented for the
simulation of waveguides in the field of nano-optics for the
determination of loss, dispersion, and electromagnetic
field distributions. However, the optical properties of single
or hybridized plasmonic nanostructures were also simulated
using the FEM. The main advantage of the FEM for this
application is that the model’s actual geometry can be used
for the simulation, and no simplification is needed.
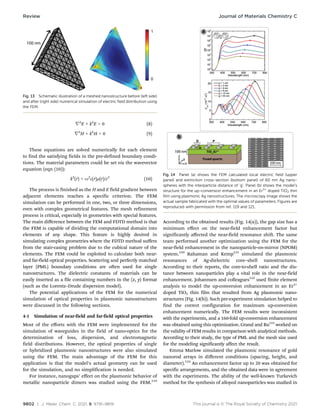
For instance, nanogaps’ effect on the plasmonic behavior of
metallic nanoparticle dimers was studied using the FEM.119
According to the obtained results (Fig. 14(a)), the gap size has a
minimum effect on the near-field enhancement factor but
significantly affected the near-field resonance shift. The same
team performed another optimization using the FEM for the
near-field enhancement in the nanoparticle-on-mirror (NPOM)
system.120
Rahaman and Kemp121
simulated the plasmonic
resonances of Ag-dielectric core–shell nanostructures.
According to their reports, the core-to-shell ratio and the dis-
tance between nanoparticles play a vital role in the near-field
enhancement. Johannsen and colleagues122
used finite element
analysis to model the up-conversion enhancement in an Er3+
doped TiO2 thin film that resulted from Ag plasmonic nano-
structures (Fig. 14(b)). Such pre-experiment simulation helped to
find the correct configuration for maximum up-conversion
enhancement numerically. The FEM results were inconsistent
with the experiments, and a 160-fold up-conversion enhancement
was obtained using this optimization. Grand and Ru123
worked on
the validity of FEM results in comparison with analytical methods.
According to their study, the type of PML and the mesh size used
for the modeling significantly affect the result.
Emma Marlow simulated the plasmonic resonance of gold
nanorod arrays in different conditions (spacing, height, and
diameter).124
An enhancement factor up to 20 was obtained for
specific arrangements, and the obtained data were in agreement
with the experiments. The ability of the well-known Turkevich
method for the synthesis of alloyed nanoparticles was studied in
Fig. 13 Schematic illustration of a meshed nanostructure before (left side)
and after (right side) numerical simulation of electric field distribution using
the FEM.
Fig. 14 Panel (a) shows the FEM calculated local electric field (upper
panel) and extinction cross-section (bottom panel) of 60 nm Ag nano-
spheres with the interparticle distance of ‘g’. Panel (b) shows the model’s
structure for the up-conversion enhancement in an Er3+
doped TiO2 thin
film using plasmonic Ag nanostructures. The microscopy image shows the
actual sample fabricated with the optimal values of parameters. Figures are
reproduced with permission from ref. 119 and 121.
Review Journal of Materials Chemistry C
This journal is © The Royal Society of Chemistry 2021 J. Mater. Chem. C, 2021, 9, 9791–9819 | 9803
depth by Blommaerts and colleagues using finite element
analysis.125
The FEM results revealed that the synthesized
Au–Ag alloyed NPs are not perfectly 50: 50 but rather an alloy
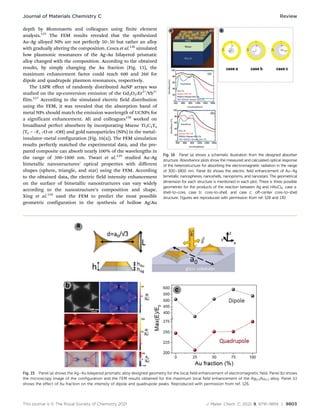
with gradually altering the composition. Cesca et al.126
simulated
how plasmonic resonances of the Ag–Au bilayered prismatic
alloy changed with the composition. According to the obtained
results, by simply changing the Au fraction (Fig. 15), the
maximum enhancement factor could reach 600 and 260 for
dipole and quadrupole plasmon resonances, respectively.
The LSPR effect of randomly distributed AuNP arrays was
studied on the up-conversion emission of the Gd2O3:Er3+
/Yb3+
film.127
According to the simulated electric field distribution
using the FEM, it was revealed that the absorption band of
metal NPs should match the emission wavelength of UCNPs for
a significant enhancement. Ali and colleagues128
worked on
broadband perfect absorbers by incorporating Mxene Ti3C2Tx
(Tx = –F, –O or –OH) and gold nanoparticles (NPs) in the metal–
insulator–metal configuration (Fig. 16(a)). The FEM simulation
results perfectly matched the experimental data, and the pre-
pared composite can absorb nearly 100% of the wavelengths in
the range of 300–1800 nm. Tiwari et al.129
studied Au–Ag
bimetallic nanostructures’ optical properties with different
shapes (sphere, triangle, and star) using the FEM. According
to the obtained data, the electric field intensity enhancement
on the surface of bimetallic nanostructures can vary widely
according to the nanostructure’s composition and shape.
Xing et al.130
used the FEM to predict the most possible
geometric configuration in the synthesis of hollow Ag/Au
Fig. 15 Panel (a) shows the Ag–Au bilayered prismatic alloy designed geometry for the local field enhancement of electromagnetic field. Panel (b) shows
the microscopy image of the configuration and the FEM results obtained for the maximum local field enhancement of the Ag0.5Au0.5 alloy. Panel (c)
shows the effect of Au fraction on the intensity of dipole and quadrupole peaks. Reproduced with permission from ref. 126.
Fig. 16 Panel (a) shows a schematic illustration from the designed absorber
structure. Absorbance plots show the measured and calculated optical response
of the heterostructure for absorbing the electromagnetic radiation in the range
of 300–1800 nm. Panel (b) shows the electric field enhancement of Au–Ag
bimetallic nanospheres, nanoshells, nanoprisms, and nanostars. The geometrical
dimension for each structure is mentioned in each plot. There is three possible
geometries for the products of the reaction between Ag and HAuCl4; case a:
shell-to-core, case b: core-to-shell, and case c: off-center core-to-shell
structure. Figures are reproduced with permission from ref. 128 and 130.
Journal of Materials Chemistry C Review
9804 | J. Mater. Chem. C, 2021, 9, 9791–9819 This journal is © The Royal Society of Chemistry 2021
nanoparticles among shell-to-core, core-to-shell, and off-center
core-to-shell structures (Fig. 16(b)). According to the obtained
results, the off-center core-to-shell NPs (case c) may lead to the
most significant electric field enhancement factor. A similar
simulation was performed for the Cu–Ag bimetallic system
using finite element analysis to investigate the effect of
different arrangements.131
Chen et al.132
used the finite element method for a
transparent screen design process using Au–Ag nanoparticles.
The optical parameters were first optimized numerically to
achieve strong scattering with green, red, and blue colors. After
the numerical investigation, the NPs with the determined size
and geometry were synthesized and used. The main positive
point of the FEM for simulation of scattering or absorption
cross-sections in comparison with other methods is the simple
and friendly graphical user interface (GUI). Also, any arbitrary
shape can be designed, meshed, and studied, which can be
frustrating in DDA.
4-2 Simulation of fluorescence and solar cell efficiency
enhancement
Seker et al.133
simulated the fluorescence enhancement from
Rh-6G fluorophore in the presence of Au-capped Si nanowires
using finite element analysis. Both experimental and theoretical
results showed a direct relationship between the fluorescence
enhancement and the distance between AuNPs and Rh-6G
fluorophore. Zhang et al.134
simulated GaAs plasmonic solar
cells’ quantum efficiency in the presence of Au and Ag spherical
and cylindrical nanostructures using the finite element method.
It was observed that spherical AgNPs are recommended for
photoelectrical enhancement, while cylindrical Ag and Au nano-
particles showed better performance for photothermal
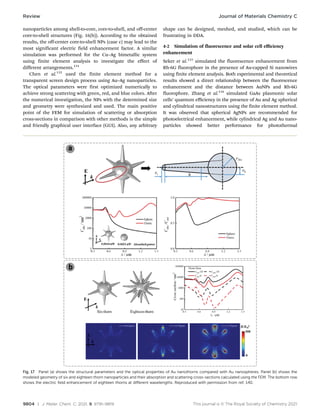
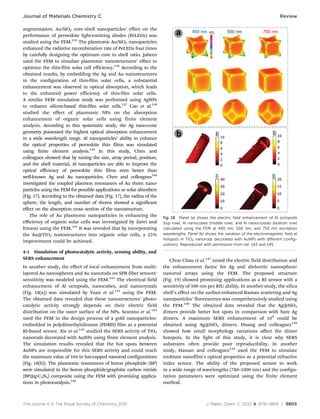
Fig. 17 Panel (a) shows the structural parameters and the optical properties of Au nanothorns compared with Au nanospheres. Panel (b) shows the
modeled geometry of six and eighteen thorn nanoparticles and their absorption and scattering cross-sections calculated using the FEM. The bottom row
shows the electric field enhancement of eighteen thorns at different wavelengths. Reproduced with permission from ref. 140.
Review Journal of Materials Chemistry C
This journal is © The Royal Society of Chemistry 2021 J. Mater. Chem. C, 2021, 9, 9791–9819 | 9805
augmentation. Au/SiO2 core–shell nanoparticles’ effect on the
performance of perovskite light-emitting diodes (PeLEDs) was
studied using the FEM.135
The plasmonic Au/SiO2 nanoparticles
enhanced the radiative recombination rate of PeLEDs four times
by carefully designing the optimum core to shell ratio. Jabeen
used the FEM to simulate plasmonic nanostructures’ effect to
optimize the thin-film solar cell efficiency.136
According to the
obtained results, by embedding the Ag and Au nanostructures
in the configuration of thin-film solar cells, a substantial
enhancement was observed in optical absorption, which leads
to the enhanced power efficiency of thin-film solar cells.
A similar FEM simulation study was performed using AgNPs
to enhance silicon-based thin-film solar cells.137
Cao et al.138
studied the effect of plasmonic NPs on the absorption
enhancement of organic solar cells using finite element
analysis. According to this systematic study, the Ag nano-cone
geometry possessed the highest optical absorption enhancement
in a wide wavelength range. Al nanoparticles’ ability to enhance
the optical properties of perovskite thin films was simulated
using finite element analysis.139
In this study, Chen and
colleagues showed that by tuning the size, array period, position,
and the shell material, Al nanoparticles are able to improve the
optical efficiency of perovskite thin films even better than
well-known Ag and Au nanoparticles. Chen and colleagues140
investigated the coupled plasmon resonances of Au thorn nano-
particles using the FEM for possible applications as solar absorbers
(Fig. 17). According to the obtained data (Fig. 17), the radius of the
sphere, the length, and number of thorns showed a significant
effect on the absorption cross section of the nanostructure.
The role of Au plasmonic nanoparticles in enhancing the
efficiency of organic solar cells was investigated by Zarei and
Emami using the FEM.141
It was revealed that by incorporating
the Au@TiO2 nanostructures into organic solar cells, a 25%
improvement could be achieved.
4-3 Simulation of photocatalytic activity, sensing ability, and
SERS enhancement
In another study, the effect of local enhancement from multi-
layered Au nanospheres and Au nanorods on SPR fiber sensors’
sensitivity was modeled using the FEM.142
The electrical field
enhancement of Al octopods, nanocubes, and nanocrystals
(Fig. 18(a)) was simulated by Yuan et al.143
using the FEM.
The obtained data revealed that these nanostructures’ photo-
catalytic activity strongly depends on their electric field
distribution on the outer surface of the NPs. Scarano et al.144
used the FEM in the design process of a gold nanoparticles-
embedded in polydimethylsiloxane (PDMS) film as a potential
RI-based sensor. Xie et al.145
studied the SERS activity of TiO2
nanorods decorated with AuNPs using finite element analysis.
The simulation results revealed that the hot spots between
AuNPs are responsible for this SERS activity and could reach
the maximum value of 104 in hat-capped nanorod configurations
(Fig. 18(b)). The plasmonic resonances of boron phosphide (BP)
were simulated in the boron phosphide/graphitic carbon nitride
(BP@g-C3N4) composite using the FEM with promising applica-
tions in photocatalysis.146
Chou Chau et al.147
tuned the electric field distribution and
the enhancement factor for Ag and dielectric nanosphere/
nanorod arrays using the FEM. The proposed structure
(Fig. 19) showed promising applications as a RI sensor with a
sensitivity of 500 nm per RIU ability. In another study, the silica
shell’s effect on the surface-enhanced Raman scattering and Ag
nanoparticles’ fluorescence was comprehensively studied using
the FEM.148
The obtained data revealed that the Ag@SiO2
dimers provide better hot spots in comparison with bare Ag
dimers. A maximum SERS enhancement of 109
could be
obtained using Ag@SiO2 dimers. Huang and colleagues149
showed how small morphology variations affect the dimer
hotspots. In the light of this study, it is clear why SERS
substrates often provide poor reproducibility. In another
study, Hassan and colleagues150
used the FEM to simulate
niobium nanofilm’s optical properties as a potential refractive
index sensor. The ability of the proposed sensor to work
in a wide range of wavelengths (780–1000 nm) and the configu-
ration parameters were optimized using the finite element
method.
Fig. 18 Panel (a) shows the electric field enhancement of Al octopods
(top row), Al nanocubes (middle row), and Al nanocrystals (bottom row)
calculated using the FEM at 450 nm, 550 nm, and 750 nm excitation
wavelengths. Panel (b) shows the variation of the electromagnetic field at
hotspots in TiO2 nanorods decorated with AuNPs with different config-
urations. Reproduced with permission from ref. 143 and 145.
Journal of Materials Chemistry C Review
9806 | J. Mater. Chem. C, 2021, 9, 9791–9819 This journal is © The Royal Society of Chemistry 2021
4-4 Simulation of catalysis activity and bio-related application
In another study, plasmonic–magnetic hybrid nanostructures
were synthesized and studied for possible applications as
nanoheaters.151
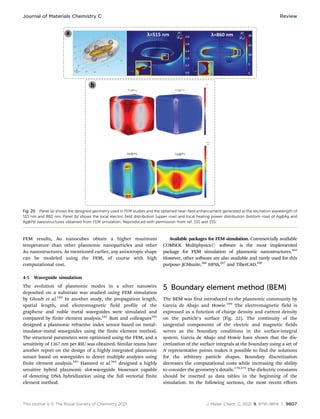
The near-field optical properties of hybrid
nanostructures were simulated using the FEM, in which a max-
imum enhancement factor of 20 was observed (Fig. 20(a)). The
enhanced electric field resulting from plasmonic nanostructures
conjugated with magnetic dipoles showed synergistic effects on
the hybrid structure’s amount of heat dissipated.
Manrique-Bedoya et al. simulated the highly localized heating
in Au nanostructures for plasmonic photothermal therapy
(PPTT) applications.152
It was observed that the plasmonic
excitation of Au nanorods increased the local temperature up
to 100 1C while 37 1C can be obtained using Au spherical NPs.
A similar simulation was performed by Elhoussaine et al.153
for
the PPTT application of gold nanorods. Self-assembled 2D
structures from Ag and AuNPs were evaluated for their tunable
localized surface plasmon resonance using finite element
analysis.154
The LSPR of these structures can be tuned from
the visible to the mid-IR regions. Xu et al.155
modeled the Ag@Pd
core–shell nanocubes as a potential catalyst for efficient
ammonia borane hydrolysis. The Pd shell’s effect with different
thicknesses on the plasmonic property and charge density of the
plasmonic nanostructure was thoroughly investigated using the
FEM (Fig. 20(b)).
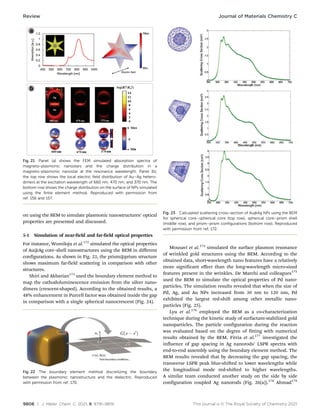
In another study, the simulation of magneto-plasmonic
nanostars with possible applications in image-guided and
NIR-triggered drug delivery was conducted using the FEM.156
A unique multipolar surface plasmon mode of the MNP@Au
nanostars was demonstrated from simulation results (Fig. 21(a)).
In another study, Debu and colleagues157
successfully modeled
the local electric fields and 3D surface charge distributions at
near-field resonance peaks of plasmonic hetero-dimmers. It was
also inferred that the gap size plays a vital role in the intensity of
plasmon coupling (Fig. 21(b)).
Chen et al.158
successfully controlled the local heating of
plasmonic AuNPs using a finite element approach. Different
configurations of nanoparticles and light sources were investigated,
and the multi-layered Au shell configuration was suggested for
possible use in photothermal applications. Chen et al.159
numerically investigated the light absorption and heating of
Ag, Au, Cu, and Al plasmonic nanoparticles. According to the
Fig. 19 Panel (a) shows the nanosphere/nanorod plasmonic nanostructures’ geometrical parameters designed for a refractive index sensor. Panel (b)
shows the electric field intensity distribution in x–y and y–z planes using 670 nm excitation wavelength. Reproduced with permission from ref. 147.
Review Journal of Materials Chemistry C
This journal is © The Royal Society of Chemistry 2021 J. Mater. Chem. C, 2021, 9, 9791–9819 | 9807
FEM results, Au nanocubes obtain a higher maximum
temperature than other plasmonic nanoparticles and other
Au nanostructures. As mentioned earlier, any anisotropic shape
can be modeled using the FEM, of course with high
computational cost.
4-5 Waveguide simulation
The evolution of plasmonic modes in a silver nanowire
deposited on a substrate was studied using FEM simulation
by Ghosh et al.160
In another study, the propagation length,
spatial length, and electromagnetic field profile of the
graphene and noble metal waveguides were simulated and
compared by finite element analysis.161
Butt and colleagues162
designed a plasmonic refractive index sensor based on metal–
insulator–metal waveguides using the finite element method.
The structural parameters were optimized using the FEM, and a
sensitivity of 1367 nm per RIU was obtained. Similar teams have
another report on the design of a highly integrated plasmonic
sensor based on waveguides to detect multiple analytes using
finite element analysis.163
Hameed et al.164
designed a highly
sensitive hybrid plasmonic slot-waveguide biosensor capable
of detecting DNA hybridization using the full vectorial finite
element method.
Available packages for FEM simulation. Commercially available
COMSOL Multiphysicsr software is the most implemented
package for FEM simulation of plasmonic nanostructures.165
However, other software are also available and rarely used for this
purpose: JCMsuite,166
HFSS,167
and TiberCAD.168
5 Boundary element method (BEM)
The BEM was first introduced to the plasmonic community by
Garcia de Abajo and Howie.169
The electromagnetic field is
expressed as a function of charge density and current density
on the particle’s surface (Fig. 22). The continuity of the
tangential components of the electric and magnetic fields
serves as the boundary conditions in the surface-integral
system. Garcia de Abajo and Howie have shown that the dis-
cretization of the surface integrals at the boundary using a set of
N representative points makes it possible to find the solutions
for the arbitrary particle shapes. Boundary discretization
decreases the computational costs while increasing the ability
to consider the geometry’s details.170,171
The dielectric constants
should be inserted as data tables in the beginning of the
simulation. In the following sections, the most recent efforts
Fig. 20 Panel (a) shows the designed geometry used in FEM studies and the obtained near-field enhancement generated at the excitation wavelength of
515 nm and 860 nm. Panel (b) shows the local electric field distribution (upper row) and local heating power distribution (bottom row) of Ag@Ag and
Ag@Pd nanostructures obtained from FEM simulation. Reproduced with permission from ref. 151 and 155.
Journal of Materials Chemistry C Review
9808 | J. Mater. Chem. C, 2021, 9, 9791–9819 This journal is © The Royal Society of Chemistry 2021
on using the BEM to simulate plasmonic nanostructures’ optical
properties are presented and discussed.
5-1 Simulation of near-field and far-field optical properties
For instance, Womiloju et al.172
simulated the optical properties
of Au@Ag core–shell nanostructures using the BEM in different
configurations. As shown in Fig. 23, the prism@prism structure
shows maximum far-field scattering in comparison with other
structures.
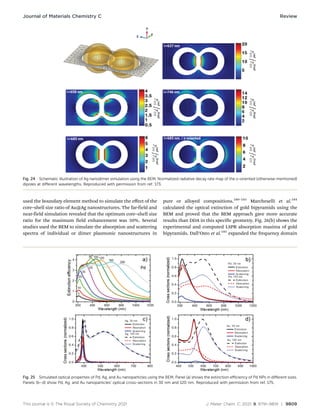
Shiri and Akbarian173
used the boundary element method to
map the cathodoluminescence emission from the silver nano-
dimers (crescent-shaped). According to the obtained results, a
48% enhancement in Purcell factor was obtained inside the gap
in comparison with a single spherical nanocrescent (Fig. 24).
Mousavi et al.174
simulated the surface plasmon resonance
of wrinkled gold structures using the BEM. According to the
obtained data, short-wavelength nano features have a relatively
more significant effect than the long-wavelength micro-sized
features present in the wrinkles. De Marchi and colleagues175
used the BEM to simulate the optical properties of Pd nano-
particles. The simulation results revealed that when the size of
Pd, Ag, and Au NPs increased from 30 nm to 120 nm, Pd
exhibited the largest red-shift among other metallic nano-
particles (Fig. 25).
Lyu et al.176
employed the BEM as a co-characterization
technique during the kinetic study of surfactant-stabilized gold
nanoparticles. The particle configuration during the reaction
was evaluated based on the degree of fitting with numerical
results obtained by the BEM. Fitria et al.177
investigated the
influence of gap spacing in Ag nanorods’ LSPR spectra with
end-to-end assembly using the boundary element method. The
BEM results revealed that by decreasing the gap spacing, the
transverse LSPR peak blue-shifted to lower wavelengths while
the longitudinal mode red-shifted to higher wavelengths.
A similar team conducted another study on the side by side
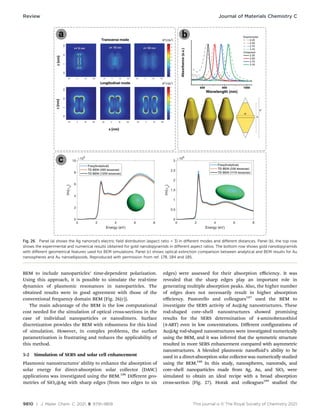
configuration coupled Ag nanorods (Fig. 26(a)).178
Ahmad179
Fig. 21 Panel (a) shows the FEM simulated absorption spectra of
magneto-plasmonic nanostars and the charge distribution in a
magneto-plasmonic nanostar at the resonance wavelength. Panel (b),
the top row shows the local electric field distribution of Au–Ag hetero-
dimers at the excitation wavelength of 660 nm, 470 nm, and 370 nm. The
bottom row shows the charge distribution on the surface of NPs simulated
using the finite element method. Reproduced with permission from
ref. 156 and 157.
Fig. 22 The boundary element method discretizing the boundary
between the plasmonic nanostructure and the dielectric. Reproduced
with permission from ref. 170.
Fig. 23 Calculated scattering cross-section of Au@Ag NPs using the BEM
for spherical core–spherical core (top row), spherical core–prism shell
(middle row), and prism–prism configurations (bottom row). Reproduced
with permission from ref. 172.
Review Journal of Materials Chemistry C
This journal is © The Royal Society of Chemistry 2021 J. Mater. Chem. C, 2021, 9, 9791–9819 | 9809
used the boundary element method to simulate the effect of the
core–shell size ratio of Au@Ag nanostructures. The far-field and
near-field simulation revealed that the optimum core–shell size
ratio for the maximum field enhancement was 50%. Several
studies used the BEM to simulate the absorption and scattering
spectra of individual or dimer plasmonic nanostructures in
pure or alloyed compositions.180–183
Marcheselli et al.184
calculated the optical extinction of gold bipyramids using the
BEM and proved that the BEM approach gave more accurate
results than DDA in this specific geometry. Fig. 26(b) shows the
experimental and computed LSPR absorption maxima of gold
bipyramids. Dall’Osto et al.185
expanded the frequency domain
Fig. 24 Schematic illustration of Ag nanodimer simulation using the BEM. Normalized radiative decay rate map of the x-oriented (otherwise mentioned)
dipoles at different wavelengths. Reproduced with permission from ref. 173.
Fig. 25 Simulated optical properties of Pd, Ag, and Au nanoparticles using the BEM. Panel (a) shows the extinction efficiency of Pd NPs in different sizes.
Panels (b–d) show Pd, Ag, and Au nanoparticles’ optical cross-sections in 30 nm and 120 nm. Reproduced with permission from ref. 175.
Journal of Materials Chemistry C Review
9810 | J. Mater. Chem. C, 2021, 9, 9791–9819 This journal is © The Royal Society of Chemistry 2021
BEM to include nanoparticles’ time-dependent polarization.
Using this approach, it is possible to simulate the real-time
dynamics of plasmonic resonances in nanoparticles. The
obtained results were in good agreement with those of the
conventional frequency domain BEM (Fig. 26(c)).
The main advantage of the BEM is the low computational
cost needed for the simulation of optical cross-sections in the
case of individual nanoparticles or nanodimers. Surface
discretization provides the BEM with robustness for this kind
of simulation. However, in complex problems, the surface
parametrization is frustrating and reduces the applicability of
this method.
5-2 Simulation of SERS and solar cell enhancement
Plasmonic nanostructures’ ability to enhance the absorption of
solar energy for direct-absorption solar collector (DASC)
applications was investigated using the BEM.186
Different geo-
metries of SiO2@Ag with sharp edges (from two edges to six
edges) were assessed for their absorption efficiency. It was
revealed that the sharp edges play an important role in
generating multiple absorption peaks. Also, the higher number
of edges does not necessarily result in higher absorption
efficiency. Pastorello and colleagues187
used the BEM to
investigate the SERS activity of Au@Ag nanostructures. These
rod-shaped core–shell nanostructures showed promising
results for the SERS determination of 4-aminobenzothiol
(4-ABT) even in low concentrations. Different configurations of
Au@Ag rod-shaped nanostructures were investigated numerically
using the BEM, and it was inferred that the symmetric structure
resulted in more SERS enhancement compared with asymmetric
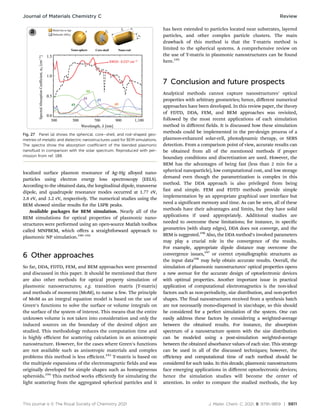
nanostructures. A blended plasmonic nanofluid’s ability to be
used in a direct-absorption solar collector was numerically studied
using the BEM.188
In this study, nanospheres, nanorods, and
core–shell nanoparticles made from Ag, Au, and SiO2 were
simulated to obtain an ideal recipe with a broad absorption
cross-section (Fig. 27). Horak and colleagues189
studied the
Fig. 26 Panel (a) shows the Ag nanorod’s electric field distribution (aspect ratio = 3) in different modes and different distances. Panel (b), the top row
shows the experimental and numerical results obtained for gold nanobipyramids in different aspect ratios. The bottom row shows gold nanobipyramids
with different geometrical features used for BEM simulations. Panel (c) shows optical extinction comparison between analytical and BEM results for Au
nanospheres and Au nanoellipsoids. Reproduced with permission from ref. 178, 184 and 185.
Review Journal of Materials Chemistry C
This journal is © The Royal Society of Chemistry 2021 J. Mater. Chem. C, 2021, 9, 9791–9819 | 9811
localized surface plasmon resonance of Ag–Hg alloyed nano-
particles using electron energy loss spectroscopy (EELS).
According to the obtained data, the longitudinal dipole, transverse
dipole, and quadrupole resonance modes occurred at 1.77 eV,
2.8 eV, and 3.2 eV, respectively. The numerical studies using the
BEM showed similar results for the LSPR peaks.
Available packages for BEM simulation. Nearly all of the
BEM simulations for optical properties of plasmonic nano-
structures were performed using an open-source Matlab toolbox
called MNPBEM, which offers a straightforward approach to
plasmonic NP simulation.190–192
6 Other approaches
So far, DDA, FDTD, FEM, and BEM approaches were presented
and discussed in this paper. It should be mentioned that there
are also other methods for optical property simulation of
plasmonic nanostructures; e.g. transition matrix (T-matrix)
and methods of moments (MoM), to name a few. The principle
of MoM as an integral equation model is based on the use of
Green’s functions to solve the surface or volume integrals on
the surface of the system of interest. This means that the entire
unknown volume is not taken into consideration and only the
induced sources on the boundary of the desired object are
studied. This methodology reduces the computation time and
is highly efficient for scattering calculation in an anisotropic
nanostructure. However, for the cases where Green’s functions
are not available such as anisotropic materials and complex
problems this method is less efficient.193
T-matrix is based on
the multipole expansions of the electromagnetic fields and was
originally developed for simple shapes such as homogeneous
spheroids.194
This method works efficiently for simulating the
light scattering from the aggregated spherical particles and it
has been extended to particles located near substrates, layered
particles, and other complex particle clusters. The main
drawback of this method is that the T-matrix method is
limited to the spherical systems. A comprehensive review on
the use of T-matrix in plasmonic nanostructures can be found
here.195
7 Conclusion and future prospects
Analytical methods cannot capture nanostructures’ optical
properties with arbitrary geometries; hence, different numerical
approaches have been developed. In this review paper, the theory
of FDTD, DDA, FEM, and BEM approaches was revisited,
followed by the most recent applications of each simulation
method in different fields. It is discussed how these simulation
methods could be implemented in the pre-design process of a
plasmon-enhanced solar-cell, photodynamic therapy, or SERS
detection. From a comparison point of view, accurate results can
be obtained from all of the mentioned methods if proper
boundary conditions and discretization are used. However, the
BEM has the advantages of being fast (less than 2 min for a
spherical nanoparticle), low computational cost, and low storage
demand even though the parametrization is complex in this
method. The DDA approach is also privileged from being
fast and simple. FEM and FDTD methods provide simple
implementation by an appropriate graphical user interface but
need a significant memory and time. As can be seen, all of these
methods have their advantages and limits, but they have solid
applications if used appropriately. Additional studies are
needed to overcome these limitations; for instance, in specific
geometries (with sharp edges), DDA does not converge, and the
BEM is suggested.196
Also, the DDA method’s involved parameters
may play a crucial role in the convergence of the results.
For example, appropriate dipole distance may overcome the
convergence issues,197
or correct crystallographic structures as
the input data198
may help obtain accurate results. Overall, the
simulation of plasmonic nanostructures’ optical properties opens
a new avenue for the accurate design of optoelectronic devices
with optimal properties. Another important issue in practical
application of computational electromagnetics is the non-ideal
factors such as non-periodicity, size distribution, and non-perfect
shapes. The final nanostructures received from a synthesis batch
are not necessarily mono-dispersed in size/shape, so this should
be considered for a perfect simulation of the system. One can
easily address these factors by considering a weighted-average
between the obtained results. For instance, the absorption
spectrum of a nanostructure system with the size distribution
can be modeled using a post-simulation weighted-average
between the obtained absorbance values of each size. This strategy
can be used in all of the discussed techniques; however, the
efficiency and computational time of each method should be
considered for such tasks. In this decade, plasmonic nanostructures
face emerging applications in different optoelectronic devices;
hence the simulation studies will become the center of
attention. In order to compare the studied methods, the key
Fig. 27 Panel (a) shows the spherical, core–shell, and rod-shaped geo-
metries of metallic and dielectric nanostructures used for BEM simulations.
The spectra show the absorption coefficient of the blended plasmonic
nanofluid in comparison with the solar spectrum. Reproduced with per-
mission from ref. 188.
Journal of Materials Chemistry C Review
9812 | J. Mater. Chem. C, 2021, 9, 9791–9819 This journal is © The Royal Society of Chemistry 2021
advantages and disadvantages of each method are summarized
in Table 2.
Conflicts of interest
There are no conflicts to declare.
Acknowledgements
Amirmostafa Amirjani is thankful to Iran National Elites
Foundation for the received fund. The Iran National Science
Foundation (INSF) general support is gratefully acknowledged.
The authors wish to dedicate this paper to Martyr Hasan
Bagheri.
References
1 E. Frankel, Corpuscular Optics and the Wave Theory of
Light: The Science and Politics of a Revolution in Physics,
Social Studies of Science, 2016, 6(2), 141–184, DOI: 10.1177/
030631277600600201.
2 G. Jaeger, Double-Slit Experiment (or Two-Slit Experiment),
Compendium Quantum Phys., 2009, pp. 174–178., DOI:
10.1007/978-3-540-70626-7_56.
3 A. Amirjani and D. F. Haghshenas, Facile and on-line
colorimetric detection of Hg(2+) based on localized
surface plasmon resonance (LSPR) of Ag nanotriangles,
Talanta, 2019, 192, 418–423, DOI: 10.1016/j.talanta.
2018.09.079.
4 A. Amirjani and D. H. Fatmehsari, Colorimetric detection
of ammonia using smartphones based on localized surface
plasmon resonance of silver nanoparticles, Talanta, 2018,
176, 242–246, DOI: 10.1016/j.talanta.2017.08.022.
5 A. Amirjani, et al., Colorimetric determination of Timolol
concentration based on localized surface plasmon reso-
nance of silver nanoparticles, Nanotechnology, 2016,
27(37), 375503, DOI: 10.1088/0957-4484/27/37/375503.
6 A. Amirjani, et al., Label-free surface plasmon resonance
detection of hydrogen peroxide; a bio-inspired approach,
Sens. Actuators, B, 2016, 227, 373–382, DOI: 10.1016/
j.snb.2015.12.062.
7 N. Namazi Koochak, et al., Detection of Cobalt Ion Based
on Surface Plasmon Resonance of L-Cysteine Functiona-
lized Silver Nanotriangles, Plasmonics, 2020, 16(2),
315–322, DOI: 10.1007/s11468-020-01289-2.
8 S. Daneshvar e Asl and S. K. Sadrnezhaad, Gold@Silver@Gold
Core Double-Shell Nanoparticles: Synthesis and Aggregation-
Enhanced Two-Photon Photoluminescence Evaluation, Plasmo-
nics, 2019, 15(2), 409–416, DOI: 10.1007/s11468-019-01041-5.
9 Y.-C. Chen, et al., Photocatalytic enhancement of hydrogen
production in water splitting under simulated solar light
by band gap engineering and localized surface plasmon
resonance of ZnxCd1xS nanowires decorated by Au nano-
particles, Nano Energy, 2020, 67, 104225, DOI: 10.1016/
j.nanoen.2019.104225.
10 X. L. Zhou, et al., Surface Plasmon Resonance Microscopy:
From Single-Molecule Sensing to Single-Cell Imaging,
Angew. Chem., Int. Ed., 2020, 59(5), 1776–1785, DOI:
10.1002/anie.201908806.
11 A. Amirjani, N. N. Koochak and D. F. Haghshenas, Synth-
esis of silver nanotriangles with tunable edge length: a
promising candidate for light harvesting purposes within
visible and near–infrared ranges, Mater. Res. Express, 2018,
6(3), 036204, DOI: 10.1088/2053-1591/aaf624.
12 A. Amirjani, et al., (Invited) Plasmon Induced Near-
infrared Fluorescence Enhancement of Single-walled
Carbon Nanotubes, ECS Meeting Abstracts, 2020, MA2020-
01(8), 743, DOI: 10.1149/MA2020-018743mtgabs.
13 R. Collette, et al., Near field excited state imaging via stimu-
lated electron energy gain spectroscopy of localized surface
plasmon resonances in plasmonic nanorod antennas, Sci.
Rep., 2020, 10(1), 12537, DOI: 10.1038/s41598-020-69066-z.
14 M. Bockova, et al., Advances in Surface Plasmon Reso-
nance Imaging and Microscopy and Their Biological Appli-
cations, Annu. Rev. Anal. Chem., 2019, 12(1), 151–176, DOI:
10.1146/annurev-anchem-061318-115106.
15 C. Liu, et al., A critical review of advances in surface
plasmon resonance imaging sensitivity, TrAC, Trends Anal.
Chem., 2017, 97, 354–362, DOI: 10.1016/j.trac.2017.10.001.
Table 2 A comprehensive summary of the advantages and disadvantages of the discussed methods for the simulation of plasmonic nanoparticles’
optical properties
Method Computation time for a simple spherical system Advantages Disadvantages
FDTD Long – more than 180 minutes to cover
all of the visible region wavelengths
 More adapted to spectroscopic studies  The wavefront suffers from
‘stair casing’
 Useful for nonlinear materials and broad-
band simulations
 Time-consuming when the
mesh is dense
 Useful for any arbitrary shaped structure
FEM Long – the time highly depends on the mesh size but
usually more than 2 minutes for each wavelength
 Useful for evaluating the scattered field
distribution of any arbitrary shaped structure
 The whole volume is
discretized
 Time-consuming
BEM Rapid – only the boundary is discretized  Low computational and storage demand  Complex parameterization of
the boundary elements
DDA Moderate – the time highly depends on the number of
dipoles but usually below 1 min for each wavelength
 Useful for any arbitrary shaped structure  Not convenient to simulate
periodic arrays of particles
 Unable to simulate high-aspect
ratio or elongated structures
Review Journal of Materials Chemistry C
This journal is © The Royal Society of Chemistry 2021 J. Mater. Chem. C, 2021, 9, 9791–9819 | 9813
16 A. Amirjani, N. N. Koochak and D. F. Haghshenas, Inves-
tigating the Shape and Size-Dependent Optical Properties
of Silver Nanostructures Using UV-vis Spectroscopy,
J. Chem. Educ., 2019, 96(11), 2584–2589, DOI: 10.1021/
acs.jchemed.9b00559.
17 A. Amirjani and D. F. Haghshenas, Ag nanostructures as
the surface plasmon resonance (SPR)-based sensors: a
mechanistic study with an emphasis on heavy metallic
ions detection, Sens. Actuators, B, 2018, 273, 1768–1779,
DOI: 10.1016/j.snb.2018.07.089.
18 A. Amirjani and E. Rahbarimehr, Recent advances in
functionalization of plasmonic nanostructures for optical
sensing, Mikrochim. Acta, 2021, 188(2), 57, DOI: 10.1007/
s00604-021-04714-3.
19 A. Amirjani, F. Firouzi and D. F. Haghshenas, Predicting
the Size of Silver Nanoparticles from Their Optical Proper-
ties, Plasmonics, 2020, 15(4), 1077–1082, DOI: 10.1007/
s11468-020-01121-x.
20 A. Trugler, Optical Properties of Metallic Nanoparticles,
Springer Ser. Mater. Sci., 2016, DOI: 10.1007/978-3-319-
25074-8.
21 Y. Kane, Numerical solution of initial boundary value
problems involving Maxwell’s equations in isotropic
media, IEEE Trans. Antennas Propag., 1966, 14(3),
302–307, DOI: 10.1109/tap.1966.1138693.
22 C. Tira, et al., Finite-Difference Time-Domain (FDTD)
design of gold nanoparticle chains with specific surface
plasmon resonance, J. Mol. Struct., 2014, 1072, 137–143,
DOI: 10.1016/j.molstruc.2014.04.086.
23 Y. Wu and P. Nordlander, Finite-Difference Time-Domain
Modeling of the Optical Properties of Nanoparticles near
Dielectric Substrates, J. Phys. Chem. C, 2009, 114(16),
7302–7307, DOI: 10.1021/jp908980d.
24 V. Devaraj, J. M. Lee and J. W. Oh, Distinguishable
Plasmonic Nanoparticle and Gap Mode Properties in a
Silver Nanoparticle on a Gold Film System Using Three-
Dimensional FDTD Simulations, Nanomaterials, 2018,
8(8), 582, DOI: 10.3390/nano8080582.
25 G.-Y. Yao, Q.-L. Liu and Z.-Y. Zhao, Studied Localized
Surface Plasmon Resonance Effects of Au Nanoparticles
on TiO2 by FDTD Simulations, Catalysts, 2018, 8(6), 236,
DOI: 10.3390/catal8060236.
26 R. J. Hermann and M. J. Gordon, Quantitative comparison of
plasmon resonances and field enhancements of near-field
optical antennae using FDTD simulations, Opt. Express, 2018,
26(21), 27668–27682, DOI: 10.1364/OE.26.027668.
27 Z. Mu, et al., FDTD modeling of photonic crystal-
incorporated gold nanoparticles for enhancing the loca-
lized electric field, J. Mater. Chem. C, 2017, 5(37),
9540–9544, DOI: 10.1039/c7tc03668j.
28 V. S. Gerasimov, et al., Engineering mode hybridization in
regular arrays of plasmonic nanoparticles embedded in 1D
photonic crystal, J. Quant. Spectrosc. Radiat. Transfer, 2019,
224, 303–308, DOI: 10.1016/j.jqsrt.2018.11.028.
29 L. Zhang, FDTD Algorithm for Plasmonic Nanoparticles with
Spatial Dispersion, MSc thesis, Ohio State University, 2016.
30 A. S. M. Mohsin and M. B. Salim, Probing the Plasmon
Coupling, Quantum Yield, and Effects of Tip Geometry of
Gold Nanoparticle Using Analytical Models and FDTD
Simulation, IEEE Photonics J., 2018, 10(3), 1, DOI:
10.1109/jphot.2018.2825435.
31 A. Gapska, et al., Au-Si plasmonic platforms: synthesis,
structure and FDTD simulations, Beilstein J. Nanotechnol.,
2018, 9, 2599–2608, DOI: 10.3762/bjnano.9.241.
32 Y. Chen, et al., FDTD simulation of the optical properties
for a gold nanoparticle-over-nanosheet hybrid structure,
Curr. Appl. Phys., 2020, 20(3), 391–399, DOI: 10.1016/
j.cap.2019.12.005.
33 J. Abed, et al., Investigation of Broadband Surface Plasmon
Resonance of Dewetted Au Structures on TiO2 by Aperture-
Probe SNOM and FDTD Simulations, Plasmonics, 2018,
14(1), 205–218, DOI: 10.1007/s11468-018-0794-3.
34 A. P. Betancourt, et al., Scalable and stable silica-coated
silver nanoparticles, produced by electron beam evapora-
tion and rapid thermal annealing, for plasmon-enhanced
photocatalysis, Catal. Commun., 2021, 149, 106213, DOI:
10.1016/j.catcom.2020.106213.
35 S. Goetz, et al., Ultrathin sputter-deposited plasmonic
silver nanostructures, Nanoscale Adv., 2020, 2(2), 869–877,
DOI: 10.1039/c9na00762h.
36 I. I. Kon, A. Y. Zyubin and I. G. Samusev, FDTD simulations
of local plasmonic fields for gold surfaces fabricated by
femtosecond laser ablation method, 2020, vol. 11554, DOI:
10.1117/12.2575387.
37 Y. Gao, et al., Plasmon-Enhanced Perovskite Solar Cells
with Efficiency Beyond 21%: The Asynchronous Synergistic
Effect of Water and Gold Nanorods, ChemPlusChem, 2021,
86(2), 291–297, DOI: 10.1002/cplu.202000792.
38 L. Feng, et al., Recent Advances of Plasmonic Organic Solar
Cells: Photophysical Investigations, Polymers, 2018,
10(2), 123, DOI: 10.3390/polym10020123.
39 G. Singh and S. S. Verma, Enhanced efficiency of thin film
GaAs solar cells with plasmonic metal nanoparticles,
Energy Sources, Part A, 2017, 40(2), 155–162, DOI:
10.1080/15567036.2017.1407840.
40 G. Singh and S. S. Verma, Design and analysis of thin film
GaAs solar cells using silver nanoparticle plasmons, Photo-
nics and Nanostructures: Fundamentals and Applications,
2019, 37, 100731, DOI: 10.1016/j.photonics.2019.100731.
41 J. D. A. H. K. Rouf, Absorption Enhancement in Thin-Film
Silicon Solar Cell using Plasmonic Nanoparticles, 2018, pp.
1–4, DOI: 10.1109/IC4ME2.2018.8465486.
42 A. A. Tabrizi and A. Pahlavan, Efficiency improvement of a
silicon-based thin-film solar cell using plasmonic silver
nanoparticles and an antireflective layer, Opt. Commun.,
2020, 454, 124437, DOI: 10.1016/j.optcom.2019.124437.
43 S. Sreeja, S. Prabhakaran and B. Pesala, Efficiency Enhance-
ment of Betanin Dye-Sensitized Solar Cells Using Plasmon-
Enhanced Silver Nanoparticles, Advances in Energy Research,
2020, vol. 1, DOI: 10.1007/978-981-15-2666-4_2.
44 S. Sreeja and B. Pesala, Plasmonic enhancement of beta-
nin–lawsone co-sensitized solar cells via tailored bimodal
Journal of Materials Chemistry C Review
9814 | J. Mater. Chem. C, 2021, 9, 9791–9819 This journal is © The Royal Society of Chemistry 2021
size distribution of silver nanoparticles, Sci. Rep., 2020,
10(1), 8240, DOI: 10.1038/s41598-020-65236-1.
45 I. Vangelidis, et al., Plasmonic Organic Photovoltaics:
Unraveling Plasmonic Enhancement for Realistic Cell
Geometries, ACS Photonics, 2018, 5(4), 1440–1452, DOI:
10.1021/acsphotonics.7b01390.
46 S. Sreeja and B. Pesala, Efficiency Enhancement of Beta-
nin–Chlorophyll Cosensitized Natural Pigment Solar Cells
Using Plasmonic Effect of Silver Nanoparticles, IEEE
J. Photovolt., 2020, 10(1), 124–134, DOI: 10.1109/
jphotov.2019.2953399.
47 A. Ciesielski, K. M. Czajkowski and D. Switlik, Silver
nanoparticles in organic photovoltaics: Finite size effects
and optimal concentration, Sol. Energy, 2019, 184,
477–488, DOI: 10.1016/j.solener.2019.04.015.
48 S. Royanian, A. Abdolahzadeh Ziabari and R. Yousefi,
Efficiency Enhancement of Ultra-thin CIGS Solar Cells
Using Bandgap Grading and Embedding Au Plasmonic
Nanoparticles, Plasmonics, 2020, 15(4), 1173–1182, DOI:
10.1007/s11468-020-01138-2.
49 R. Irandoost and S. Soleimani-Amiri, Design and analysis
of high efficiency perovskite solar cell with ZnO nanorods
and plasmonic nanoparticles, Optik, 2020, 202, 163598,
DOI: 10.1016/j.ijleo.2019.163598.
50 R. Rastogi, et al., Analyte Co-localization at Electromag-
netic Gap Hot-Spots for Highly Sensitive (Bio)molecular
Detection by Plasmon Enhanced Spectroscopies, ACS Appl.
Mater. Interfaces, 2021, 13(7), 9113–9121, DOI: 10.1021/
acsami.0c17929.
51 F. Bertó-Roselló, et al., 3D-FDTD modelling of optical
biosensing based on gold-coated nanoporous anodic alu-
mina, Results Phys., 2018, 11, 1008–1014, DOI: 10.1016/
j.rinp.2018.10.067.
52 T. S. Sheena, et al., Sensitive and label-free shell isolated Ag
NPs@Si architecture based SERS active substrate: FDTD
analysis and in-situ cellular DNA detection, Appl. Surf. Sci.,
2020, 515, 145955, DOI: 10.1016/j.apsusc.2020.145955.
53 X. Luo, et al., Plasmonic Gold Nanohole Array for Surface-
Enhanced Raman Scattering Detection of DNA Methyla-
tion, ACS Sens., 2019, 4(6), 1534–1542, DOI: 10.1021/
acssensors.9b00008.
54 M. Kahraman, et al., Tunable Plasmonic Silver Nanodomes
for Surface-Enhanced Raman Scattering, Plasmonics, 2017,
13(3), 785–795, DOI: 10.1007/s11468-017-0573-6.
55 W. Wei, et al., Improving SERS hot spots for on-site
pesticide detection by combining silver nanoparticles with
nanowires, J. Mater. Chem. C, 2018, 6(32), 8793–8803, DOI:
10.1039/c8tc01741g.
56 Lumerical, Lumerical Software, 2021, available from:
https://www.lumerical.com/products/fdtd/.
57 MeeMeep Sofware, 2021, available from: https://meep.read
thedocs.io/en/latest/.
58 OptiFDTD, OptiFDTD Software, 2021, available from:
https://optiwave.com/optifdtd-overview/.
59 O. Software, OmniSim Software, 2020, available from:
https://www.photond.com/products/omnisim.htm.
60 C. Studio, CST Studio, 2021, available from: https://www.
3ds.com/products-services/simulia/products/cst-studio-
suite/.
61 S. Atlas, Silvaco Atlas, 2020, available from: https://www.
silvaco.com/products/tcad/device_simulation/atlas/atlas.html.
62 E. M. Purcell and C. R. Pennypacker, Scattering and
Absorption of Light by Nonspherical Dielectric Grains,
Astrophys. J., 1973, 186, 705–714, DOI: 10.1086/152538.
63 B. T. Draine and P. J. Flatau, Discrete-Dipole Approxi-
mation For Scattering Calculations, J. Opt. Soc. Am. A,
1994, 11(4), 1491–1499, DOI: 10.1364/josaa.11.001491.
64 G. Mie, Beiträge zur Optik trüber Medien, speziell kolloi-
daler Metallösungen, Ann. Phys., 1908, 330(3), 377–445,
DOI: 10.1002/andp.19083300302.
65 S. Roopak, et al., Numerical Simulation of Broadband
Scattering by Coated and Noncoated Metal Nanostructures
Using Discrete Dipole Approximation Method, Plasmonics,
2015, 11(2), 425–432, DOI: 10.1007/s11468-015-0052-x.
66 H. Khadem and S. H. Tavassoli, The effect of size-
asymmetry of plasmonic heterodimers in surface-
enhanced Raman scattering, Appl. Phys. Lett., 2019,
114(25), 251901, DOI: 10.1063/1.5096430.
67 A. Demchuk, et al., The Computational Studies of Plasmon
Interaction, Nanoscale Res. Lett., 2017, 12(1), 273, DOI:
10.1186/s11671-017-2050-8.
68 R. Sharma, N. K. Pathak and R. P. Sharma, Computational
Study of Plasmon Interaction in Organic Media: a Compar-
ison Between Analytical and Numerical Model for Dimer,
Plasmonics, 2018, 13(5), 1775–1784, DOI: 10.1007/s11468-
018-0691-9.
69 X. B. Xu, et al., Discrete Dipole Approximation Simulation
of Nearly Touching Plasmonic Au Dimers and Influence of
Particle Shape Assembly on Optical Response, J. Nanosci.
Nanotechnol., 2016, 16(1), 562–569, DOI: 10.1166/
jnn.2016.10649.
70 T. Dasri and A. Chingsungnoen, Surface plasmon reso-
nance enhanced light absorption and wavelength tuneable
in gold-coated iron oxide spherical nanoparticle, J. Magn.
Magn. Mater., 2018, 456, 368–371, DOI: 10.1016/
j.jmmm.2018.02.066.
71 W. Zhang, H. Ma and J. Fan, Scaling Relations of Plasmon
Resonance Peak in Au@Fe3O4 Core–Shell Nanohybrids
Structure, Plasmonics, 2019, 14(5), 1123–1129, DOI:
10.1007/s11468-018-00901-w.
72 S. Catalan-Gomez, et al., Tunable plasmonic resonance of
gallium nanoparticles by thermal oxidation at low tem-
peratures, Nanotechnology, 2017, 28(40), 405705, DOI:
10.1088/1361-6528/aa8505.
73 Y. Hu, et al., Synthesis, Study, and Discrete Dipole Approxi-
mation Simulation of Ag–Au Bimetallic Nanostructures,
Nanoscale Res. Lett., 2016, 11(1), 209, DOI: 10.1186/s11671-
016-1435-4.
74 P. Bhatia, S. S. Verma and M. M. Sinha, Optical Properties
Simulation of Magneto-Plasmonic Alloys Nanostructures,
Plasmonics, 2018, 14(3), 611–622, DOI: 10.1007/s11468-018-
0839-7.
Review Journal of Materials Chemistry C
This journal is © The Royal Society of Chemistry 2021 J. Mater. Chem. C, 2021, 9, 9791–9819 | 9815
75 P. Bhatia, S. S. Verma and M. M. Sinha, Tunable plasmonic
properties of Ag–Fe nanoparticles, AIP Conf. Proc., 2018,
1953, 060009, DOI: 10.1063/1.5032740.
76 H. Lee, et al., Discrete-dipole approximation for the optical
properties with morphological changes of silver nanopr-
ism and nanosphere via galvanic reaction, Mater. Lett.,
2017, 209, 138–141, DOI: 10.1016/j.matlet.2017.07.130.
77 R. Lv, M. Feng and W. J. Parak, Up-Conversion Lumines-
cence Properties of Lanthanide-Gold Hybrid Nanoparticles
as Analyzed with Discrete Dipole Approximation, Nanoma-
terials, 2018, 8(12), 989, DOI: 10.3390/nano8120989.
78 S. Roopak, et al., Numerical Simulation of Extinction
Spectra of Plasmonically Coupled Nanospheres Using Dis-
crete Dipole Approximation: Influence of Compositional
Asymmetry, Plasmonics, 2016, 11(6), 1603–1612, DOI:
10.1007/s11468-016-0216-3.
79 J. J. Wei, et al., Collective Surface Plasmon Resonances in
Two-Dimensional Assemblies of Au and Ag Nanocrystals:
Experiments and Discrete Dipole Approximation Simula-
tion, J. Phys. Chem. C, 2016, 120(25), 13732–13738, DOI:
10.1021/acs.jpcc.6b03397.
80 V. Amendola, Surface plasmon resonance of silver and
gold nanoparticles in the proximity of graphene studied
using the discrete dipole approximation method, Phys.
Chem. Chem. Phys., 2016, 18(3), 2230–2241, DOI: 10.1039/
c5cp06121k.
81 M. Haiwei, et al., Optical properties of local surface plas-
mon resonance in Ag/ITO sliced nanosphere by the dis-
crete dipole approximation, Appl. Phys. A: Mater. Sci.
Process., 2016, 122(4), 419, DOI: 10.1007/s00339-016-9954-
5.
82 P. Bhatia, S. S. Verma and M. M. Sinha, Tunable optical
properties of Ni–Ag and Ni–Au nanoparticles in magneto-
plasmonic nanostructures, Opt. Quantum Electron., 2020,
52(11), 473, DOI: 10.1007/s11082-020-02596-y.
83 P. Bhatia, S. S. Verma and M. M. Sinha, Tunable plasmonic
properties of elongated bimetallic alloys nanoparticles
towards deep UV-NIR absorbance and sensing, J. Quant.
Spectrosc. Radiat. Transfer, 2020, 241, 106751, DOI:
10.1016/j.jqsrt.2019.106751.
84 A. Siabi-Garjan, S. Fakhri-Mirzanagh and Y. Azizian-
Kalandaragh, The effect of poly vinyl alcohol matrix on
the light absorbance of Ag2S nanoparticles; experimental
and discrete dipole approximation results, J. Quant. Spec-
trosc. Radiat. Transfer, 2019, 222–223, 26–34, DOI: 10.1016/
j.jqsrt.2018.10.018.
85 F. Sun, et al., Optimal aspect ratio and excitation spectral
region of individual Au Ag1 alloy nanobars for plasmonic
sensing, Phys. Lett. A, 2020, 384(30), 126785, DOI: 10.1016/
j.physleta.2020.126785.
86 V. Amendola, et al., Formation of alloy nanoparticles by
laser ablation of Au/Fe multilayer films in liquid environ-
ment, J. Colloid Interface Sci., 2017, 489, 18–27, DOI:
10.1016/j.jcis.2016.10.023.
87 S. Scaramuzza, S. Polizzi and V. Amendola, Magnetic tuning
of SERS hot spots in polymer-coated magnetic–plasmonic
iron–silver nanoparticles, Nanoscale Adv., 2019, 1(7),
2681–2689, DOI: 10.1039/c9na00143c.
88 A. Tymoczko, et al., One-step synthesis of Fe–Au core–shell
magnetic-plasmonic nanoparticles driven by interface
energy minimization, Nanoscale Horiz., 2019, 4(6),
1326–1332, DOI: 10.1039/c9nh00332k.
89 Y. Gutierrez, et al., How an oxide shell affects the ultravio-
let plasmonic behavior of Ga, Mg, and Al nanostructures,
Opt. Express, 2016, 24(18), 20621–20631, DOI: 10.1364/
OE.24.020621.
90 H. Pathak, et al., Resonant Broadband Field Enhancement
in Cylindrical Plasmonic Structure Surrounded by Perovs-
kite Environment, Plasmonics, 2016, 12(5), 1511–1522, DOI:
10.1007/s11468-016-0413-0.
91 E. Ringe, Shapes, Plasmonic Properties, and Reactivity of
Magnesium Nanoparticles, J. Phys. Chem. C, 2020, 124(29),
15665–15679, DOI: 10.1021/acs.jpcc.0c03871.
92 J. A. Arzola-Flores and A. L. González, Machine Learning
for Predicting the Surface Plasmon Resonance of Perfect
and Concave Gold Nanocubes, J. Phys. Chem. C, 2020,
124(46), 25447–25454, DOI: 10.1021/acs.jpcc.0c05995.
93 N. Hadilou, et al., An optimal architecture of magneto-
plasmonic core-shell nanoparticles for potential photo-
thermal applications, Phys. Chem. Chem. Phys., 2020,
22(25), 14318–14328, DOI: 10.1039/d0cp01509a.
94 E. A. Kwizera, et al., Size- and Shape-Controlled Synthesis
and Properties of Magnetic-Plasmonic Core–Shell Nano-
particles, J. Phys. Chem. C, 2016, 120(19), 10530–10546,
DOI: 10.1021/acs.jpcc.6b00875.
95 Y. Luo, et al., Colloidal Assembly of Au-Quantum Dot-Au
Sandwiched Nanostructures with Strong Plasmon-Exciton
Coupling, J. Phys. Chem. Lett., 2020, 11(7), 2449–2456, DOI:
10.1021/acs.jpclett.0c00110.
96 D. Avs
-ar, H. Ertürk and M. P. Mengüç, Absorption and
plasmon resonance of Bi-metallic core-shell nanoparticles
on a dielectric substrate near an external tip, J. Quant.
Spectrosc. Radiat. Transfer, 2020, 241, 106684, DOI:
10.1016/j.jqsrt.2019.106684.
97 P. Bhatia, S. S. Verma and M. M. Sinha, Magneto-
plasmonic Co@M (M = Au/Ag/Au–Ag) core–shell nano-
particles for biological imaging and therapeutics,
J. Quant. Spectrosc. Radiat. Transfer, 2020, 251, 107095,
DOI: 10.1016/j.jqsrt.2020.107095.
98 T. Bulavinets, et al., Efficient NIR energy conversion of
plasmonic silver nanostructures fabricated with the laser-
assisted synthetic approach for endodontic applications, RSC
Adv., 2020, 10(64), 38861–38872, DOI: 10.1039/d0ra06614a.
99 C. A. West, et al., Plasmon Hybridization in Nanorhombus
Assemblies, J. Phys. Chem. C, 2020, 124(49), 27009–27016,
DOI: 10.1021/acs.jpcc.0c08098.
100 M. Shabaninezhad, A. Kayani and G. Ramakrishna, Theo-
retical investigation of optical properties of embedded
plasmonic nanoparticles, Chem. Phys., 2021, 541, 111044,
DOI: 10.1016/j.chemphys.2020.111044.
101 Y. Ren, et al., Localized surface plasmon resonance of
nanotriangle dimers at different relative positions,
Journal of Materials Chemistry C Review
9816 | J. Mater. Chem. C, 2021, 9, 9791–9819 This journal is © The Royal Society of Chemistry 2021
J. Quant. Spectrosc. Radiat. Transfer, 2017, 199, 45–51, DOI:
10.1016/j.jqsrt.2017.05.003.
102 R. Sharma, et al., Numerical Simulation of Electromagnetic
Wave Interaction with Spheroidal Core–Shell Nanoparticle:
Dependence of Surface Plasmon Resonance on Core–Shell
Composition, Plasmonics, 2017, 13(1), 335–343, DOI:
10.1007/s11468-017-0518-0.
103 S. Catalan-Gomez, et al., Plasmonic coupling in closed-
packed ordered gallium nanoparticles, Sci. Rep., 2020,
10(1), 4187, DOI: 10.1038/s41598-020-61090-3.
104 N. Gordillo, et al., Spectrally broad plasmonic absorption
in Ga and In nanoparticle hybrids, Nanotechnology, 2019,
30(47), 475705, DOI: 10.1088/1361-6528/ab3c73.
105 M. Lemos de Souza, D. Pereira dos Santos and P. Corio,
Localized surface plasmon resonance enhanced photoca-
talysis: an experimental and theoretical mechanistic inves-
tigation, RSC Adv., 2018, 8(50), 28753–28762, DOI: 10.1039/
c8ra03919d.
106 V. Siahpoush, S. Ahmadi-kandjani and A. Nikniazi, Effect
of plasmonic coupling on photothermal behavior of ran-
dom nanoparticles, Opt. Commun., 2018, 420, 52–58, DOI:
10.1016/j.optcom.2018.03.021.
107 D. Avs
-ar, H. Ertürk and M. P. Mengüç, Plasmonic
responses of metallic/dielectric core-shell nanoparticles
on a dielectric substrate, Mater. Res. Express, 2019,
6(6), 065006, DOI: 10.1088/2053-1591/ab07fd.
108 M. Honda, et al., Near-UV plasmon resonances for
enhanced TiO2 photocatalysis, Jpn. J. Appl. Phys., 2020,
59(4), 045001, DOI: 10.35848/1347-4065/ab809b.
109 T. Kim, et al., Nanoparticle-Enhanced Silver-Nanowire
Plasmonic Electrodes for High-Performance Organic
Optoelectronic Devices, Adv. Mater., 2018,
30(28), e1800659, DOI: 10.1002/adma.201800659.
110 J. P. McClure, et al., Plasmonic-Enhancement of the
Electro-Oxidation of Ethanol in Alkaline Media with Au–
Fe2O3 Thin Film, Embedded, Sandwich and Surface Con-
figurations, MRS Adv., 2017, 2(55), 3397–3402, DOI:
10.1557/adv.2017.381.
111 R. Lv, et al., Plasmonic modulated upconversion fluores-
cence by adjustable distributed gold nanoparticles,
J. Lumin., 2020, 220, 116974, DOI: 10.1016/j.jlumin.
2019.116974.
112 T. Dasri, Theoretical calculation of plasmonic enhance-
ment of silver nanosphere, nanocube, and nanorod
embedded in organic solar cells, Integr. Ferroelectr., 2016,
175(1), 176–185, DOI: 10.1080/10584587.2016.1204201.
113 C. Sartorio, et al., Donor–Acceptor Interfaces by Engi-
neered Nanoparticles Assemblies for Enhanced Efficiency
in Plastic Planar Heterojunction Solar Cells, J. Phys. Chem.
C, 2016, 120(47), 26588–26599, DOI: 10.1021/acs.jpcc.
6b07302.
114 G. Coletta and V. Amendola, Numerical Modelling of the
Optical Properties of Plasmonic and Latex Nanoparticles to
Improve the Detection Limit of Immuno-Turbidimetric
Assays, Nanomaterials, 2021, 11(5), 1147, DOI: 10.3390/
nano11051147.
115 B. T. D. S. P. J. Flatau, User Guide for the Discrete Dipole
Approximation Code DDSCAT 7.2, 2012, https://arxiv.org/
abs/1202.3424.
116 V. L. Y. Loke, M. Pinar Mengüç and T. A. Nieminen,
Discrete-dipole approximation with surface interaction:
Computational toolbox for MATLAB, J. Quant. Spectrosc.
Radiat. Transfer, 2011, 112(11), 1711–1725, DOI: 10.1016/
j.jqsrt.2011.03.012.
117 S. Talebi Moghaddam, H. Ertürk and M. P. Mengüç,
Enhancing local absorption within a gold nano-sphere
on a dielectric surface under an AFM probe, J. Quant.
Spectrosc. Radiat. Transfer, 2016, 178, 124–133, DOI:
10.1016/j.jqsrt.2016.02.011.
118 Z. R. Fathi, M. P. Menguc and H. Erturk, Plasmon coupling
between complex gold nanostructures and a dielectric
substrate, Appl. Opt., 2018, 57(30), 8954–8963, DOI:
10.1364/AO.57.008954.
119 Y. Huang, et al., Nanogap effects on near- and far-field
plasmonic behaviors of metallic nanoparticle dimers, Phys.
Chem. Chem. Phys., 2015, 17(43), 29293–29298, DOI:
10.1039/c5cp04460j.
120 Y. Huang, et al., Nanoparticle-on-mirror cavity modes for
huge and/or tunable plasmonic field enhancement, Nano-
technology, 2017, 28(10), 105203, DOI: 10.1088/1361-6528/
aa5b27.
121 M. H. Rahaman and B. A. Kemp, Analytical model of
plasmonic resonance from multiple core-shell nano-
particles, Opt. Eng., 2017, 56(12), 121903, DOI: 10.1117/
1.Oe.56.12.121903.
122 S. R. Johannsen, et al., Up-conversion enhancement in Er3+
doped TiO2 through plasmonic coupling: experiments and
finite-element modeling, Appl. Phys. Lett., 2015,
106(5), 053101, DOI: 10.1063/1.4907415.
123 J. Grand and E. C. Le Ru, Practical Implementation of
Accurate Finite-Element Calculations for Electromagnetic
Scattering by Nanoparticles, Plasmonics, 2019, 15(1),
109–121, DOI: 10.1007/s11468-019-01014-8.
124 E. Marlow, Investigating the plasmonic behaviour of gold
nanostructured arrays with finite element method modelling
for optical sensing applications, PhD thesis, Queen’s Uni-
versity Belfast, 2020.
125 N. Blommaerts, et al., Unraveling Structural Information of
Turkevich Synthesized Plasmonic Gold–Silver Bimetallic
Nanoparticles, Small, 2019, 15(42), 1902791, DOI: 10.1002/
smll.201902791.
126 T. Cesca, et al., Nonlinear absorption tuning by composition
control in bimetallic plasmonic nanoprism arrays, Nano-
scale, 2015, 7(29), 12411–12418, DOI: 10.1039/c5nr01715g.
127 S. P. Tiwari, et al., LSPR-mediated improved upconversion
emission on randomly distributed gold nanoparticles
array, New J. Chem., 2020, 44(45), 19672–19682, DOI:
10.1039/c9nj06471k.
128 W. Ali, et al., All-Solution-Processed Ultrahigh Broadband
and Wide-Angle Perfect Absorber Based on Mxene–Gold
Nanoparticles, Adv. Opt. Mater., 2020, 8(21), 2000447, DOI:
10.1002/adom.202000447.
Review Journal of Materials Chemistry C
This journal is © The Royal Society of Chemistry 2021 J. Mater. Chem. C, 2021, 9, 9791–9819 | 9817
129 P. Tiwari, G. M. Das and V. R. Dantham, Optical Properties
of Au-Ag Bimetallic Nanoparticles of Different Shapes for
Making Efficient Bimetallic-Photonic Whispering Gallery
Mode Hybrid Microresonators, Plasmonics, 2020, 15(5),
1251–1260, DOI: 10.1007/s11468-020-01141-7.
130 T. Xing, et al., The synthesizing approach analysis of
hollow Ag/Au nanoparticles in replacement reaction
between silver nanoparticle and chloroauric acid, Appl.
Surf. Sci., 2020, 513, 145809, DOI: 10.1016/
j.apsusc.2020.145809.
131 M. Liang, et al., Plasmonic responses of Cu–Ag bimetallic
system: Influence of distinctiveness and arrangements, Opt.
Mater., 2020, 100, 109655, DOI: 10.1016/j.optmat.2020.109655.
132 M. Chen, et al., Transparent Display by the Scattering
Effect of Plasmonic Au–Ag Nanoparticles, Plasmonics,
2020, 15(6), 1855–1861, DOI: 10.1007/s11468-020-01194-8.
133 İ. S
- eker, et al., A Systematic Study on Au-Capped Si Nano-
whiskers for Size-Dependent Improved Biosensing Appli-
cations, Plasmonics, 2020, 15(6), 1739–1745, DOI: 10.1007/
s11468-020-01195-7.
134 J. J. Zhang, et al., A three-dimensional numerical study of
coupled photothermal and photoelectrical processes for
plasmonic solar cells with nanoparticles, Renewable Energy,
2021, 165, 278–287, DOI: 10.1016/j.renene.2020.11.010.
135 M. A. Masharin, et al., Giant Enhancement of Radiative
Recombination in Perovskite Light-Emitting Diodes with
Plasmonic Core–Shell Nanoparticles, Nanomaterials, 2021,
11(1), 45, DOI: 10.3390/nano11010045.
136 M. Jabeen, Design and Optimization of thin-film solar cell
configuration structures using the Finite Element Method,
Royal Holloway, University of London, 2020.
137 Sachchidanand and D. P. Samajdar, Performance enhance-
ment of Nanopyramid based Si hybrid solar cells utilizing
the plasmonic properties of oxide coated Metal Nano-
particles, Opt. Mater., 2020, 107, 110166, DOI: 10.1016/
j.optmat.2020.110166.
138 L. Q. Cao, et al., Influence of Geometry of Metallic Nano-
particles on Absorption of Thin-Film Organic Solar Cells: A
Critical Examination, IEEE Access, 2020, 8, 145950–145959,
DOI: 10.1109/access.2020.3014817.
139 Y. Chen, et al., Plasmon nanoparticle effect to improve
optical properties of perovskite thin film, Photonics and
Nanostructures - Fundamentals and Applications, 2021,
43, 100888, DOI: 10.1016/j.photonics.2020.100888.
140 M. Chen, et al., Coupled plasmon resonances of Au thorn
nanoparticles to enhance solar absorption performance,
J. Quant. Spectrosc. Radiat. Transfer, 2020, 250, 107029,
DOI: 10.1016/j.jqsrt.2020.107029.
141 K. Zarei and F. Emami, Absorption enhancement and
efficiency improvement of an organic solar cell embedded
with core–shell Au@ITO nanoparticles, Opt. Quantum Elec-
tron., 2020, 52(6), 275, DOI: 10.1007/s11082-020-02401-w.
142 F. Xia, et al., Ultra-high sensitivity SPR fiber sensor based
on multilayer nanoparticle and Au film coupling enhance-
ment, Measurement, 2020, 164, 108083, DOI: 10.1016/
j.measurement.2020.108083.
143 L. Yuan, et al., Morphology-Dependent Reactivity of a
Plasmonic Photocatalyst, ACS Nano, 2020, 14(9),
12054–12063, DOI: 10.1021/acsnano.0c05383.
144 S. Scarano, et al., Nano structures and polymers: Emerging
nanocomposites for plasmonic resonance transducers,
Thin Solid Films, 2020, 698, 137859, DOI: 10.1016/
j.tsf.2020.137859.
145 Z. Xie, et al., TiO2 nanorod arrays decorated with Au
nanoparticles as sensitive and recyclable SERS substrates,
J. Alloys Compd., 2021, 861, 157999, DOI: 10.1016/
j.jallcom.2020.157999.
146 B. Tian, Y. Wu and G. Lu, Metal-free plasmonic boron
phosphide/graphitic carbon nitride with core–shell struc-
ture photocatalysts for overall water splitting, Appl. Catal.,
B, 2021, 280, 119410, DOI: 10.1016/j.apcatb.2020.119410.
147 Y. C. Chau, et al., Simultaneous realization of high sensing
sensitivity and tunability in plasmonic nanostructures
arrays, Sci. Rep., 2017, 7(1), 16817, DOI: 10.1038/s41598-
017-17024-7.
148 Y. Wei, et al., The effect of silica shell on the surface
enhanced Raman scattering and fluorescence with Ag
nanoparticles: a three-dimensional finite element method
investigation, Opt. Commun., 2018, 427, 426–432, DOI:
10.1016/j.optcom.2018.06.086.
149 Y. Huang, et al., Small morphology variations effects on
plasmonic nanoparticle dimer hotspots, J. Mater. Chem. C,
2018, 6(36), 9607–9614, DOI: 10.1039/c8tc03556c.
150 M. R. Hasan, et al., Plasmonic Refractive Index Sensor
Employing Niobium Nanofilm on Photonic Crystal Fiber,
IEEE Photonics Technol. Lett., 2018, 30(4), 315–318, DOI:
10.1109/lpt.2017.2786475.
151 J. G. Ovejero, et al., Hybrid nanoparticles for magnetic and
plasmonic hyperthermia, Phys. Chem. Chem. Phys., 2018,
20(37), 24065–24073, DOI: 10.1039/c8cp02513d.
152 S. Manrique-Bedoya, et al., Multiphysics Modeling of Plas-
monic Photothermal Heating Effects in Gold Nano-
particles and Nanoparticle Arrays, J. Phys. Chem. C, 2020,
124(31), 17172–17182, DOI: 10.1021/acs.jpcc.0c02443.
153 O. Elhoussaine, E. Abdelaziz, M. Hicham and B. Abdenbi,
Plasmonic Nanorods investigating for cancer cell imaging and
photothermal therapy, 2020, pp. 1–4, DOI: 10.1109/
IRASET48871.2020.9092075.
154 H. Nie, et al., Two-dimensional Au  Ag hybrid plasmonic
nanoparticle network: broadband nonlinear optical response
and applications for pulsed laser generation, Nanophotonics,
2020, 9(8), 2537–2548, DOI: 10.1515/nanoph-2020-0097.
155 P. Xu, et al., Efficient Hydrolysis of Ammonia Borane for
Hydrogen Evolution Catalyzed by Plasmonic Ag@Pd Core–
Shell Nanocubes, ACS Sustainable Chem. Eng., 2020, 8(33),
12366–12377, DOI: 10.1021/acssuschemeng.0c02276.
156 A. Tomitaka, et al., Magneto-plasmonic nanostars for
image-guided and NIR-triggered drug delivery, Sci. Rep.,
2020, 10(1), 10115, DOI: 10.1038/s41598-020-66706-2.
157 D. T. Debu, et al., Broad range electric field enhancement
of a plasmonic nanosphere heterodimer, Opt. Mater.
Express, 2020, 10(7), 1704–1713, DOI: 10.1364/ome.396449.
Journal of Materials Chemistry C Review
9818 | J. Mater. Chem. C, 2021, 9, 9791–9819 This journal is © The Royal Society of Chemistry 2021
158 M. Chen, et al., Local Heating Control of Plasmonic
Nanoparticles for Different Incident Lights and Nano-
particles, Plasmonics, 2019, 14(6), 1893–1902, DOI:
10.1007/s11468-019-00990-1.
159 M. Chen, et al., Numerically investigating the optical
properties of plasmonic metallic nanoparticles for effective
solar absorption and heating, Sol. Energy, 2018, 161, 17–24,
DOI: 10.1016/j.solener.2017.12.032.
160 S. Ghosh and B. M. A. Rahman, Evolution of Plasmonic
Modes in a Metal Nano-Wire Studied by a Modified Finite
Element Method, J. Light Technol., 2018, 36(3), 809–818,
DOI: 10.1109/jlt.2017.2782710.
161 S. E. Hosseininejad, N. Komjani and M. Talafi Noghani, A
Comparison of Graphene and Noble Metals as Conductors
for Plasmonic One-Dimensional Waveguides, IEEE Trans.
Nanotechnol., 2015, 14(5), 829–836, DOI: 10.1109/
tnano.2015.2449903.
162 M. A. Butt, S. N. Khonina and N. L. Kazanskiy, Plasmonic
refractive index sensor based on metal–insulator-metal
waveguides with high sensitivity, J. Mod. Opt., 2019,
66(9), 1038–1043, DOI: 10.1080/09500340.2019.1601272.
163 M. A. Butt, N. L. Kazanskiy and S. N. Khonina, Highly
integrated plasmonic sensor design for the simultaneous
detection of multiple analytes, Curr. Appl. Phys., 2020,
20(11), 1274–1280, DOI: 10.1016/j.cap.2020.08.020.
164 M. F. O. Hameed, et al., Label-Free Highly Sensitive Hybrid
Plasmonic Biosensor for the Detection of DNA Hybridiza-
tion, J. Light Technol., 2017, 35(22), 4851–4858, DOI:
10.1109/jlt.2017.2733720.
165 C. Multiphysics, COMSOL Multiphysics Reference Manual,
available from: http://www.comsol.com/.
166 J. Software, JCMSuite, available from: https://jcmwave.
com/.
167 A. H. Software, HFSS, available from: https://www.ansys.
com/products/electronics/ansys-hfss.
168 T. Software, TiberCAD, available from: http://www.tibercad.
org/.
169 F. J. Garcı́a de Abajo and A. Howie, Retarded field calcula-
tion of electron energy loss in inhomogeneous dielectrics,
Phys. Rev. B: Condens. Matter Mater. Phys., 2002,
65(11), 115418, DOI: 10.1103/PhysRevB.65.115418.
170 A. Trügler, Personal Webpage, 2021, available from:
https://atruegler.at/research/nano/.
171 U. Hohenester and A. Trügler, MNPBEM – A Matlab tool-
box for the simulation of plasmonic nanoparticles, Com-
put. Phys. Commun., 2012, 183, 370–381.
172 A. A. Womiloju, et al., Microwave-Assisted Synthesis of
Core–Shell Nanoparticles—Insights into the Growth of
Different Geometries, Part. Part. Syst. Charact., 2020,
37(7), 2000019, DOI: 10.1002/ppsc.202000019.
173 M. Shiri and K. Abbasian, 3D tomographical imaging of
localized surface plasmon resonances of cylindrical and
dimeric spherical nanocrescents, Opt. Commun., 2020,
475, 126232, DOI: 10.1016/j.optcom.2020.126232.
174 M. S. Mousavi, et al., Electron energy-loss spectroscopy of
surface plasmon activity in wrinkled gold structures,
J. Chem. Phys., 2020, 153(22), 224703, DOI: 10.1063/
5.0031469.
175 S. De Marchi, et al., Pd nanoparticles as a plasmonic
material: synthesis, optical properties and applications,
Nanoscale, 2020, 12(46), 23424–23443, DOI: 10.1039/
d0nr06270g.
176 J. Lyu, et al., Two-step assembly kinetics of gold nano-
particles, J. Mater. Chem. C, 2021, 9(5), 1730–1739, DOI:
10.1039/d0tc05076h.
177 N. Fitria, M. Sujak and D. Djuhana, The influence of gap
spacing in localized surface plasmon resonance (LSPR) spec-
tra of Ag nanorod-coupled with end-to-end assembly using
boundary element method, IOP Conf. Ser.: Mater. Sci. Eng.,
2020, 763, 012062, DOI: 10.1088/1757-899x/763/1/012062.
178 N. Fitria, M. S. M. Kuddah and D. Djuhana, Investigation
the exponential decay of LSPR Ag nanorod-coupled with
side by side configuration using boundary element
method, IOP Conf. Ser.: Mater. Sci. Eng., 2019,
553, 012015, DOI: 10.1088/1757-899x/553/1/012015.
179 M. Ahmad, Simulations of the Surface Plasmon Reso-
nances of Au@Ag Core–Shell Nanocubes: Effect of Core–
Shell Size Ratio, Plasmonics, 2017, 13(3), 981–990, DOI:
10.1007/s11468-017-0596-z.
180 M. H. Putra, et al., A numerical study of the sensitivity of
surface plasmon resonance bimetallic silver-gold alloys
using boundary element method, IOP Conf. Ser.: Mater.
Sci. Eng., 2017, 188, 012016, DOI: 10.1088/1757-899x/188/1/
012016.
181 N. M. Saleh and A. A. Aziz, Simulation of Surface Plasmon
Resonance on Different Size of a Single Gold Nanoparticle,
J. Phys.: Conf. Ser., 2018, 1083, 012041, DOI: 10.1088/1742-
6596/1083/1/012041.
182 M. Sofani, M. H. Putra and D. Djuhana, The sensitivity
calculation of localized surface plasmon resonance (LSPR)
Au nanorod by applying a boundary element system simu-
lation, IOP Conf. Ser.: Mater. Sci. Eng., 2020, 763, 012076,
DOI: 10.1088/1757-899x/763/1/012076.
183 A. Dahiya and P. Senthil Kumar, Plasmonic gold-copper
alloy dimer as ‘nanorulers’, AIP Conf. Proc., 2020,
2265, 030078, DOI: 10.1063/5.0017257.
184 J. Marcheselli, et al., Simulating Plasmon Resonances of
Gold Nanoparticles with Bipyramidal Shapes by Boundary
Element Methods, J. Chem. Theory Comput., 2020, 16(6),
3807–3815, DOI: 10.1021/acs.jctc.0c00269.
185 G. Dall’Osto, et al., Real-time dynamics of plasmonic
resonances in nanoparticles described by a boundary ele-
ment method with generic dielectric function, J. Chem.
Phys., 2020, 153(18), 184114, DOI: 10.1063/5.0022329.
186 C. Qin, et al., Absorption characteristics of nanoparticles
with sharp edges for a direct-absorption solar collector,
Renewable Energy, 2020, 145, 21–28, DOI: 10.1016/
j.renene.2019.05.133.
187 M. Pastorello, et al., On the use of Au@Ag core-shell
nanorods for SERS detection of Thiram diluted solutions,
Spectrochim. Acta, Part A, 2020, 231, 118113, DOI: 10.1016/
j.saa.2020.118113.
Review Journal of Materials Chemistry C
This journal is © The Royal Society of Chemistry 2021 J. Mater. Chem. C, 2021, 9, 9791–9819 | 9819
188 J. Seo, et al., Tailoring the Spectral Absorption Coefficient
of a Blended Plasmonic Nanofluid Using a Customized
Genetic Algorithm, Sci. Rep., 2020, 10(1), 8891, DOI:
10.1038/s41598-020-65811-6.
189 M. Horák, et al., Plasmonic Properties of Silver Amalgam
Nanoparticles Studied by Analytical Transmission Electron
Microscopy, Microsc. Microanal., 2020, 26(S2), 2650–2652,
DOI: 10.1017/s1431927620022321.
190 U. Hohenester, Simulating electron energy loss spectro-
scopy with the MNPBEM toolbox, Comput. Phys. Commun.,
2014, 185(3), 1177–1187, DOI: 10.1016/j.cpc.2013.12.010.
191 U. Hohenester and A. Trügler, MNPBEM – A Matlab tool-
box for the simulation of plasmonic nanoparticles, Com-
put. Phys. Commun., 2012, 183(2), 370–381, DOI: 10.1016/
j.cpc.2011.09.009.
192 J. Waxenegger, A. Trügler and U. Hohenester, Plasmonics
simulations with the MNPBEM toolbox: Consideration of
substrates and layer structures, Comput. Phys. Commun.,
2015, 193, 138–150, DOI: 10.1016/j.cpc.2015.03.023.
193 Y. Shao, J. J. Yang and M. Huang, A Review of Computa-
tional Electromagnetic Methods for Graphene Modeling,
Int. J. Antennas Propagation, 2016, 2016, 1–9, DOI: 10.1155/
2016/7478621.
194 L. Avakyan, et al., Theoretical approach for calculation of
dielectric functions of plasmonic nanoparticles of noble
metals, magnesium and their alloys, Opt. Mater., 2020,
109, 110264, DOI: 10.1016/j.optmat.2020.110264.
195 N. G. Khlebtsov, T-matrix method in plasmonics: An over-
view, J. Quant. Spectrosc. Radiat. Transfer, 2013, 123,
184–217, DOI: 10.1016/j.jqsrt.2012.12.027.
196 O. S. Vartia, et al., On the applicability of discrete dipole
approximation for plasmonic particles, J. Quant. Spectrosc.
Radiat. Transfer, 2016, 169, 23–35, DOI: 10.1016/
j.jqsrt.2015.10.003.
197 S. Bhardwaj, et al., Near-field and far-field optical properties
of magnetic plasmonic core-shell nanoparticles with non-
spherical shapes: a discrete dipole approximation study, AIP
Adv., 2019, 9(2), 025021, DOI: 10.1063/1.5087705.
198 C. Boukouvala and E. Ringe, Wulff-Based Approach to
Modeling the Plasmonic Response of Single Crystal,
Twinned, and Core–Shell Nanoparticles, J. Phys. Chem. C,
2019, 123(41), 25501–25508, DOI: 10.1021/acs.jpcc.9b07584.
Journal of Materials Chemistry C Review