Comprehensive Statistical Methods: Mean, Median, Mode, Variance, and Standard Deviation Explained
Explore key statistical concepts including the relationships between mean, median, and mode, plus detailed methods to calculate variance and standard deviation with practical examples.
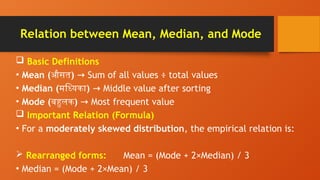
Relation between Mean,Median, and Mode
Basic Definitions
• Mean (औसत) Sum of all values ÷ total values
→
• Median (मध्यिका) Middle value after sorting
→
• Mode (बहुलक) Most frequent value
→
Important Relation (Formula)
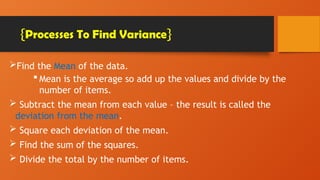
• For a moderately skewed distribution, the empirical relation is:
Rearranged forms: Mean = (Mode + 2×Median) / 3
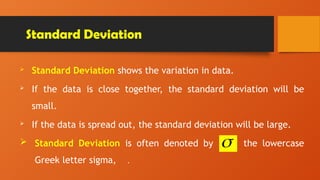
• Median = (Mode + 2×Mean) / 3
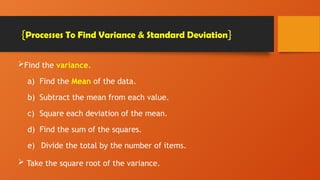
4.
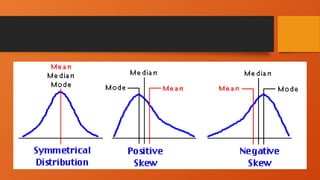
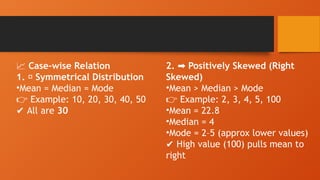
📈 Case-wise Relation
1.✅ Symmetrical Distribution
•Mean = Median = Mode
Example: 10, 20, 30, 40, 50
👉
✔ All are 30
2. Positively Skewed (Right
➡️
Skewed)
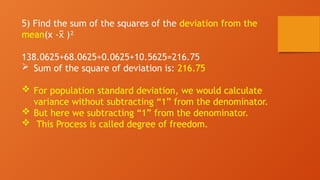
•Mean > Median > Mode
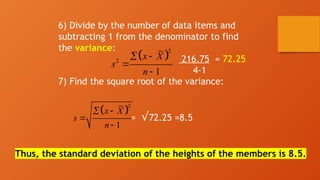
👉 Example: 2, 3, 4, 5, 100
•Mean = 22.8
•Median = 4
•Mode = 2–5 (approx lower values)
✔ High value (100) pulls mean to
right
5.
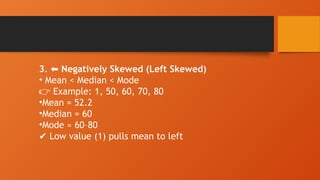
3. Negatively Skewed(Left Skewed)
⬅️
• Mean < Median < Mode
👉 Example: 1, 50, 60, 70, 80
•Mean = 52.2
•Median = 60
•Mode ≈ 60–80
✔ Low value (1) pulls mean to left
6.
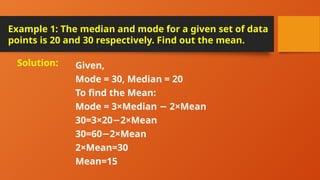
Example 1: Themedian and mode for a given set of data
points is 20 and 30 respectively. Find out the mean.
Given,
Mode = 30, Median = 20
To find the Mean:
Mode = 3×Median 2×Mean
−
30=3×20 2×Mean
−
30=60 2×Mean
−
2×Mean=30
Mean=15
Solution:
7.
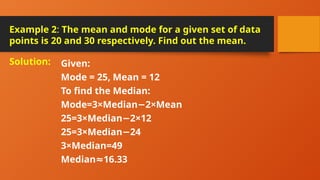
Example 2: Themean and mode for a given set of data
points is 20 and 30 respectively. Find out the mean.
Given:
Mode = 25, Mean = 12
To find the Median:
Mode=3×Median 2×Mean
−
25=3×Median 2×12
−
25=3×Median 24
−
3×Median=49
Median 16.33
≈
Solution:
8.
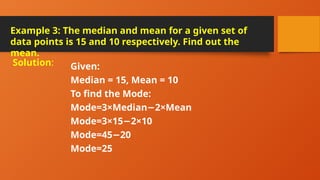
Example 3: Themedian and mean for a given set of
data points is 15 and 10 respectively. Find out the
mean.
Given:
Median = 15, Mean = 10
To find the Mode:
Mode=3×Median 2×Mean
−
Mode=3×15 2×10
−
Mode=45 20
−
Mode=25
Solution:
9.
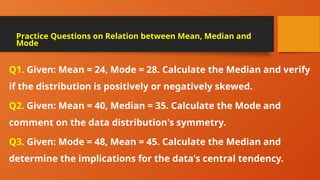
Q1. Given: Mean= 24, Mode = 28. Calculate the Median and verify
if the distribution is positively or negatively skewed.
Q2. Given: Mean = 40, Median = 35. Calculate the Mode and
comment on the data distribution's symmetry.
Q3. Given: Mode = 48, Mean = 45. Calculate the Median and
determine the implications for the data's central tendency.
Practice Questions on Relation between Mean, Median and
Mode
10.
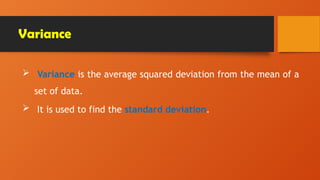
Variance
Variance isthe average squared deviation from the mean of a
set of data.
It is used to find the standard deviation.
11.
Find the Meanof the data.
Mean is the average so add up the values and divide by the
number of items.
Subtract the mean from each value – the result is called the
deviation from the mean.
Square each deviation of the mean.
Find the sum of the squares.
Divide the total by the number of items.
{Processes To Find Variance}
12.
Variance Formula
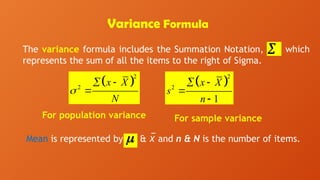
The varianceformula includes the Summation Notation, which
represents the sum of all the items to the right of Sigma.
For population variance
Mean is represented by & x
̅ and n & N is the number of items.
2
2
x X
N
2
2
1
x X
s
n
For sample variance
13.
Standard Deviation
StandardDeviation shows the variation in data.
If the data is close together, the standard deviation will be
small.
If the data is spread out, the standard deviation will be large.
Standard Deviation is often denoted by the lowercase
Greek letter sigma, .
14.
Find the variance.
a)Find the Mean of the data.
b) Subtract the mean from each value.
c) Square each deviation of the mean.
d) Find the sum of the squares.
e) Divide the total by the number of items.
Take the square root of the variance.
{Processes To Find Variance & Standard Deviation}
15.
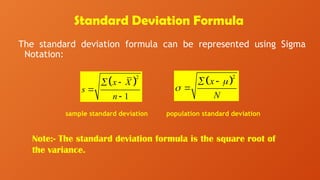
Standard Deviation Formula
Thestandard deviation formula can be represented using Sigma
Notation:
Note:- The standard deviation formula is the square root of
the variance.
2
1
x X
s
n
2
x
N
sample standard deviation population standard deviation
16.
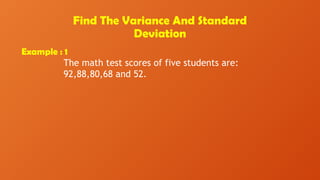
Find The VarianceAnd Standard
Deviation
Example : 1
The math test scores of five students are:
92,88,80,68 and 52.
17.
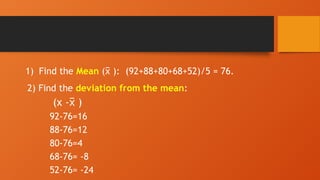
2) Find thedeviation from the mean:
(x - )
x
̅
92-76=16
88-76=12
80-76=4
68-76= -8
52-76= -24
1) Find the Mean ( ):
x
̅ (92+88+80+68+52)/5 = 76.
18.
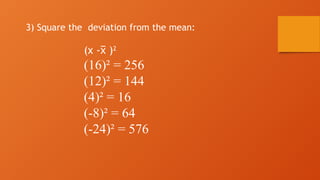
3) Square thedeviation from the mean:
(x - )
x
̅ 2
(16)² = 256
(12)² = 144
(4)² = 16
(-8)² = 64
(-24)² = 576
19.
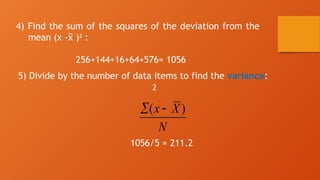
4) Find thesum of the squares of the deviation from the
mean (x - )
x
̅ 2
:
256+144+16+64+576= 1056
5) Divide by the number of data items to find the variance:
2
1056/5 = 211.2
( )
x X
N
20.
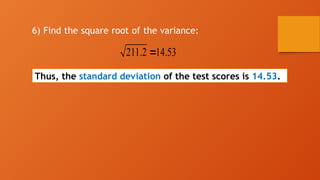
6) Find thesquare root of the variance:
211.2 14.53
Thus, the standard deviation of the test scores is 14.53.
21.
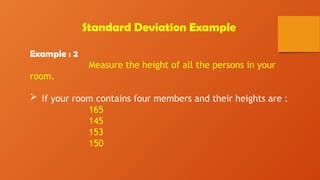
Standard Deviation Example
Example: 2
Measure the height of all the persons in your
room.
If your room contains four members and their heights are :
165
145
153
150
22.
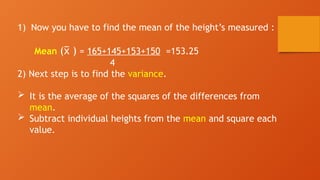
1) Now youhave to find the mean of the height’s measured :
Mean ( )
x
̅ = 165+145+153+150 =153.25
4
2) Next step is to find the variance.
It is the average of the squares of the differences from
mean.
Subtract individual heights from the mean and square each
value.
23.
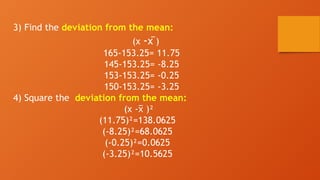
3) Find thedeviation from the mean:
(x -x )
̅
165-153.25= 11.75
145-153.25= -8.25
153-153.25= -0.25
150-153.25= -3.25
4) Square the deviation from the mean:
(x - )²
x
̅
(11.75)²=138.0625
(-8.25)²=68.0625
(-0.25)²=0.0625
(-3.25)²=10.5625
24.
5) Find thesum of the squares of the deviation from the
mean(x - )²
x
̅
138.0625+68.0625+0.0625+10.5625=216.75
Sum of the square of deviation is: 216.75
For population standard deviation, we would calculate
variance without subtracting “1” from the denominator.
But here we subtracting “1” from the denominator.
This Process is called degree of freedom.
25.
6) Divide bythe number of data items and
subtracting 1 from the denominator to find
the variance:
216.75 = 72.25
4-1
7) Find the square root of the variance:
= √72.25 =8.5
Thus, the standard deviation of the heights of the members is 8.5.
2
2
1
x X
s
n
2
1
x X
s
n
 Most read
 Most read
 Most read