Characterization of Occupational Exposures to Respirable Silica and Dust in Construction Activities
Study of respirable crystalline silica and dust exposures during demolition, crushing, and chipping; evaluation of dust suppression methods and compliance with OSHA standards.
Annals of WorkExposures and Health, 2019, Vol. 63, No. 135
assigned protection factor of the half-face N95 cartridge respirators used during chipping. Exposures
of crushing tenders were reduced to levels under the OSHA PEL when a water spraying system in
crushing machines was utilized, but not when a water cannon machine was used. Area samples at
demolition and crushing sites indicate overall lower exposures than the PEL, however, bystander
workers at crushing sites could be exposed to higher levels compared to demolition sites. Real-time
dust monitoring during demolition indicate very high short-term peak exposures.
Conclusions: Controlling or reducing crystalline silica exposures to levels under the new OSHA PEL
of 50 µg/m3
remains challenging for chipping workers and crushing machine tenders. Even with the
use of dust suppression controls, respiratory protection may be required for various tasks.
Keywords: chipping; construction; crushing; demolition; respirable crystalline silica; respirable dust
Introduction
In 2016, the Occupational Safety and Health
Administration (OSHA) promulgated a new rule regu-
lating occupational respirable crystalline silica (RCS)
exposures by establishing a lower permissible exposure
limit (PEL) and including a number of new provisions
for exposure assessment, medical surveillance, dust con-
trol methods, respiratory protection, and recordkeep-
ing for both general industry and construction workers
(OSHA, 2016a). To ensure compliance with the new
standard, construction contractors are required to assess
8-h time-weighted average (TWA) exposures through ex-
posure monitoring or objective exposure data, or to use
dust controls specified for 18 high silica exposure con-
struction tasks listed in ‘Table 1’ of the OSHA standard.
About 2.2 million construction workers are exposed
to crystalline silica, which is known to be associated
with development of silicosis, an incurable lung dis-
ease of scarring of lung tissue leading to inflammation,
decreased lung function, and respiratory failure (OSHA,
2013). The International Agency for Research on Cancer
(IARC, 1997) lists silica as a group I known carcinogen
to humans and the National Toxicology Program
(NTP, 2011) reports crystalline silica as ‘known human
carcinogen’.
Overexposure to silica exposures in the construc-
tion industry has been documented by numerous stud-
ies (Rappaport et al., 2003; Sauve et al., 2013; OSHA,
2016c). Construction activities associated with high ex-
posure levels include abrasive blasting, cutting and drill-
ing, and road and bridge work (Rappaport et al., 2003).
Demolition, crushing, and chipping activities can poten-
tially generate high silica exposures since they involve
mechanical disruption of materials that contain crys-
talline silica. Demolition is a construction activity that
aims at destroying building structures often using heavy
equipment. Crushing is performed to reduce the size of
demolition materials to produce a product useful for
other construction jobs such as roadwork, asphalt work,
etc. Concrete chipping in substructure bridge repair is
done to remove old concrete using handheld pneumatic
chipping guns. Even though demolition, crushing, and
chipping are common in construction, little is known
about silica and dust exposures and the effectiveness of
dust suppression methods used during these activities.
The goal of this study was to characterize occupational
exposures to RCS and dust during demolition, crushing,
and chipping activities and to evaluate the impact of cur-
rently used dust suppression methods on reducing work-
place exposures. Task-based exposure data presented in
this paper can help practitioners identify effective strat-
egies to control silica exposures during these activities.
Methods
Sampling sites
This study was conducted in partnership with several
local contractors in Massachusetts specialized in demo-
lition, crushing, and concrete chipping during sub-
structure bridge repair. Exposure measurements were
performed at two demolition sites, one crushing oper-
ation, and five bridge repair sites.
Demolition sites consisted of: (i) demolition of a
multi-story building located in a commercial and resi-
dential area downtown Boston, MA (site A); and (ii)
demolition of multiple three-story buildings located in
a rural area outside of Boston, MA (site B). Sampling
was performed for 4 days at site A and 5 days at site
B (see Supplementary Table S1, available at Annals of
Work Exposures and Health online). Different types of
excavators were used at each site performing a variety
of tasks including destruction of building walls, excava-
tion, materials’ sorting, and debris’ removal. The types
of heavy equipment machines utilized at both sites
were very similar consisting of excavators, material
handlers, loaders, trucks, etc. Demolition debris at site
A was transported out of the site, while at site B debris
was crushed onsite using a portable crushing machine.
3.
36 Annals ofWork Exposures and Health, 2019, Vol. 63, No. 1
Operation of the crushing machine at site B required a
constant presence of a crushing machine tender, who
stood at the top of the machine to remove unwanted
materials. The job specifications at site A mandated to
use of dust suppression methods to comply with city
regulations for preventing community exposures to
dust. Dust suppression methods consisted of a water
spray system installed in a long reach excavator, water
hoses held by laborers that were connected to nearby
hydrants, and water tender trucks. The use of dust sup-
pression methods at site B was not mandatory, since this
site was further away from residential homes. As part of
a demonstration project in collaboration with a supplier
of dust suppression machines, demolition contractors
used a water cannon machine for reducing dust expo-
sures for 1 day at each demolition site. This machine,
similar to those used on ski slopes to generate snow, con-
nects via hoses to a water source and projects atomized
water particles (50–100 microns) into the air through
many spray nozzles and a high-powered fan. The water
cannon machines used at both sites were very similar in
design, but while one worked with electricity the other
with a diesel generator. Trained workers were respon-
sible for manually changing the direction of the water
droplet stream towards the highest levels of visible dust.
Crushing was performed at a semi-mobile crushing
site (site C) located outside of Boston. The raw material
was brought to this crushing site from different local
demolition sites. The crushing system here involved
the use of three portable crushing machines, all set to
crush the material to specific sizes. The entire operation
involved the work of a heavy machine operator loading
the material into the first crusher hopper, an operator
overseeing the machines from inside of a control cabin,
and two crusher tenders, who were working next to
crushing machines’ conveyor line to remove unwanted
materials (wood, rebar, wire, etc.). Sampling was per-
formed during three consecutive days. Every worker
used N95 dust masks. Local regulations required appli-
cation of wet dust suppression methods to reduce the
levels of visible dust. A built-in water spraying system
was present at each conveyor transfer point consisting
of hoses with misting attachments to target the material.
In addition, a water cannon misting machine, similar to
the unit at site A, was used during 2 days of our sam-
pling (see Supplementary Table S1, available at Annals
of Work Exposures and Health online). The localized
spraying system was shut off when the water cannon
was used.
Concrete chipping was performed at five different
substructure bridge repair sites. Workers performed chip-
ping under bridges using handheld pneumatic chipping
guns (35–40 lb) while standing in highly elevated scaf-
folds. There were three to five workers at each site and
each of them wore a half-face N95 cartridge respirator
with an assigned protection factor of 10 (APF 10). At
the time of our sampling, the contractor was interested
in evaluating the efficacy of an ‘air curtain’ device as a
dust suppression method for reducing workers’ expo-
sures. The air curtain comprised a pneumatic style ven-
turi air blower (Model ASI-1200) attached to a 10-foot
long, 4” diameter aluminum duct with 3/4” holes spaced
6” from each other (Fig. 1). The air curtain was directed
downward toward the chipping surface to blow dust
away from workers’ breathing zone. The air curtain was
used at two sampling sites for 2–3 h each day. Personal
breathing zone exposures ‘with’ and ‘without’ the use of
the air curtain were compared.
Exposure measurements
Personal exposure monitoring
RCS and respirable dust (RD) exposures were measured
in the breathing zone of operating engineers running
different heavy equipment, laborers at demolition sites
responsible for holding water hoses, crusher tenders
at crushing site, and the handheld pneumatic chipping
gun operators at substructure bridge repair sites. Every
study participant signed a consent form approved by
the UMass Lowell Institutional Compliance Office.
Exposure monitoring was performed regardless of
whether respirators were worn or not. RD samples were
collected using 37 mm diameter polyvinyl chloride PVC
filters, (Millipore, Billerica, MA) loaded into two-piece
cassettes, housed in BGI 4 (Mesa Laboratories, Butler,
NJ) respirable cyclones attached to GilAir 3 sampling
pumps (Sensidyne, IHS Instrumentation, Clearwater,
FL). Filters were equilibrated before and after weigh-
ing in an environmental chamber at 25°C and 50%
relative humidity. Sampling pumps were calibrated to
Figure 1. Venturi style (Model ASI-1200) air blower with
attached air curtain used at two substructure bridge repair
sampling sites.
4.
Annals of WorkExposures and Health, 2019, Vol. 63, No. 137
a nominal flow rate of 2.2 l/min using a primary cali-
bration standard DryCal DC-Lite (Bios International
Corporation, Butler, NJ). Appropriate field blanks
were collected for each site visit as part of the sam-
pling protocol. Duration of sampling varied from site
to site depending on the duration of tasks and workers’
participation. In cases when exposures were deemed as
very high (substantial visible dust were observed), sam-
pling was restricted to shorter durations to avoid over-
loading of filters. The median sampling duration was
133 min at chipping sites, 295 min at demolition sites,
and 193 min at the crushing site. Concentrations of RD
were determined with gravimetric analysis according
to the National Institute of Occupational Safety and
Health (NIOSH) Analytical Method 0600 using an
analytical microbalance (Mettler Toledo, XP26 model,
Columbus OH) with a limit of detection (LOD) of
15 µg. Samples were analyzed for silica quartz content
with Fourier Transform Infrared Spectrophotometry
(FT-IR) according to NIOSH Analytical Method 7602,
modified by Bello and Virji et al. (Bello et al., 2002;
Virji et al., 2002). After weighing all filters were ashed
and 5 mm KBr pellets were prepared to quantify quartz
at its major peak at 978 cm−1
. The LOD of the analyt-
ical method for the 5 mm pellet is 1.3 µg quartz per
sample.
Area exposure monitoring
Integrated area samples (n = 33) were collected at the
perimeter of the work zone at demolition and crushing
sites (see Supplementary Table S1, available at Annals of
Work Exposures and Health online). Samples were sta-
tioned 10–15 m away from the center of work activi-
ties and 1.5 m above the ground. Sample location was
determined by taking into account the physical barri-
ers along each site and the layout of the buildings. At
each site, three to four area samples were collected per
day of sampling. Area samples at site B were collected
only at the perimeter of the demolition zone and not at
the area surrounding the crushing machine. Area sam-
ples were collected and analyzed following the methods
described previously (see the section ‘Personal exposure
monitoring’). Duration of area samples ranged from
129 to 432 min with a median of 286 min. At site A, in
addition to the integrated area samples, we performed
real-time monitoring of RD using three direct read-
ing aerosol monitors DataRAM pDR 1500 and pDR
1200 (Thermo Fisher Scientific, Franklin, MA) during
three sampling days. All pDR instruments were cali-
brated prior to each sampling day and were set to record
1-min average RD concentrations. Real-time exposure
data were downloaded using the equipment software.
Concentrations of RD were corrected by applying cor-
rection factors, calculated as the ratio of daily average
from direct reading instrument divided by the daily
average of an integrated filter sample collected with the
pDR.
Statistical analysis
Exposure data analyses were conducted with SAS ver-
sion 9.4 (SAS Institute Inc., Cary, NC) software. Since
the data were more lognormal than normal, all statis-
tical testing were executed on exposure concentration
logs resulting in geometric mean (GM) and geometric
standard deviation (GSD) for RCS and RD. The univari-
ate Proc GLM procedure and Proc mixed models were
used to investigate association of RCS and RD expo-
sures (depended variables) with task/job performed, ex-
posure control, and site activity (independent variables).
Personal exposures at demolition and crushing sites were
compared by job/task performed (categories: operating
engineers, laborers, and crushing tenders) using mixed
models with site id as a random effect. The univariate
Proc GLM procedure was used to assess the impact of
exposure controls within each site categorized as: ‘water
cannon and hoses versus water hoses’ for demolition site
A, ‘water cannon versus no dust suppression’ for demo-
lition site B, ‘water cannon versus water spraying’ for
crushing site C, and ‘with versus without air current’ for
chipping sites. Association of area exposures measured at
sites A, B, and C with the activity performed (categories:
demolition, crushing) was also investigated using mixed
models with site id as a random effect. Since less than
8% of the personal samples had non-detectable RCS
and GSD 3, they were substituted with the LOD/√2 for
statistical analysis (Hornung and Reed, 1990; Croghan
and Egeghy, 2003). LIFEREG procedure in SAS was
used the calculate the GM for demolition area samples
with 15% non-detectable RCS levels (Jin et al., 2011).
Personal exposures were compared with the new OSHA
PEL of 50 µg/m3
by calculating the 8-h TWA (8 h-TWA)
exposure assuming zero exposures for the unsampled
time. Furthermore, real-time RD concentrations meas-
ured at demolition site A were analyzed with time series
analyses in SAS to compare exposures for upwind and
downwind samples. The Autoreg procedure in SAS was
used to estimate the mean and standard error of the
log concentration values after adjusting for an auto-
correlation lag of two (Dahm et al., 2013). Parameter
estimates from the Autoreg procedure were then used
to evaluate whether the difference in RD concentrations
was statistically significant.
5.
38 Annals ofWork Exposures and Health, 2019, Vol. 63, No. 1
Results
Personal silica and dust exposures
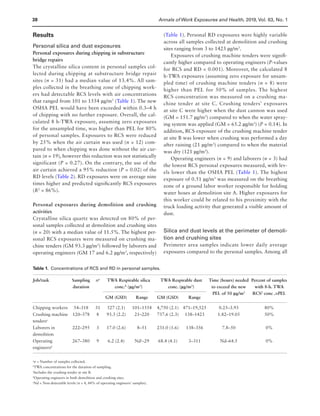
Personal exposures during chipping in substructure
bridge repairs
The crystalline silica content in personal samples col-
lected during chipping at substructure bridge repair
sites (n = 31) had a median value of 13.4%. All sam-
ples collected in the breathing zone of chipping work-
ers had detectable RCS levels with air concentrations
that ranged from 101 to 1554 µg/m3
(Table 1). The new
OSHA PEL would have been exceeded within 0.3–4 h
of chipping with no further exposure. Overall, the cal-
culated 8 h-TWA exposure, assuming zero exposures
for the unsampled time, was higher than PEL for 80%
of personal samples. Exposures to RCS were reduced
by 25% when the air curtain was used (n = 12) com-
pared to when chipping was done without the air cur-
tain (n = 19), however this reduction was not statistically
significant (P = 0.27). On the contrary, the use of the
air curtain achieved a 95% reduction (P = 0.02) of the
RD levels (Table 2). RD exposures were on average nine
times higher and predicted significantly RCS exposures
(R2
= 86%).
Personal exposures during demolition and crushing
activities
Crystalline silica quartz was detected on 80% of per-
sonal samples collected at demolition and crushing sites
(n = 20) with a median value of 11.5%. The highest per-
sonal RCS exposures were measured on crushing ma-
chine tenders (GM 93.3 µg/m3
) followed by laborers and
operating engineers (GM 17 and 6.2 µg/m3
, respectively)
(Table 1). Personal RD exposures were highly variable
across all samples collected at demolition and crushing
sites ranging from 3 to 1423 µg/m3
.
Exposures of crushing machine tenders were signifi-
cantly higher compared to operating engineers (P-values
for RCS and RD 0.001). Moreover, the calculated 8
h-TWA exposures (assuming zero exposure for unsam-
pled time) of crushing machine tenders (n = 8) were
higher than PEL for 50% of samples. The highest
RCS concentration was measured on a crushing ma-
chine tender at site C. Crushing tenders’ exposures
at site C were higher when the dust cannon was used
(GM = 151.7 µg/m3
) compared to when the water spray-
ing system was applied (GM = 65.2 µg/m3
) (P = 0.14). In
addition, RCS exposure of the crushing machine tender
at site B was lower when crushing was performed a day
after raining (21 µg/m3
) compared to when the material
was dry (121 µg/m3
).
Operating engineers (n = 9) and laborers (n = 3) had
the lowest RCS personal exposures measured, with lev-
els lower than the OSHA PEL (Table 1). The highest
exposure of 0.51 µg/m3
was measured on the breathing
zone of a ground labor worker responsible for holding
water hoses at demolition site A. Higher exposures for
this worker could be related to his proximity with the
truck loading activity that generated a visible amount of
dust.
Silica and dust levels at the perimeter of demoli-
tion and crushing sites
Perimeter area samples indicate lower daily average
exposures compared to the personal samples. Among all
Table 1. Concentrations of RCS and RD in personal samples.
Job/task Sampling
duration
na
TWA Respirable silica
conc.b
(µg/m3
)
TWA Respirable dust
conc. (µg/m3
)
Time (hours) needed
to exceed the new
PEL of 50 µg/m3
Percent of samples
with 8-h. TWA
RCS2
conc .PEL
GM (GSD) Range GM (GSD) Range
Chipping workers 54–318 31 527 (2.1) 101–1554 4,750 (2.1) 471–19,525 0.25–3.93 80%
Crushing machine
tendersc
120–378 8 93.3 (2.2) 21–220 737.6 (2.3) 138–1423 1.82–19.05 50%
Laborers in
demolition
222–295 3 17.0 (2.6) 8–51 231.0 (1.6) 138–356 7.8–50 0%
Operating
engineersd
267–380 9 6.2 (2.4) Nde
–29 68.4 (4.1) 3–311 Nd–64.5 0%
a
n = Number of samples collected.
b
TWA concentrations for the duration of sampling.
c
Includes the crushing tender at site B.
d
Operating engineers in both demolition and crushing sites.
e
Nd = Non-detectable levels (n = 4, 44% of operating engineers’ samples).
6.
Annals of WorkExposures and Health, 2019, Vol. 63, No. 139
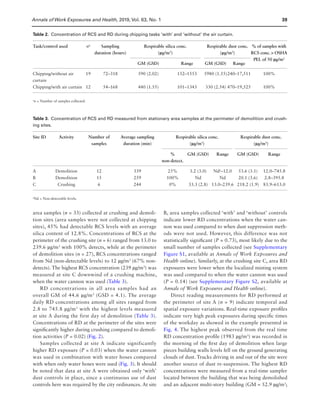
area samples (n = 33) collected at crushing and demoli-
tion sites (area samples were not collected at chipping
sites), 45% had detectable RCS levels with an average
silica content of 12.8%. Concentrations of RCS at the
perimeter of the crushing site (n = 6) ranged from 13.0 to
239.6 µg/m3
with 100% detects, while at the perimeter
of demolition sites (n = 27), RCS concentrations ranged
from Nd (non-detectable levels) to 12 µg/m3
(67% non-
detects). The highest RCS concentration (239 µg/m3
) was
measured at site C downwind of a crushing machine,
when the water cannon was used (Table 3).
RD concentrations in all area samples had an
overall GM of 44.6 µg/m3
(GSD = 4.1). The average
daily RD concentrations among all sites ranged from
2.8 to 745.8 µg/m3
with the highest levels measured
at site A during the first day of demolition (Table 3).
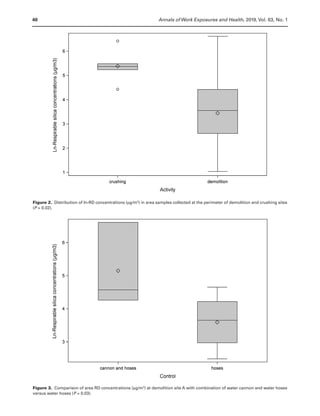
Concentrations of RD at the perimeter of the sites were
significantly higher during crushing compared to demoli-
tion activities (P = 0.02) (Fig. 2).
Samples collected at site A indicate significantly
higher RD exposure (P = 0.03) when the water cannon
was used in combination with water hoses compared
with when only water hoses were used (Fig. 3). It should
be noted that data at site A were obtained only ‘with’
dust controls in place, since a continuous use of dust
controls here was required by the city ordinances. At site
B, area samples collected ‘with’ and ‘without’ controls
indicate lower RD concentrations when the water can-
non was used compared to when dust suppression meth-
ods were not used. However, this difference was not
statistically significant (P = 0.73), most likely due to the
small number of samples collected (see Supplementary
Figure S1, available at Annals of Work Exposures and
Health online). Similarly, at the crushing site C, area RD
exposures were lower when the localized misting system
was used compared to when the water cannon was used
(P = 0.14) (see Supplementary Figure S2, available at
Annals of Work Exposures and Health online).
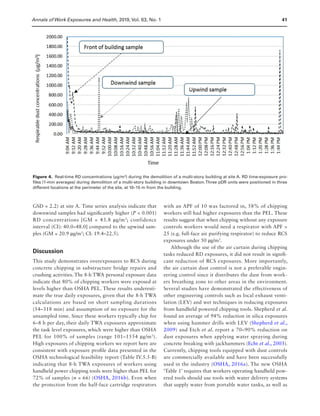
Direct reading measurements for RD performed at
the perimeter of site A (n = 9) indicate temporal and
spatial exposure variations. Real-time exposure profiles
indicate very high peak exposures during specific times
of the workday as showed in the example presented in
Fig. 4. The highest peak observed from the real time
RD concentration profile (1983 µg/m3
) was recorded in
the morning of the first day of demolition when large
pieces building walls levels fell on the ground generating
clouds of dust. Trucks driving in and out of the site were
another source of dust re-suspension. The highest RD
concentrations were measured from a real-time sampler
located between the building that was being demolished
and an adjacent multi-story building (GM = 52.9 µg/m3
;
Table 2. Concentration of RCS and RD during chipping tasks ‘with’ and ‘without’ the air curtain.
Task/control used na
Sampling
duration (hours)
Respirable silica conc.
(µg/m3
)
Respirable dust conc.
(µg/m3
)
% of samples with
RCS conc. OSHA
PEL of 50 µg/m3
GM (GSD) Range GM (GSD) Range
Chipping/without air
curtain
19 72–318 590 (2.02) 152–1553 5980 (1.55)240–17,511 100%
Chipping/with air curtain 12 54–168 440 (1.55) 101–1343 330 (2.54) 470–19,525 100%
a
n = Number of samples collected.
Table 3. Concentration of RCS and RD measured from stationary area samples at the perimeter of demolition and crush-
ing sites.
Site ID Activity Number of
samples
Average sampling
duration (min)
Respirable silica conc.
(µg/m3
)
Respirable dust conc.
(µg/m3
)
%
non-detect.
GM (GSD) Range GM (GSD) Range
A Demolition 12 339 25% 3.2 (3.0) Nda
–12.0 53.6 (3.1) 12.0–745.8
B Demolition 15 259 100% Nd Nd 20.1 (3.6) 2.8–395.8
C Crushing 6 244 0% 33.3 (2.8) 13.0–239.6 218.2 (1.9) 83.9–613.0
a
Nd = Non-detectable levels.
7.
40 Annals ofWork Exposures and Health, 2019, Vol. 63, No. 1
Figure 2. Distribution of ln-RD concentrations (µg/m3
) in area samples collected at the perimeter of demolition and crushing sites
(P = 0.02).
Figure 3. Comparison of area RD concentrations (µg/m3
) at demolition site A with combination of water cannon and water hoses
versus water hoses (P = 0.03).
8.
Annals of WorkExposures and Health, 2019, Vol. 63, No. 141
GSD = 2.2) at site A. Time series analysis indicate that
downwind samples had significantly higher (P 0.001)
RD concentrations [GM = 43.8 µg/m3
; confidence
interval (CI): 40.0–48.0] compared to the upwind sam-
ples (GM = 20.9 µg/m3
; CI: 19.4–22.5).
Discussion
This study demonstrates overexposures to RCS during
concrete chipping in substructure bridge repairs and
crushing activities. The 8-h TWA personal exposure data
indicate that 80% of chipping workers were exposed at
levels higher than OSHA PEL. These results underesti-
mate the true daily exposures, given that the 8-h TWA
calculations are based on short sampling durations
(54–318 min) and assumption of no exposure for the
unsampled time. Since these workers typically chip for
6–8 h per day, their daily TWA exposures approximate
the task level exposures, which were higher than OSHA
PEL for 100% of samples (range 101–1554 µg/m3
).
High exposures of chipping workers we report here are
consistent with exposure profile data presented in the
OSHA technological feasibility report (Table IV.5.5-B)
indicating that 8-h TWA exposures of workers using
handheld power chipping tools were higher than PEL for
72% of samples (n = 66) (OSHA, 2016b). Even when
the protection from the half-face cartridge respirators
with an APF of 10 was factored in, 58% of chipping
workers still had higher exposures than the PEL. These
results suggest that when chipping without any exposure
controls workers would need a respirator with APF
25 (e.g. full-face air purifying respirator) to reduce RCS
exposures under 50 µg/m3
.
Although the use of the air curtain during chipping
tasks reduced RD exposures, it did not result in signifi-
cant reduction of RCS exposures. More importantly,
the air curtain dust control is not a preferable engin-
eering control since it distributes the dust from work-
ers breathing zone to other areas in the environment.
Several studies have demonstrated the effectiveness of
other engineering controls such as local exhaust venti-
lation (LEV) and wet techniques in reducing exposures
from handheld powered chipping tools. Shepherd et al.
found an average of 94% reduction in silica exposures
when using hammer drills with LEV (Shepherd et al.,
2009) and Etch et al. report a 70–90% reduction on
dust exposures when applying water spraying during
concrete breaking with jackhammers (Echt et al., 2003).
Currently, chipping tools equipped with dust controls
are commercially available and have been successfully
used in the industry (OSHA, 2016a). The new OSHA
‘Table 1’ requires that workers operating handheld pow-
ered tools should use tools with water delivery systems
that supply water from portable water tanks, as well as
Figure 4. Real-time RD concentrations (µg/m3
) during the demolition of a multi-story building at site A. RD time-exposure pro-
files (1-min averages) during demolition of a multi-story building in downtown Boston.Three pDR units were positioned in three
different locations at the perimeter of the site, at 10–15 m from the building.
9.
42 Annals ofWork Exposures and Health, 2019, Vol. 63, No. 1
wear respirators with APF 10 if they perform the work
for more than 4 h/shift. Alternatively, workers could use
tools with shroud and dust control systems that provide
a sufficient air flow and filter with 99% collection effi-
ciency, in addition to wearing respirators with APF 10
when working more than 4 h/shift (OSHA, 2016b).
Crushing tenders had the highest personal exposures
measured among all workers in demolition and crush-
ing sites. About 50% of the personal samples on crush-
ing tenders had RCS concentrations higher than the new
OSHA PEL. The highest RCS exposures measured would
have exceeded the PEL within 2 h of the crushing ten-
ders job. Crushing tenders generally work at this task
over 8 h per day, so their task exposures are expected to
be similar to their daily TWA exposures. The use of an
N95 dust mask with APF 10 ensures compliance with
the OSHA PEL of 50 µg/m3
for these jobs. All crushing
tenders at site C wore N95 respirators, while the crush-
ing tender at site B did not wear any respirator. The ef-
fectiveness of material wetting on exposure reduction
was shown at site B, where significantly lower exposures
were found from a sample collected when the material
was wet a day after raining (21 µg/m3
) compared to a
sample collected in a dry day (121 µg/m3
). Data from site
C show that exposures of crushing tenders were reduced
to under the 50 µg/m3
when the water spraying system
was applied, but not when the water cannon machine
was used. The water spraying system is potentially more
effective for reducing dust levels during crushing activi-
ties since it targets the material at the source while the
water cannon targets the dust after its suspension in the
air. In addition, the effectiveness of the water cannon
is determined by the size of water droplets that collide
with dust particles present in the air. Smaller size drop-
lets (10–50 µm) have shown to be more effective on
reducing dust levels in the air (Colinet et al., 2010) com-
pared to larger droplets (100 µm) generated by the water
cannon used as part of this study. Redesigned wet dust
suppression systems that generate smaller water droplets
could potentially be more effective in reducing expo-
sures to RD particles. Furthermore, detailed particle size
distribution measurements during these activities could
inform designing more effective control measures.
Our findings support the OSHA ‘Table 1’ specifica-
tion that use of crushing equipment with water spraying
systems at transfer points does not require additional re-
spiratory protection. In their technical feasibility report,
OSHA specifies that the spray nozzles should be located
upstream of dust generation points to ensure that the
material is sufficiently wetted (OSHA, 2016b). However,
high exposures among crushing tenders we report here
support the need for implementation of dust controls
and suggest that respiratory protection may also be
needed when water suppression is inadequate. Other
controls listed in OSHA’s ‘Table 1’ include remote con-
trol stations and ventilated, climate-controlled control
booths. In addition, local exhaust ventilation systems
(LEV) can be used to reduce exposures to very fine par-
ticles that can’t be captured by wet suppression methods
(Colinet et al., 2010). The number of workers at risk for
this occupation is ~30,000 and the highest employment
rates are in large states such as California and Texas
(Bureau of Labor Statistics, 2016). The demand for
crushing-related jobs will likely increase as the need to
reduce recycling cost and to obtain LEED certification
for reuse on site increases.
Occupational exposures of heavy machine operators
in both demolition and crushing sites were the lowest
we measured, much lower than PEL of 50 µg/m3
. Heavy
machine operators typically work in enclosed cab-
ins, presenting a physical barrier to airborne particles.
Exposures of laborers at the demolition site A, where
dust suppression methods were used continuously, were
lower than the OSHA PEL. These results are comparable
with the data presented in Table IV.5.3-B of the OSHA
new standard technological feasibility chapter (OSHA,
2016b). It should be noted that none of the operating
engineers and laborers in this study used respirators.
Rappaport et al. reported that the use of ventilated cabs
reduced exposures by ~6-fold for operating engineers
and that the use of wet dust suppression reduced signifi-
cantly RCS exposures by 3-fold for laborers (Rappaport
et al., 2003). Our findings support ‘Table 1’ of the OSHA
standard, where respiratory protection is not required
when heavy equipment operators working in demoli-
tion activities operate the equipment in enclosed cabs or
when workers are outside the cab during demolition if
dust suppression methods or water are used to reduce
exposures.
Concentrations of RCS and RD in area samples
at demolition and crushing sites were much lower
compared to the personal samples. Area exposures
varied widely by site due to the variety of site activi-
ties and their duration per day, sample location, and
dust controls used. Results show significantly higher
RCS and RD levels at the perimeter of the crushing
site (10–15 m from the center of activity) compared
to the perimeter of the demolition sites. This results
could be related to a number of factors: (i) higher
silica content in the material being crushed at site C
(17.8% compared to 10.2% quartz in the demolished
material); (ii) greater physical barriers surrounding
site C: about two-third of the perimeter of the crush-
ing site was surrounded by large piles of demolition
10.
Annals of WorkExposures and Health, 2019, Vol. 63, No. 143
materials and other small buildings that potentially
prevented dust movement in the open environment;
and (iii) water cannon at the crushing site covered only
a portion of the site and was unable to cover all three
crushing machines. The difference on area exposures at
two demolition sites could be related to the duration
of activities within a day and between different days.
For example, demolition the multi-story building at
site A lasted during the entire shift while demolition of
the two-story buildings at site B was completed within
2–3 h and the rest of daily activities involved material
sorting. Area sampling results at demolition sites are
comparable with the results of a recent study by Stacey
et al. (Stacey et al., 2018). This study reported upwind
and downwind levels of RCS at three demolition sites
in UK (n = 22) that ranged from LOD-11.5 μg/m3
com-
pared to the range of LOD-12 μg/m3
we report here
(Table 3). Overall, our results provide evidence of low
RCS exposures within the perimeter of demolition sites,
suggesting that bystanders may not need respirators
when performing different tasks within the grounds of
demolition sites.
Due to the modest sample size, we had limited
statistical power to detect statistically significant dif-
ferences in exposures and our results cannot provide
any conclusive evidence on the efficacy of water can-
nons for reducing RD exposures. Data from demoli-
tion site B indicate that dust exposures ‘with’ water
cannon were lower compared to exposures measured
‘without’ any controls, however, these results were not
statistically significant. On the contrary, dust expo-
sures at site A were significantly higher when the water
cannon was used. This conflicting evidence could be
related to high exposures on the first day of demolition
when the water cannon was used compared to other
sampling days at site A. Our work observations show
that at the beginning of demolition jobs exposures are
elevated since the work involves mostly wall destruc-
tion, then most of the work involves material sorting
which results in less visible dust. Furthermore, data
from the crushing site did not provide any supporting
evidence on the efficacy of water cannon for reducing
dust concentrations. The variability of activities per-
formed from one day to another, from one site to an-
other can negatively impact the analysis of the efficacy
of controls in field investigations. The use of dust sup-
pression methods in sites A and C was driven mostly
by local environmental regulations/guidelines to pre-
vent exposures of surrounding communities. Future
field investigations are needed to evaluate the efficacy
of water cannons for reducing workers’ exposure at
demolition and crushing sites.
Conclusions
Controlling or reducing crystalline silica exposures to lev-
els under the OSHA PEL of 50 µg/m3
remains challeng-
ing. Even with the use of water suppression, respiratory
protection may be required for chipping at substructure
bridge repairs and some crushing tasks. Application of
effective engineering controls is essential for reducing
exposures among chipping workers. The use of dust sup-
pression methods at demolition sites can be effective in
reducing TWA daily exposures, nevertheless workers and
bystanders are exposed to high short-term peak expo-
sures for which occupational standards do not exist.
Supplementary Data
Supplementary data are available at Annals of Work
Exposures and Health online.
Funding
This study was supported by the National Institute for
Occupational Safety and Health (NIOSH) and The Center
for Construction Research and Training (CPWR) grant
U60-OH009762. The contents of this article are solely the re-
sponsibility of the authors and do not necessary represent the
official views of NIOSH.
Acknowledgement
We thank all construction partners for their support and work-
ers who participated in air sampling.
References
Bello D, Virji MA, Kalil AJ et al. (2002) Quantification of res-
pirable, thoracic, and inhalable quartz exposures by FT-IR
in personal impactor samples from construction sites. Appl
Occup Environ Hyg; 17: 580–90.
Bureau of Labor Statistics. (2016) Occupational employment
and wages. Crushing, grinding, and polishing machine set-
ters, operators, and tenders. Available at https://www.bls.
gov/oes/current/oes519021.htm
Colinet JF, Cecala AB, Chekan GJ, et al. (2010). Best practices
for dust control in metal/nonmetal mining. Pittsburgh, PA:
U.S. Department of Health and Human Services, Public
Health Service, Centers for Disease Control and Prevention,
National Institute for Occupational Safety and Health,
DHHS (NIOSH) Publication No. 2010–132, (IC 9521),
pp. 1–75. Available at: https://www.cdc.gov/niosh/mining/
works/coversheet192.html
Croghan CW, Egeghy PP. (2003) Methods of dealing with values
below the limit of detection using sas. Available at https://
analytics.ncsu.edu/sesug/2003/SD08-Croghan.pdf
11.
44 Annals ofWork Exposures and Health, 2019, Vol. 63, No. 1
Dahm MM, Evans DE, Schubauer-Berigan MK et al. (2013)
Occupational exposure assessment in carbon nanotube and
nanofiber primary and secondary manufacturers: mobile
direct-reading sampling. Ann Occup Hyg; 57: 328–44.
Echt A, Sieber K, Jones E et al. (2003) Control of respirable dust
and crystalline silica from breaking concrete with a jack-
hammer. Appl Occup Environ Hyg; 18: 491–5.
Hornung RW, Reed LD. (1990) Estimation of average concen-
tration in the presence of nondetectable values. Appl Occup
Environ Hyg; 5: 46–51.
IARC. (1997) Silica, some silicates, coal dust and para-aramid
fibrils. Monograph on the evaluation of the carcinogenic risk
of chemicals to humans. Vol. 68. Lyon, France: IARC Press.
Jin Y, Hein MJ, Deddens JA et al. (2011) Analysis of lognor-
mally distributed exposure data with repeated measures and
values below the limit of detection using SAS. Ann Occup
Hyg; 55: 97–112.
NTP. (2011) Report on carcinogens, 12th edn. Department of
Health and Human Services. Available at https://www.ncbi.
nlm.nih.gov/pubmed/21822324
OSHA. (2013) Osha fact sheet: proposed crystalline silica
rule: overview. Available at https://www.osha.gov/silica/
factsheets/OSHA_FS-3683_Silica_Overview.html
OSHA. (2016a) Federal register: occupational exposure to res-
pirable crystalline silica; final rule. Available at https://www.
osha.gov/FedReg_osha_pdf/FED20160325B.pdf
OSHA. (2016b) Chapter iv: technological feasibility. Final res-
pirable crystalline silica standard. Available at https://www.
osha.gov/FedReg_osha_pdf/FED20160325B.pdf
OSHA. (2016c) Technical and analytical support for osha’s
final economic analysis for final respirable crystalline silica
standard. Available at https://www.osha.gov/FedReg_osha_
pdf/FED20160325B.pdf
Rappaport SM, Goldberg M, Susi P et al. (2003) Excessive ex-
posure to silica in the US construction industry. Ann Occup
Hyg; 47: 111–22.
Sauve JF, Beaudry C, Bégin D et al. (2013) Silica exposure dur-
ing construction activities: statistical modeling of task-based
measurements from the literature. Ann Occup Hyg; 57:
432–43.
Shepherd S, Woskie SR, Holcroft C et al. (2009) Reducing silica
and dust exposures in construction during use of powered
concrete-cutting hand tools: efficacy of local exhaust ven-
tilation on hammer drills. J Occup Environ Hyg; 6: 42–51.
Stacey P, Thorpe A, Roberts P et al. (2018) Determination of
respirable-sized crystalline silica in different ambient envi-
ronments in the United Kingdom with a mobile high flow
rate sampler utilising porous foams to achieve the required
particle size selection. Atmos Environ; 182: 51–7.
Virji MA, Bello D, Woskie SR et al. (2002) Analysis of quartz
by FT-IR in air samples of construction dust. Appl Occup
Environ Hyg; 17: 165–75.