AQI AI: High-Resolution Surface Air Quality & HCHO Hotspot Mapping Across India Using Satellite Data
Leveraging satellite remote sensing, meteorology, and machine learning to estimate surface AQI and detect formaldehyde hotspots for public health and policy in India.
AQI AI: High-Resolution Surface Air Quality & HCHO Hotspot Mapping Across India Using Satellite Data
1.
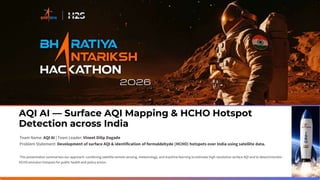
AQI AI —Surface AQI Mapping & HCHO Hotspot
Detection across India
Team Name: AQI AI | Team Leader: Vineet Dilip Dagade
Problem Statement: Development of surface AQI & identification of formaldehyde (HCHO) hotspots over India using satellite data.
This presentation summarises our approach: combining satellite remote sensing, meteorology, and machine learning to estimate high-resolution surface AQI and to detect/monitor
HCHO emission hotspots for public health and policy action.
2.
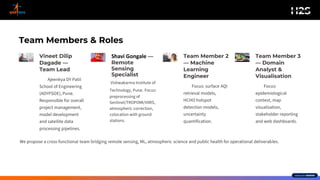
Team Members &Roles
Vineet Dilip
Dagade —
Team Lead
Ajeenkya DY Patil
School of Engineering
(ADYPSOE), Pune.
Responsible for overall
project management,
model development
and satellite data
processing pipelines.
Shavi Gongale —
Remote
Sensing
Specialist
Vishwakarma Institute of
Technology, Pune. Focus:
preprocessing of
Sentinel/TROPOMI/VIIRS,
atmospheric correction,
colocation with ground
stations.
Team Member 2
— Machine
Learning
Engineer
Focus: surface AQI
retrieval models,
HCHO hotspot
detection models,
uncertainty
quantification.
Team Member 3
— Domain
Analyst &
Visualisation
Focus:
epidemiological
context, map
visualisation,
stakeholder reporting
and web dashboards.
We propose a cross-functional team bridging remote sensing, ML, atmospheric science and public health for operational deliverables.
3.
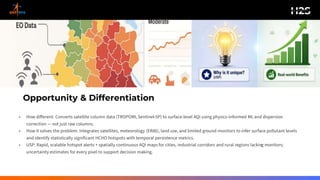
Opportunity & Differentiation
•How different: Converts satellite column data (TROPOMI, Sentinel-5P) to surface-level AQI using physics-informed ML and dispersion
correction — not just raw columns.
• How it solves the problem: Integrates satellites, meteorology (ERA5), land use, and limited ground monitors to infer surface pollutant levels
and identify statistically significant HCHO hotspots with temporal persistence metrics.
• USP: Rapid, scalable hotspot alerts + spatially continuous AQI maps for cities, industrial corridors and rural regions lacking monitors;
uncertainty estimates for every pixel to support decision making.
4.
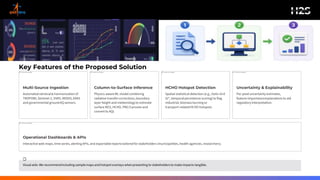
Key Features ofthe Proposed Solution
1
Multi-Source Ingestion
Automatedretrieval& harmonisationof
TROPOMI,Sentinel-2, VIIRS, MODIS, ERA5
and governmental groundAQ sensors.
2
Column-to-Surface Inference
Physics-awareML modelcombining
radiative transfer corrections,boundary
layer height and meteorologyto estimate
surface NO2, HCHO, PM2.5 proxies and
convertto AQI.
3
HCHO Hotspot Detection
Spatial statistical detection (e.g., Getis-Ord
Gi*, temporalpersistence scoring)to flag
industrial, biomass burning or
transport-relatedHCHO hotspots.
4
Uncertainty & Explainability
Per-pixel uncertainty estimates,
feature-importanceexplanations to aid
regulatoryinterpretation.
5
Operational Dashboards & APIs
Interactive web maps, time series, alerting APIs, and exportablereports tailored for stakeholders (municipalities, health agencies, researchers).
Visual aids: We recommendincluding samplemaps and hotspot overlays whenpresenting to stakeholdersto make impacts tangible.
5.
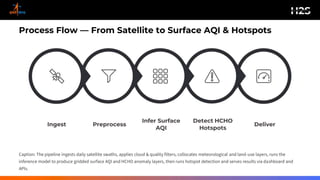
Process Flow —From Satellite to Surface AQI & Hotspots
Deliver
Detect HCHO
Hotspots
Infer Surface
AQI
Preprocess
Ingest
Caption: The pipeline ingests daily satellite swaths, applies cloud & quality filters, collocates meteorological and land-use layers, runs the
inference model to produce gridded surface AQI and HCHO anomaly layers, then runs hotspot detection and serves results via dashboard and
APIs.
6.
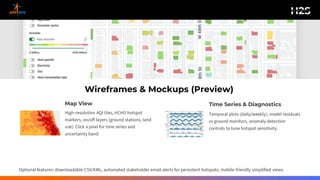
Wireframes & Mockups(Preview)
Map View
High-resolution AQI tiles, HCHO hotspot
markers, on/off layers (ground stations, land
use). Click a pixel for time series and
uncertainty band.
Time Series & Diagnostics
Temporal plots (daily/weekly), model residuals
vs ground monitors, anomaly detection
controls to tune hotspot sensitivity.
Optional features: downloadable CSV/KML, automated stakeholder email alerts for persistent hotspots, mobile-friendly simplified views.
7.
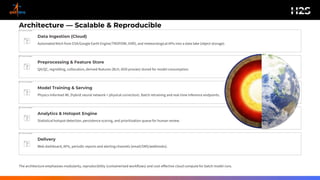
Architecture — Scalable& Reproducible
Data Ingestion (Cloud)
Automated fetch from ESA/Google Earth Engine/TROPOMI, VIIRS, and meteorological APIs into a data lake (object storage).
Preprocessing & Feature Store
QA/QC, regridding, collocation, derived features (BLH, AOD proxies) stored for model consumption.
Model Training & Serving
Physics-informed ML (hybrid neural network + physical correction). Batch retraining and real-time inference endpoints.
Analytics & Hotspot Engine
Statistical hotspot detection, persistence scoring, and prioritisation queue for human review.
Delivery
Web dashboard, APIs, periodic reports and alerting channels (email/SMS/webhooks).
The architecture emphasises modularity, reproducibility (containerised workflows) and cost-effective cloud compute for batch model runs.
9.
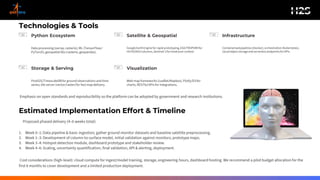
Technologies & Tools
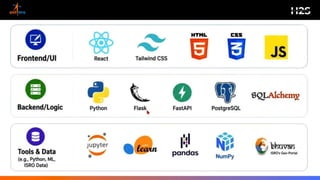
PythonEcosystem
Data processing(xarray,rasterio), ML (TensorFlow/
PyTorch),geospatial libs (rasterio, geopandas).
Satellite & Geospatial
GoogleEarthEngine for rapid prototyping,ESA/TROPOMIfor
HCHO/NO2columns,Sentinel-2for landcovercontext.
Infrastructure
Containerisedpipelines(Docker),orchestration(Kubernetes),
cloudobject storageand serverlessendpointsfor APIs.
Storage & Serving
PostGIS/TimescaleDBfor ground observations and time
series; tile server (vector/raster)for fast map delivery.
Visualization
Web map frameworks (Leaflet/Mapbox),Plotly/D3for
charts, RESTful APIs for integrations.
Emphasis on open standards and reproducibility so the platform can be adopted by government and research institutions.
Estimated Implementation Effort & Timeline
Proposed phased delivery (4–6 weeks total):
1. Week 0–1: Data pipeline & basic ingestion; gather ground monitor datasets and baseline satellite preprocessing.
2. Week 1–3: Development of column-to-surface model, initial validation against monitors; prototype maps.
3. Week 3–4: Hotspot detection module, dashboard prototype and stakeholder review.
4. Week 4–6: Scaling, uncertainty quantification, final validation, API & alerting, deployment.
Cost considerations (high-level): cloud compute for ingest/model training, storage, engineering hours, dashboard hosting. We recommend a pilot budget allocation for the
first 6 months to cover development and a limited production deployment.
11.
AQI AI —Development of surface AQI & HCHO Hotspot Identification over India using Satellite Data
Contact:Vineet Dilip Dagade (7264802008)
College: Ajeenkya DY Patil School of Engineering (ADYPSOE), Pune