Direct Contention Identification Using Oracle’s Session Wait Virtual Tables 
Craig A. Shallahamer 
OraPub, Inc. (http://www.europa.com/~orapub) 
1. Abstract 
With the introduction of the session wait family of 
virtual performance tables, standard performance 
tuning practices have been radically changed. No 
longer is it necessary to gather volumes of data, cal-culate 
a seemingly ever growing number of perform-ance 
ratios, and then finally perform analysis. 
Through the session wait views, Oracle database sys-tems 
“tell” performance specialists specifically where 
contention resides and what is causing the contention. 
This dramatically reduces problem identification time 
so more time can spent on problem resolution analy-sis. 
This paper explains how one can use the session 
wait views to quickly identify contention, discusses 
various scripts to quickly empower one, and presents 
techniques to shift one’s thinking from traditional ra-tio 
analysis to direct problem identification. 
2. Introduction 
An optimized computing system benefits many. Us-ers 
are able to perform their work in a timely manner 
and without interruption, computing system adminis-trators 
can concentrate on other work, and the busi-ness 
can function without anyone thinking about the 
information system. Unfortunately this is rarely the 
case. 
With the introduction of Oracle7, a new and direct 
method of detecting contention and diagnosing prob-lems 
was made available. With the desire for an op-timized 
system, the professional community’s seem-ingly 
endless affair for traditional contention 
identification methods, and the introduction of new 
methods, have left the database administrator some-what 
confused, surely misdirected, resulting in wasted 
time and money, non-optimal computing system per-formance, 
and decreased system stability. 
Exceptional performance tuning papers are extremely 
rare. Virag Saksena’s papers (see references) are 
truly exceptional and cover areas not mentioned in 
this paper and briefly touch upon some of the areas 
covered in this paper. This paper was written to spe-cifically 
inform performance specialists about the 
new method of contention identification using Ora-cle’s 
session wait virtual tables. 
To accomplish this task, this paper first presents de-tails 
about the session wait family of virtual perform-ance 
tables, then discusses the methodology differ-ences 
with using session wait statistics as opposed to 
the traditional ratio methods, and finally a very real 
case study is presented, dissected, and analyzed. 
3. Session Wait Statistics 
A baby and an adult both have a sore throat. When 
asked by the doctor, “What’s wrong?” the baby will 
look at the doctor and scream (trust me, I know.), 
whereas the adult will present attributes about the 
pain. This not so subtle difference directs the doctor 
towards different problem identification methods. 
With the baby, the doctor must perform many tests, 
gather the data, consolidate the data, perform analy-sis, 
determine the problem, and make recommenda-tions. 
With an adult, he simply asks a few questions 
and then can immediately begins a more detailed ex-amination. 
Starting with Oracle7, the Oracle server “acts like an 
adult.” The session wait statistics tells one exactly 
“what hurts.” Whereas with earlier versions of the 
sever, one had to perform costly ratio based analysis 
to determine where the “pain” was originating from. 
3.1 “There is always a bottleneck” 
Don’t fall into the trap of saying, “My system’s slow 
but there is no bottleneck.” To summarize, you’re 
wrong. There is always a bottleneck. If not, com-puting 
systems would run infinitely fast. The fastest 
car on the biggest highway continually faces bottle-necks. 
It could be the number of cars on the freeway, 
the number of lanes, the weather, an accident ahead, 
the type of petrol, the skill of the driver, the car de-sign, 
the engine design, the wind direction, one’s per-sonal 
risk quotient, one’s respect for others, and the 
list goes on. But there is always a bottleneck. 
In an Oracle system, even a highly tuned Oracle sys-tem, 
there is always a bottleneck. Processes are al-
ways waiting for some resource. It could be data al-ready 
in the SGA, data residing on disk, a latch (seri-alizing 
execution for a piece of server kernel code), 
an enqueue (access to an internal structure), a lock 
(access to a user defined structure), or many other 
items. But the bottom line is, there is always a bot-tleneck, 
a session is always waiting for something 
(either to start something or waiting for it to finish), 
and the session wait statistics tells one exactly what a 
specific session is specifically waiting for. 
3.2 Session Wait Views 
There is actually a family of session wait based 
views. Each view has a special purpose and they 
compliment each other providing direction for per-formance 
specialists. The virtual tables are 
v$system_event, v$session_event, and 
v$session_wait. Each virtual table along with an 
actual script and real-life output is presented below. 
3.2.1 High level system perspective using 
v$system_event 
The v$system_event view looks at sessions at a high-level 
perspective. It doesn’t report which specific 
session is waiting for which specific resource or ob-ject. 
It sums all the waits since the database instance 
was last started by wait category. As with all “in-stance 
accumulating” statistics (e.g., v$sysstat), col-lecting 
and reporting the differences over periods of 
time is much more useful than a single query.[Total 
Performance Management] 
There are only five columns in the v$system_event 
view. Each is presented below. 
· Event. This is simply the general name of the 
event. While there are many wait events, the 
most common events are latch waits, db file 
scattered read, db file sequential read, en-queue 
wait, buffer busy wait, and free buffer 
waits. While I will be detailing the most com-mon 
events, presenting each wait event is out of 
scope for this paper. To get details about other 
events one is experiencing, contact an Oracle 
representative or search the WWW. 
· Total_waits. This is the total number of waits, 
i.e., a count, for the specific event since the da-tabase 
instance has started. 
· Total_timeouts. This is the total number of 
wait time-outs, i.e., a count, for the specific 
event since the database instance has started. 
Not all waits result in a time-out. Some waits 
will try “forever” (an exponential back-off algo-rithm 
is sometimes used) while others will try 
once or a few times, stop, and perform some 
coded action. 
· Time_waited. This is the total time, in milli-seconds, 
all sessions have waited for the specific 
event since the database instance has started. 
· Average_wait. This is the average time, in 
milliseconds, all sessions have waited for the 
specific event since the database instance has 
started. As one would expect, this should equal 
time_waited divided by total_waits. 
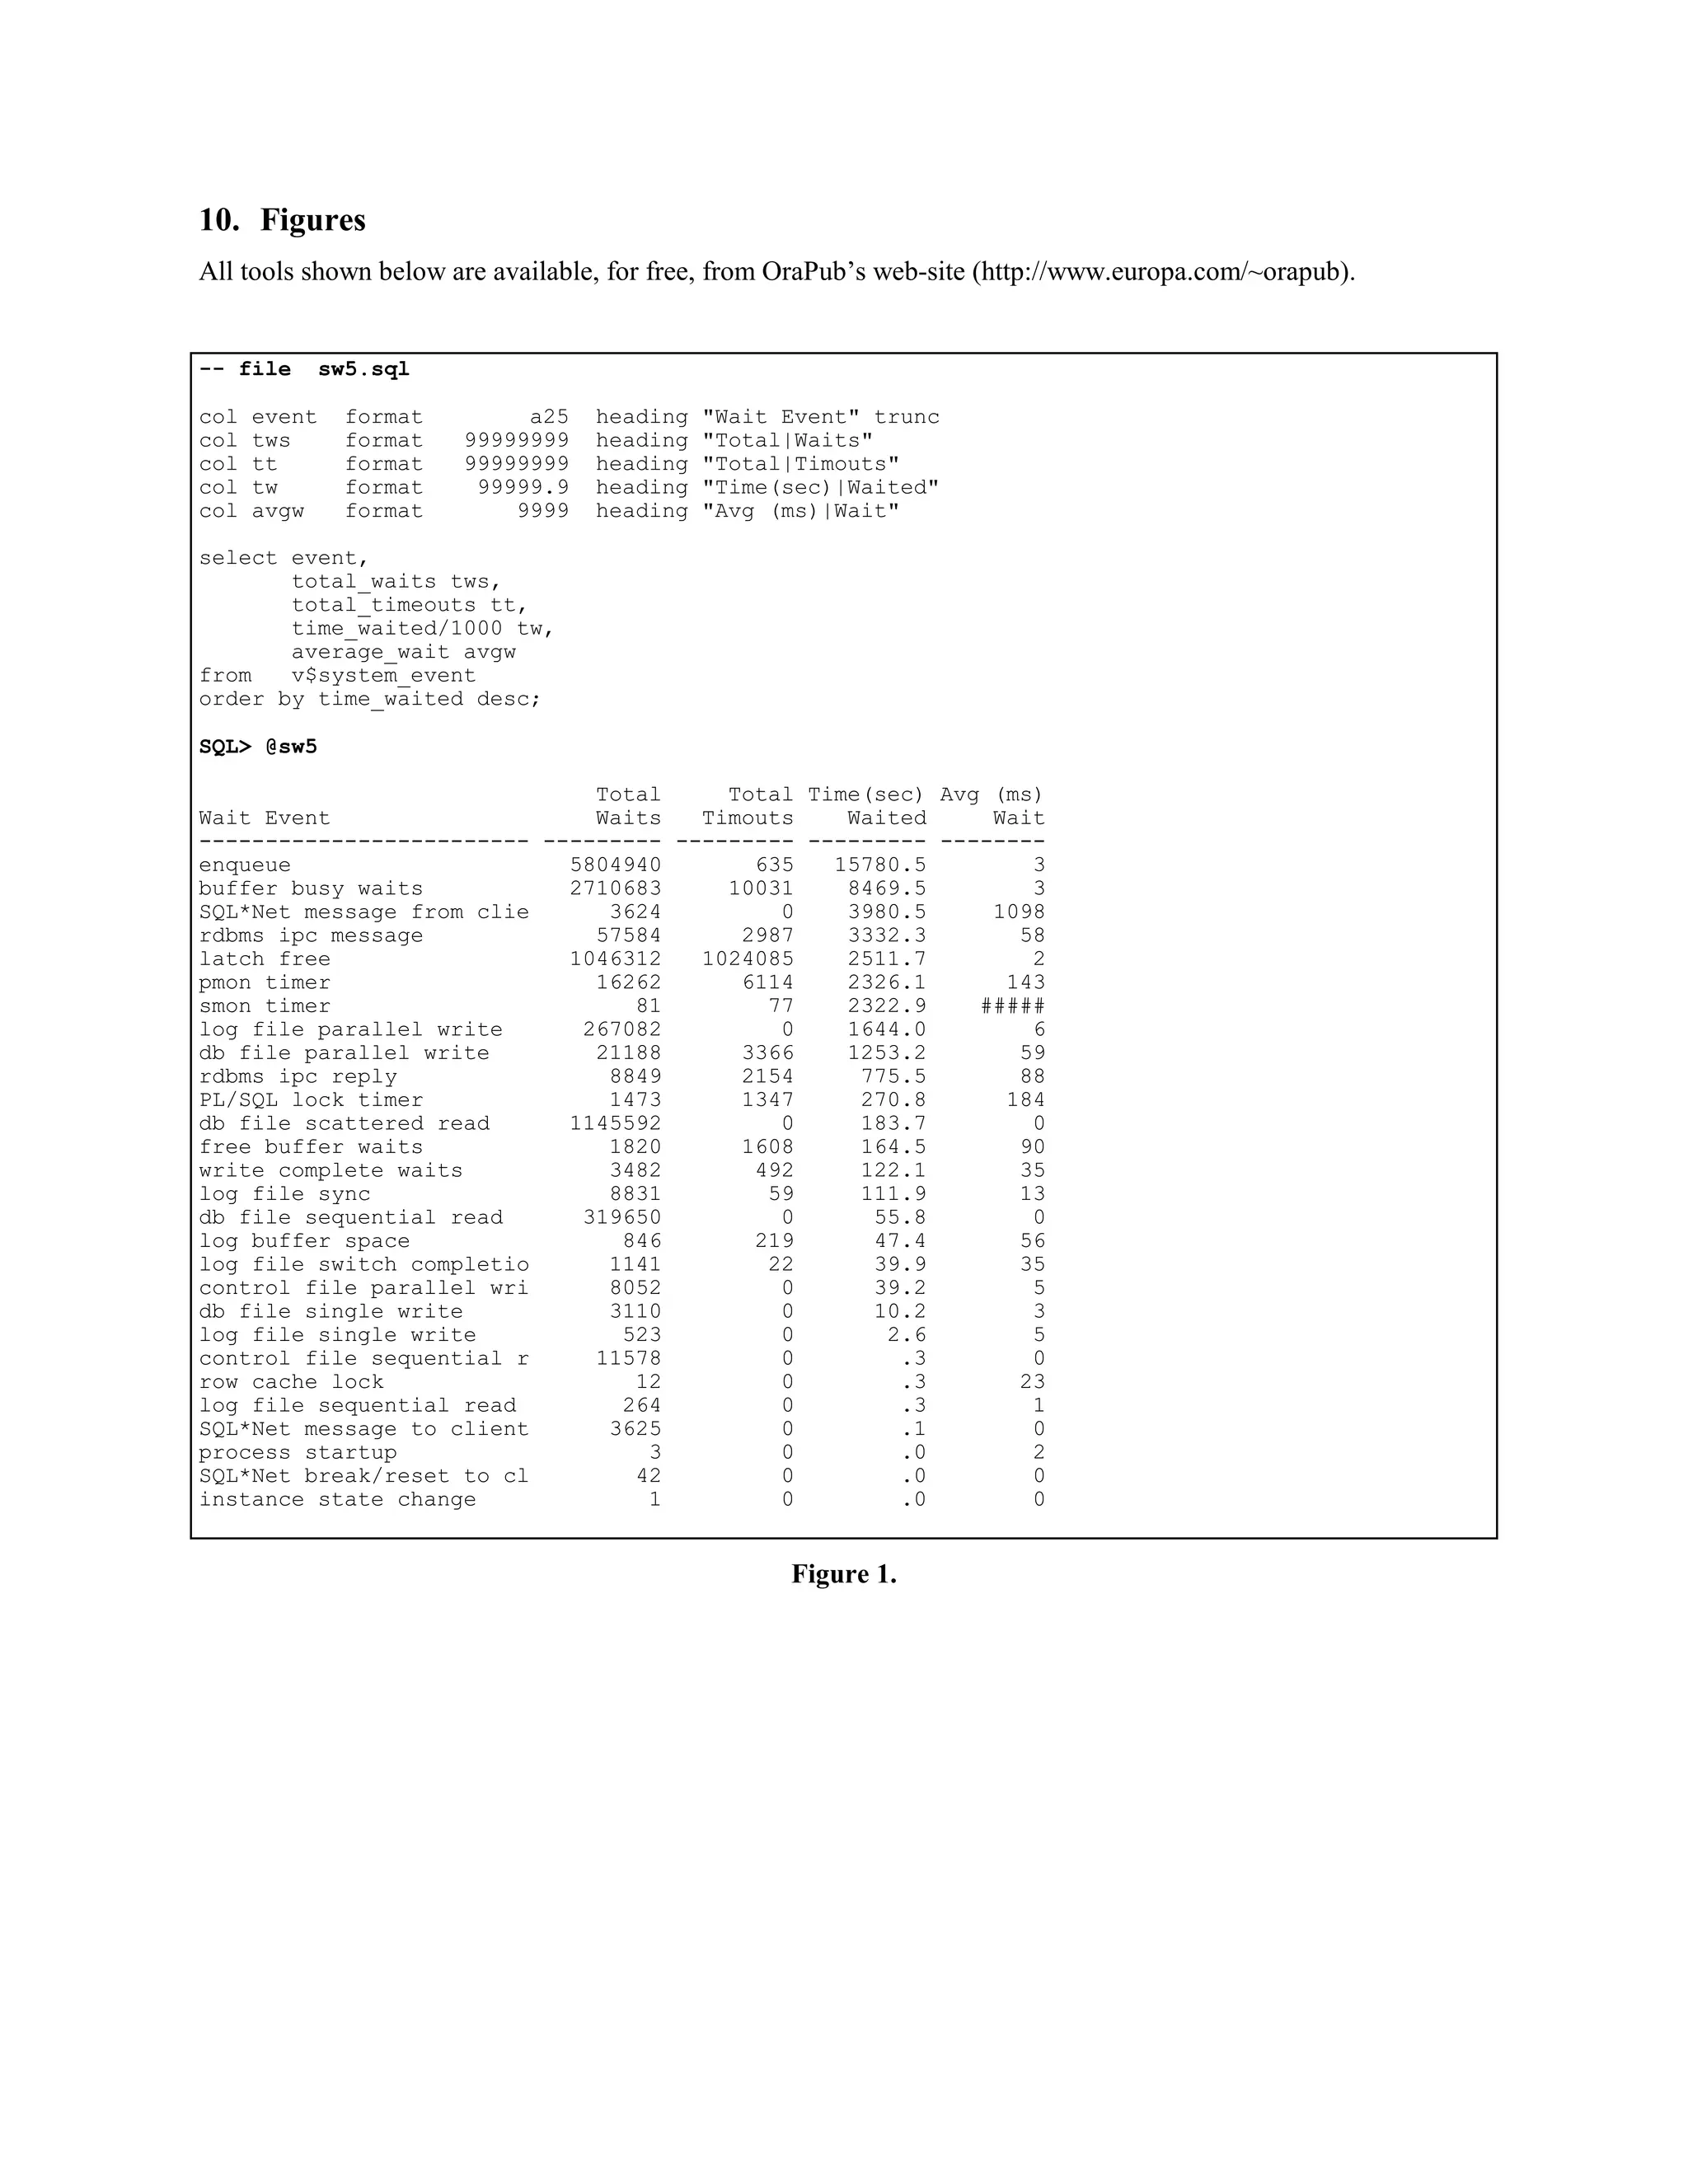
Figure 1. presents a v$system_event based tool and 
sample output. Figure 1. clearly shows sessions 
waiting for enqueues, busy database block buffers, 
latches, and database files. Each of these common 
waits will be discussed in this paper. Once the over-all 
system has been examined, one drills-down into 
each one of the significant wait areas, which we begin 
presenting below. 
3.2.2 High level session perspective using 
v$session_event 
The v$session_event virtual view presents exactly 
the same information as the v$system_event virtual 
view except it includes the session id for each event 
and information is “zeroed” out after a session logs 
off. For example, if session ten’s statistics suddenly 
drop, that’s because session ten just logged off and 
another session logged in and was assigned session 
number ten. 
This view is very useful for determining which ses-sions 
are causing or experiencing the most waits and 
then drilling down into the contention specifics. 
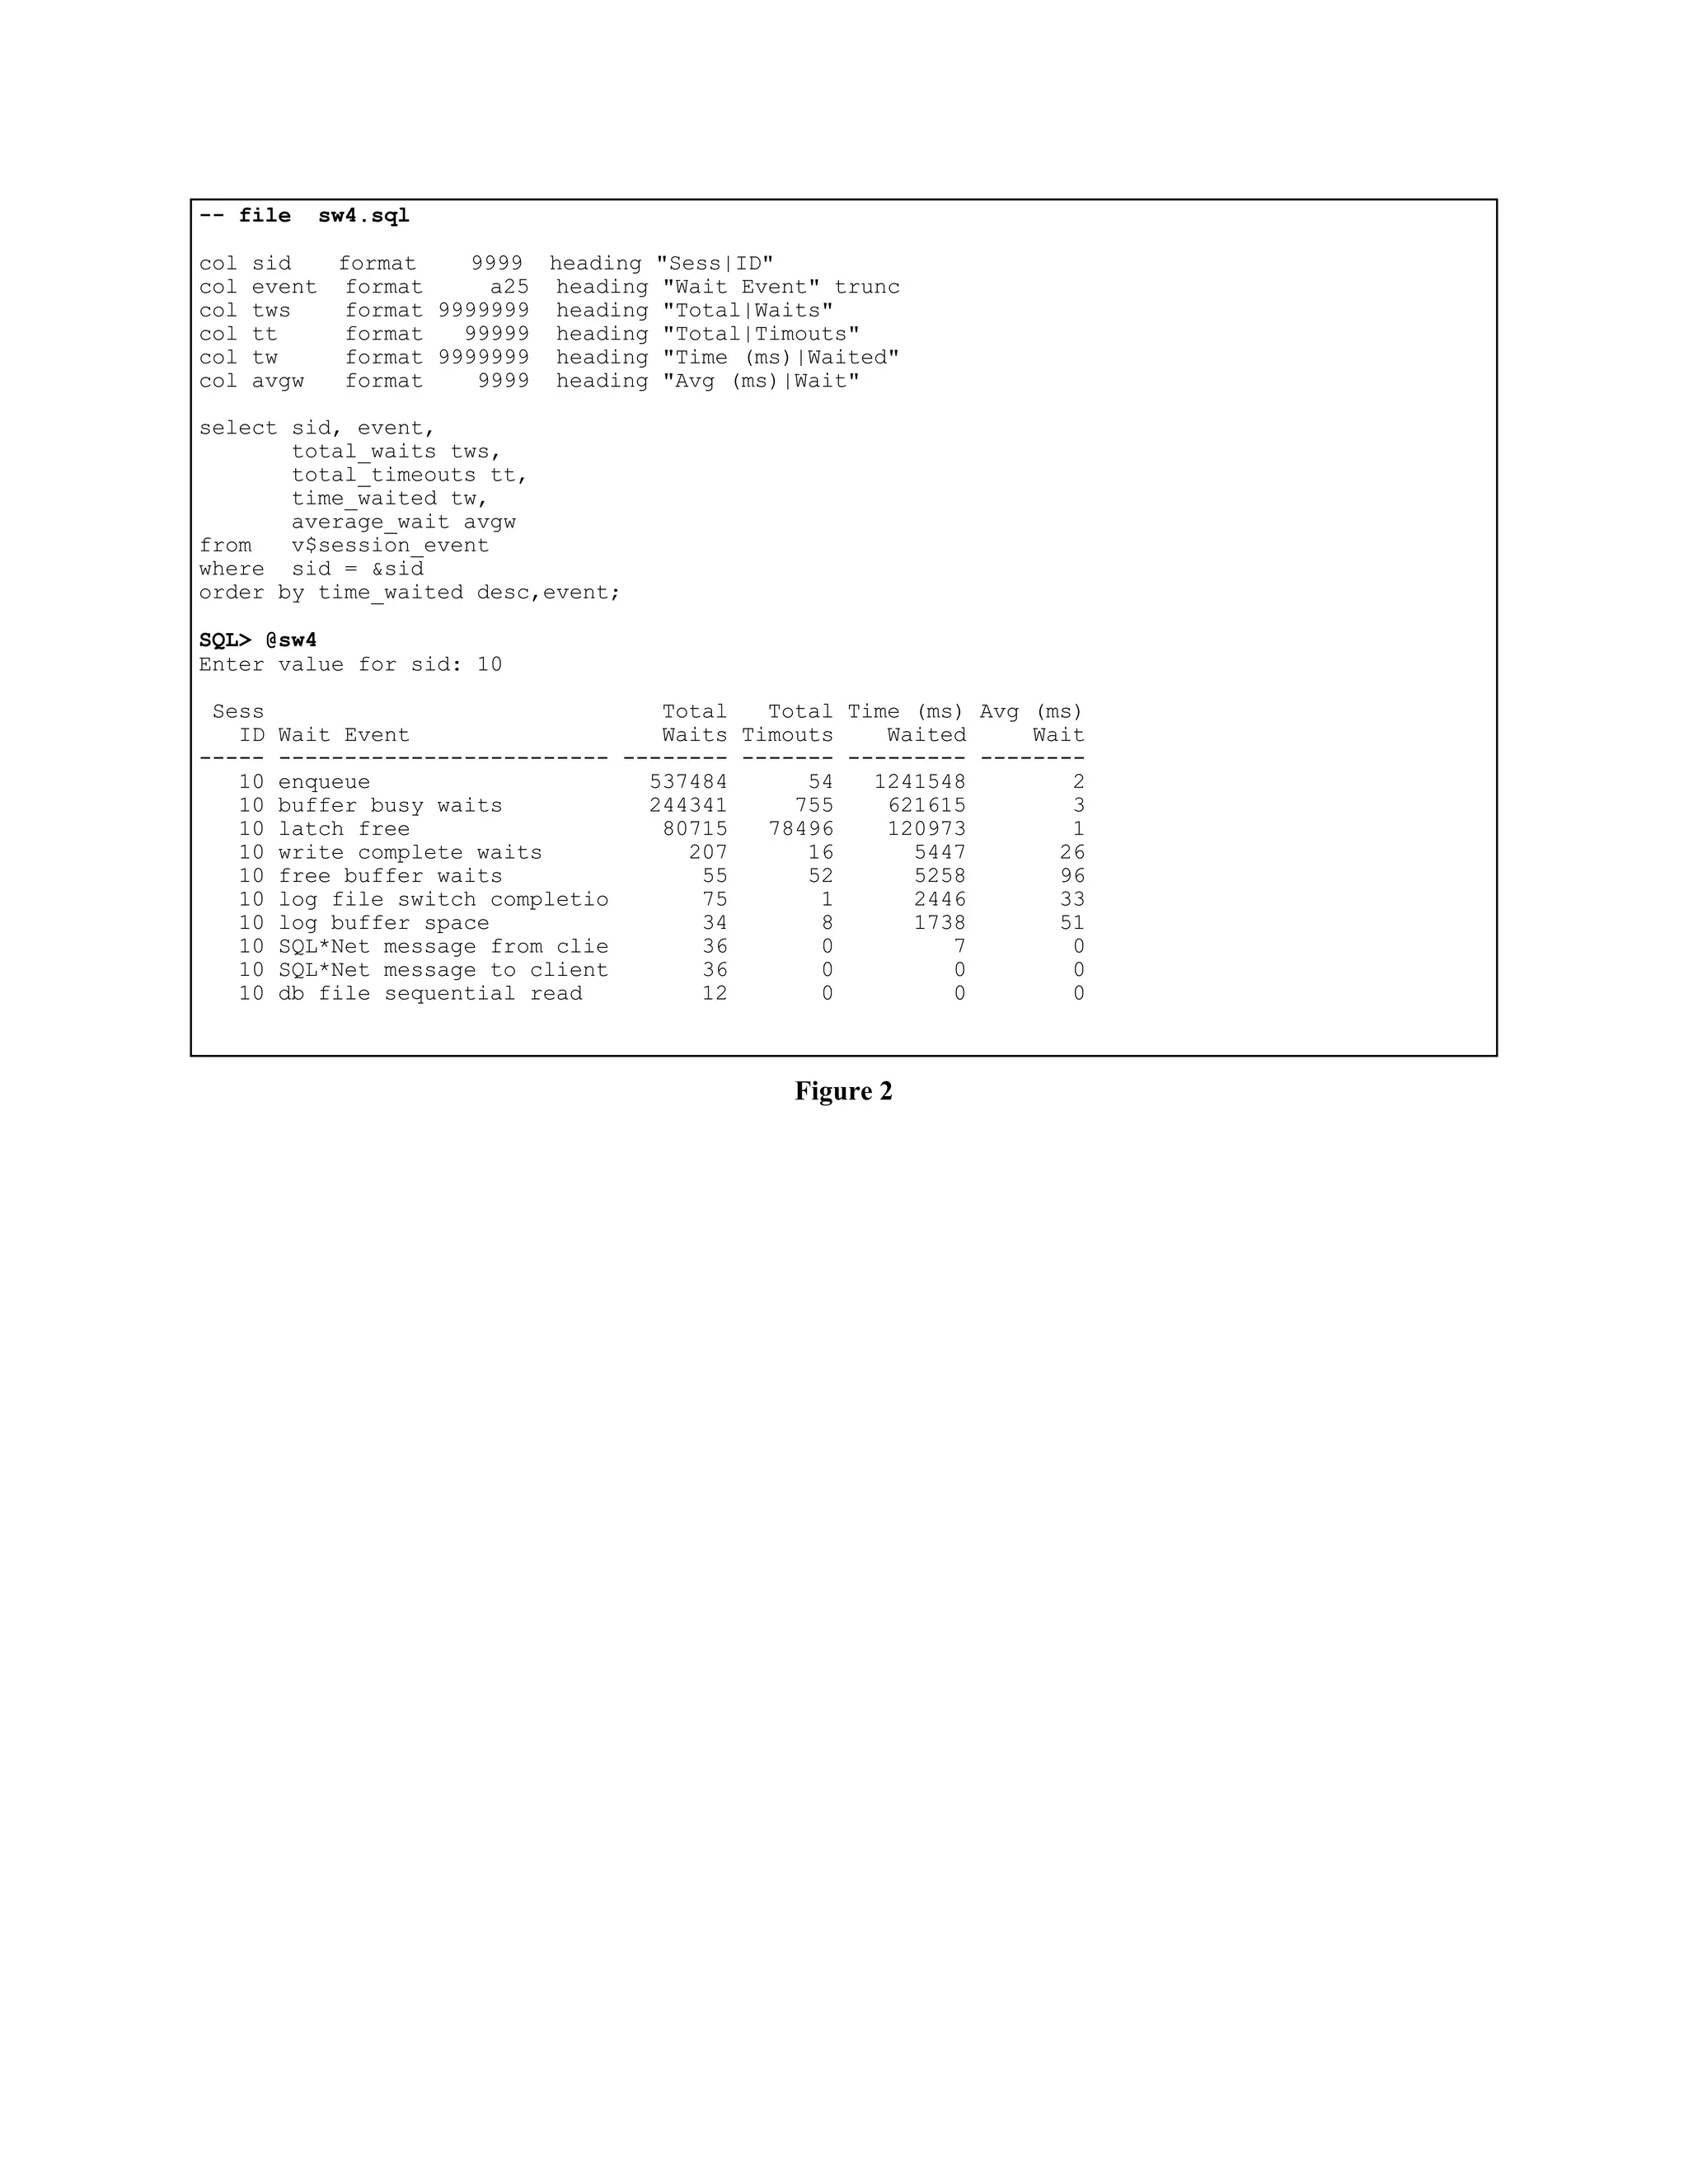
Figure 2 below presents a v$session_event based tool 
and sample output. In situations where the session id 
is not known or is not relevant, one could execute the 
Figure 2 script without the session id filter. In the ex-ample 
shown, session id is asked for and supplied. 
Figure 2 clearly shows that session ten is experienc-ing 
significant enqueue, buffer busy, and latch waits. 
As we will see, this combination points towards ex-cessive 
buffer activity typically caused by poorly 
tuned SQL, poor application design, or both. 
3.2.3 Low level session perspective using 
v$session_wait 
The v$session_wait view is the most complicated 
and the most misunderstood of the session wait fam-
ily. I suppose this is because unlike the 
v$system_event and the v$session_event view, the 
v$session_wait view reports session level wait in-formation 
in real-time. It does not store or summa-rize 
information, but rather dumps out the raw infor-mation 
as it’s occurring. 
Activity in an Oracle database occurs very, very fast 
(as opposed to other database vendors of course), so 
even quickly re-running a v$session_wait query may 
look totally different than a split-second before. 
Don’t be alarmed by this, but rather understand why 
this occurs. 
In addition to presenting information in real-time, the 
v$session_wait view provides detailed and specific 
information about the actual waits. For example, it 
will direct one to sessions experiencing latch conten-tion 
and show which latch the sessions are waiting 
for. Or, if a session is waiting for access to a block, 
the actual database file number and data block num-ber 
are provided. 
The v$session_wait view also presents timing details, 
much like the v$system_event and v$session_event 
views. However, because of the v$session_wait’s 
real-time reporting, the times presented mean differ-ent 
things depending on the wait situation. This is 
explained in more detail below. 
The v$session_wait columns are presented below. 
· Sid. The session id number. The same as the 
session id number in v$session_event and 
v$session. 
· Seq#. The internal sequence number of the wait 
for this session. Use this column to determine 
the number of waits, i.e. counts, the session has 
experienced. 
· Event. This is simply the general name of the 
event. While there are many wait events, the 
most common events are latch waits, db file 
scattered read, db file sequential read, en-queue 
wait, buffer busy wait, and free buffer 
waits. While I will be detailing the most com-mon 
events, presenting each wait event is out of 
scope for this paper. To get details about other 
events one is experiencing, contact an Oracle 
representative or search the WWW 
· P[1-3]. These three parameters are pointers to 
more details about the specific wait. The pa-rameters 
are foreign keys to other views and are 
wait event dependent. For example, for latch 
waits, p2 is the latch number, which is a foreign 
key to v$latch. But for db file sequential read 
(indexed read, yes an indexed read), p1 is the 
file number (foreign key to v$filestat or 
dba_data_files) and p2 is the actual block 
number (related to dba_extents, sys.uet$, 
sys.fet$). To use these parameters, one needs a 
list of the waits with their associated parameters. 
Again, for parameter specifics contact an Oracle 
representative or search the WWW. The p[1- 
3]text column may provide some information. 
· P[1-3]raw. This is the raw representation of 
p[1-3]. This is not used very often and none of 
the tools presented in this paper make reference. 
· P[1-3]text. Sometime the name of the parame-ter, 
p[1-3], is provided. Don’t count on it. 
· State. This is a very important parameter be-cause 
is tells one how to interpret the next two 
columns discussed below, wait_time and sec-onds_ 
in_wait. If one misinterprets the state or 
chooses to ignore it, one will most likely misin-terpret 
the wait_time and seconds_in_wait 
numbers. The state column has four possible 
values. 
· Waiting. The session is currently waiting 
for the event. 
· Waited unknown time. The instance pa-rameter, 
timed_statistics is set to false. 
· Waited short time. Indeed, the session 
did not wait even one clock tick to get 
what it wanted, so no wait time was re-corded. 
· Waited known time. Once the session 
has waited and then received what it 
wanted, the state turns from waiting to 
waited known time. 
· Wait_time. The value is dependent on the state 
column discussed above. If the state column 
value is: 
· Waiting, then the wait_time value is bo-gus. 
· Waited unknown time, then the 
wait_time value is bogus. 
· Waited short time, then the wait_time 
value is bogus. 
· Waited known time, then the actual wait 
time, in milliseconds, is shown. One is 
very lucky to see this value, because if the 
session begins waiting for another re-source, 
i.e., status will now be waiting, 
the wait_time value turns bogus. 
· Seconds_in_wait. The value is dependent on 
the state column. If the state column value is:
· Waiting, then the actual time, in millisec-onds, 
is shown. If one does see a value, 
hopefully, one won’t see it again if re-querying. 
If so, the session is having to 
wait a relatively long time. If one repeat-edly 
queries, one will get a good idea when 
a session does wait, how long it waits. 
· Waited unknown time, then the sec-onds_ 
in_wait value is bogus. 
· Waited short time, then the sec-onds_ 
in_wait value is bogus. 
· Waited known time, then the sec-onds_ 
in_wait value is bogus. 
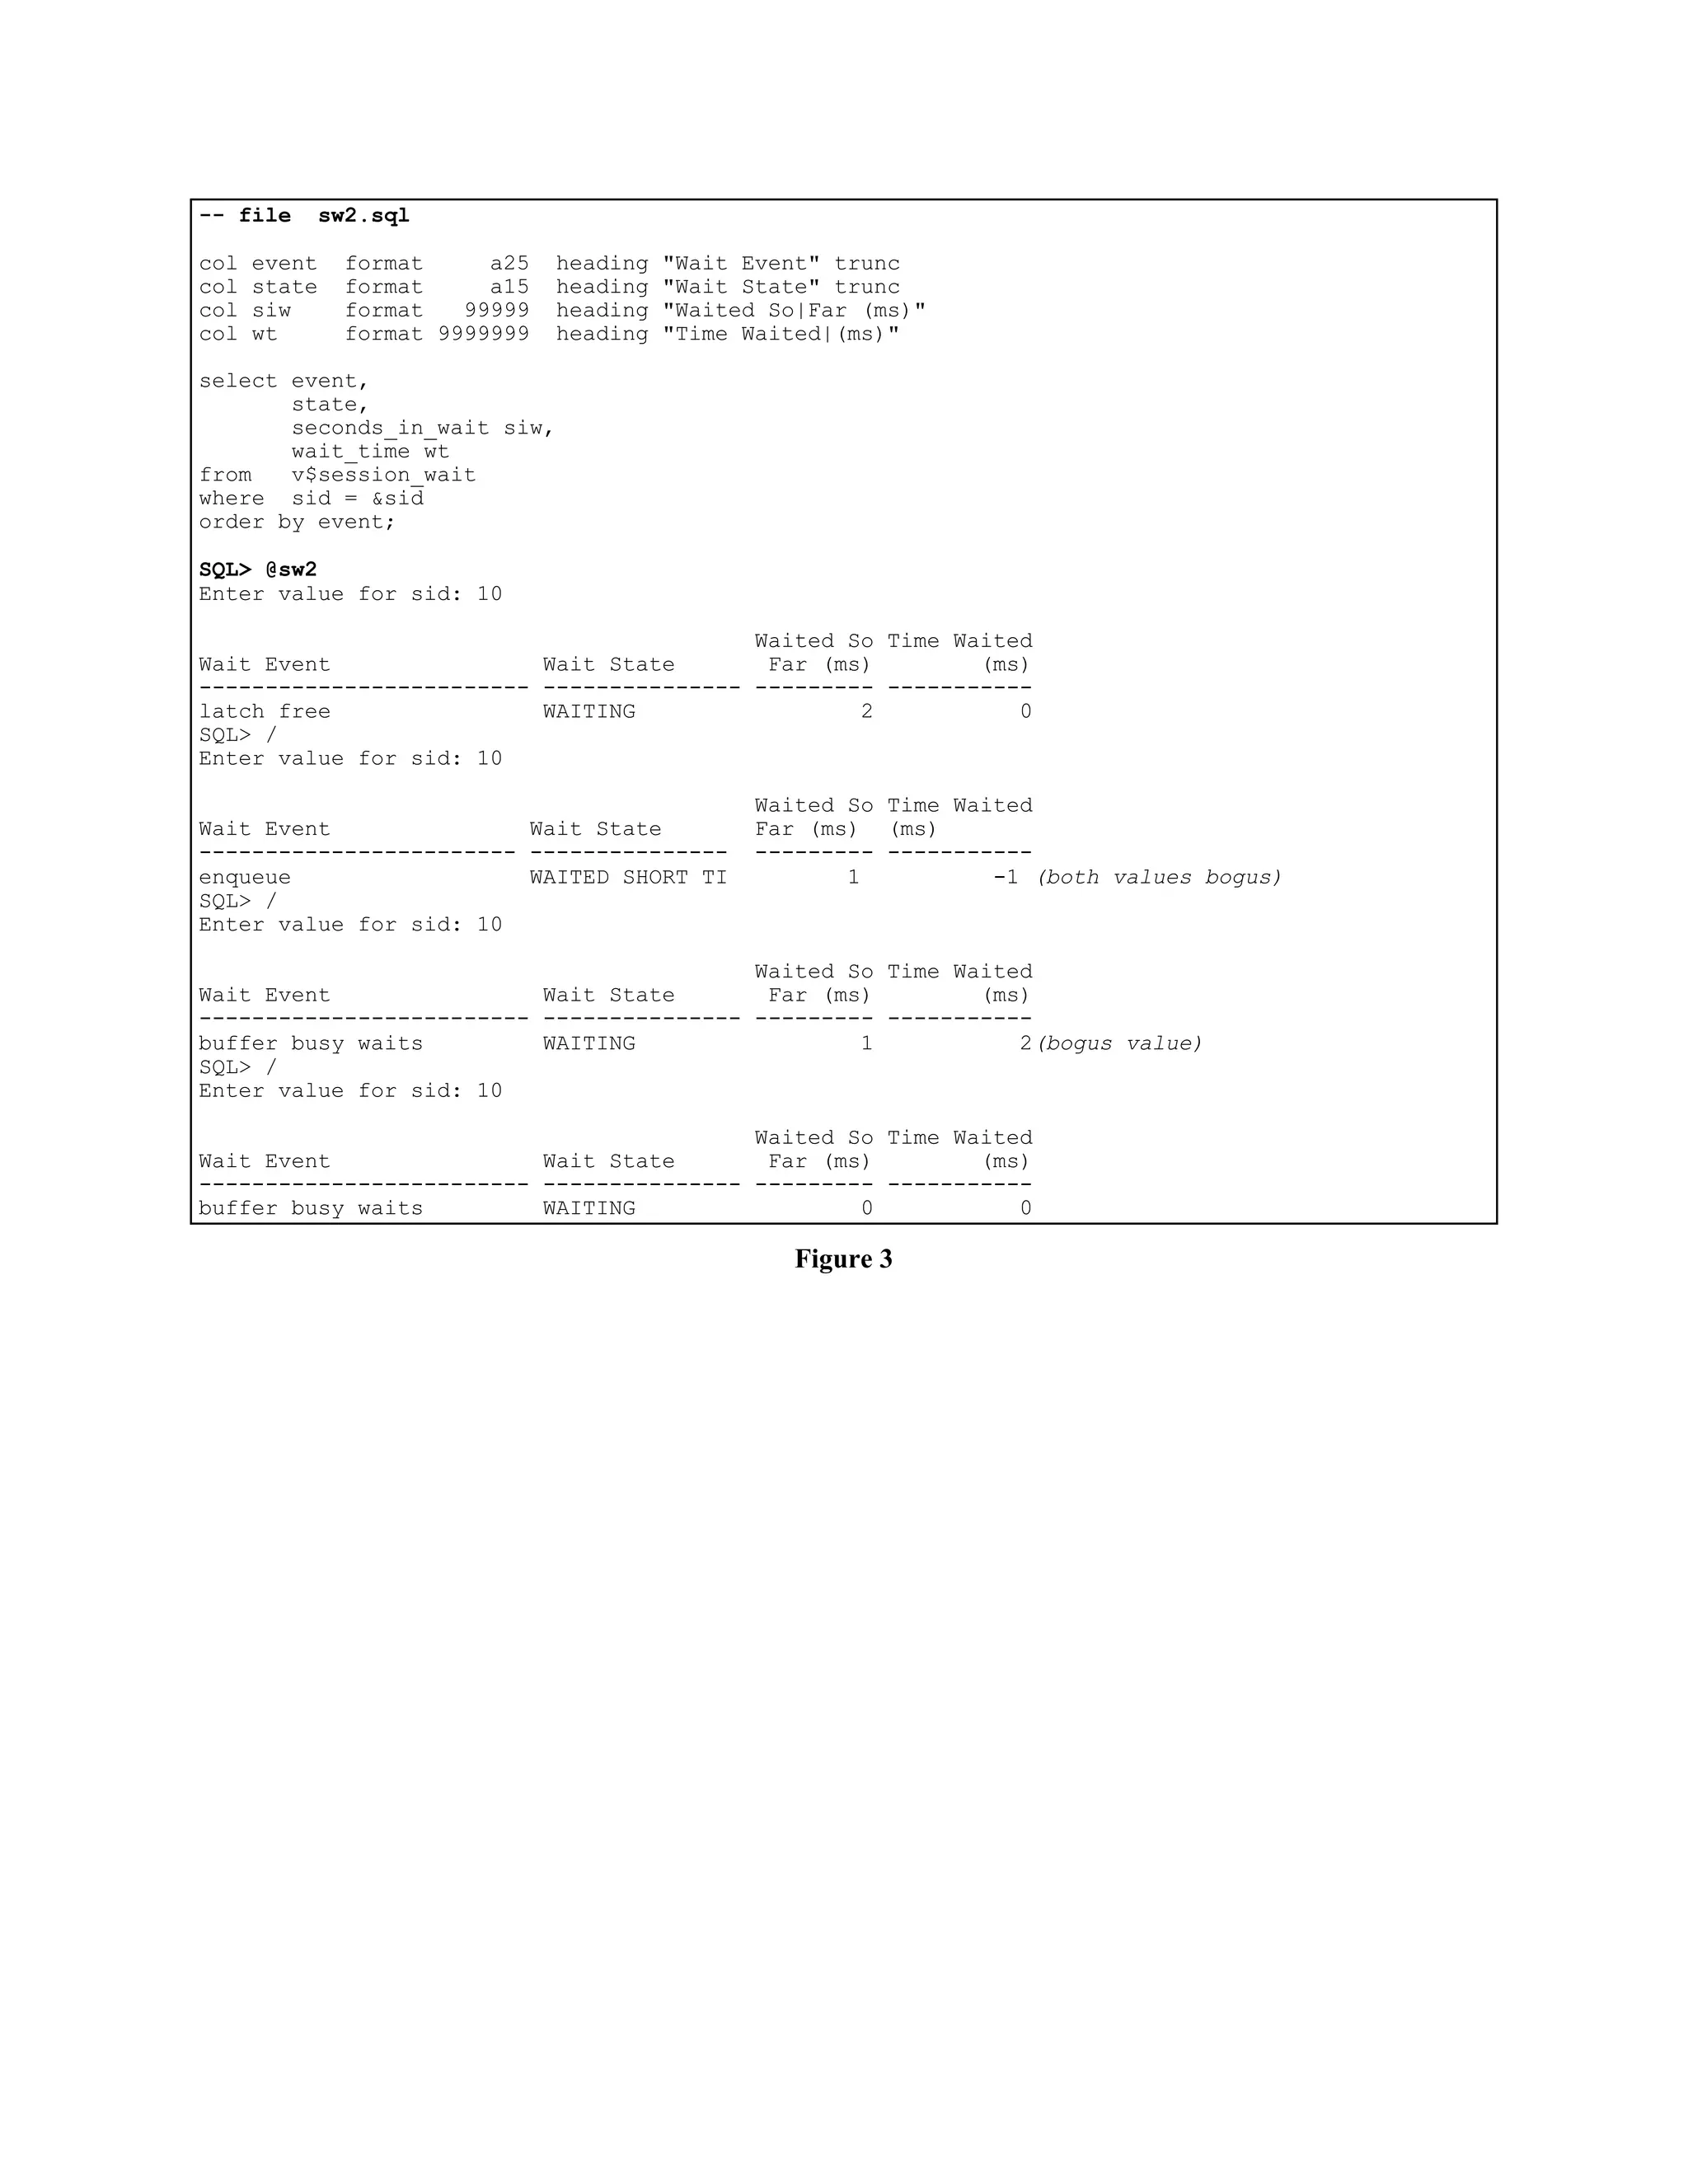
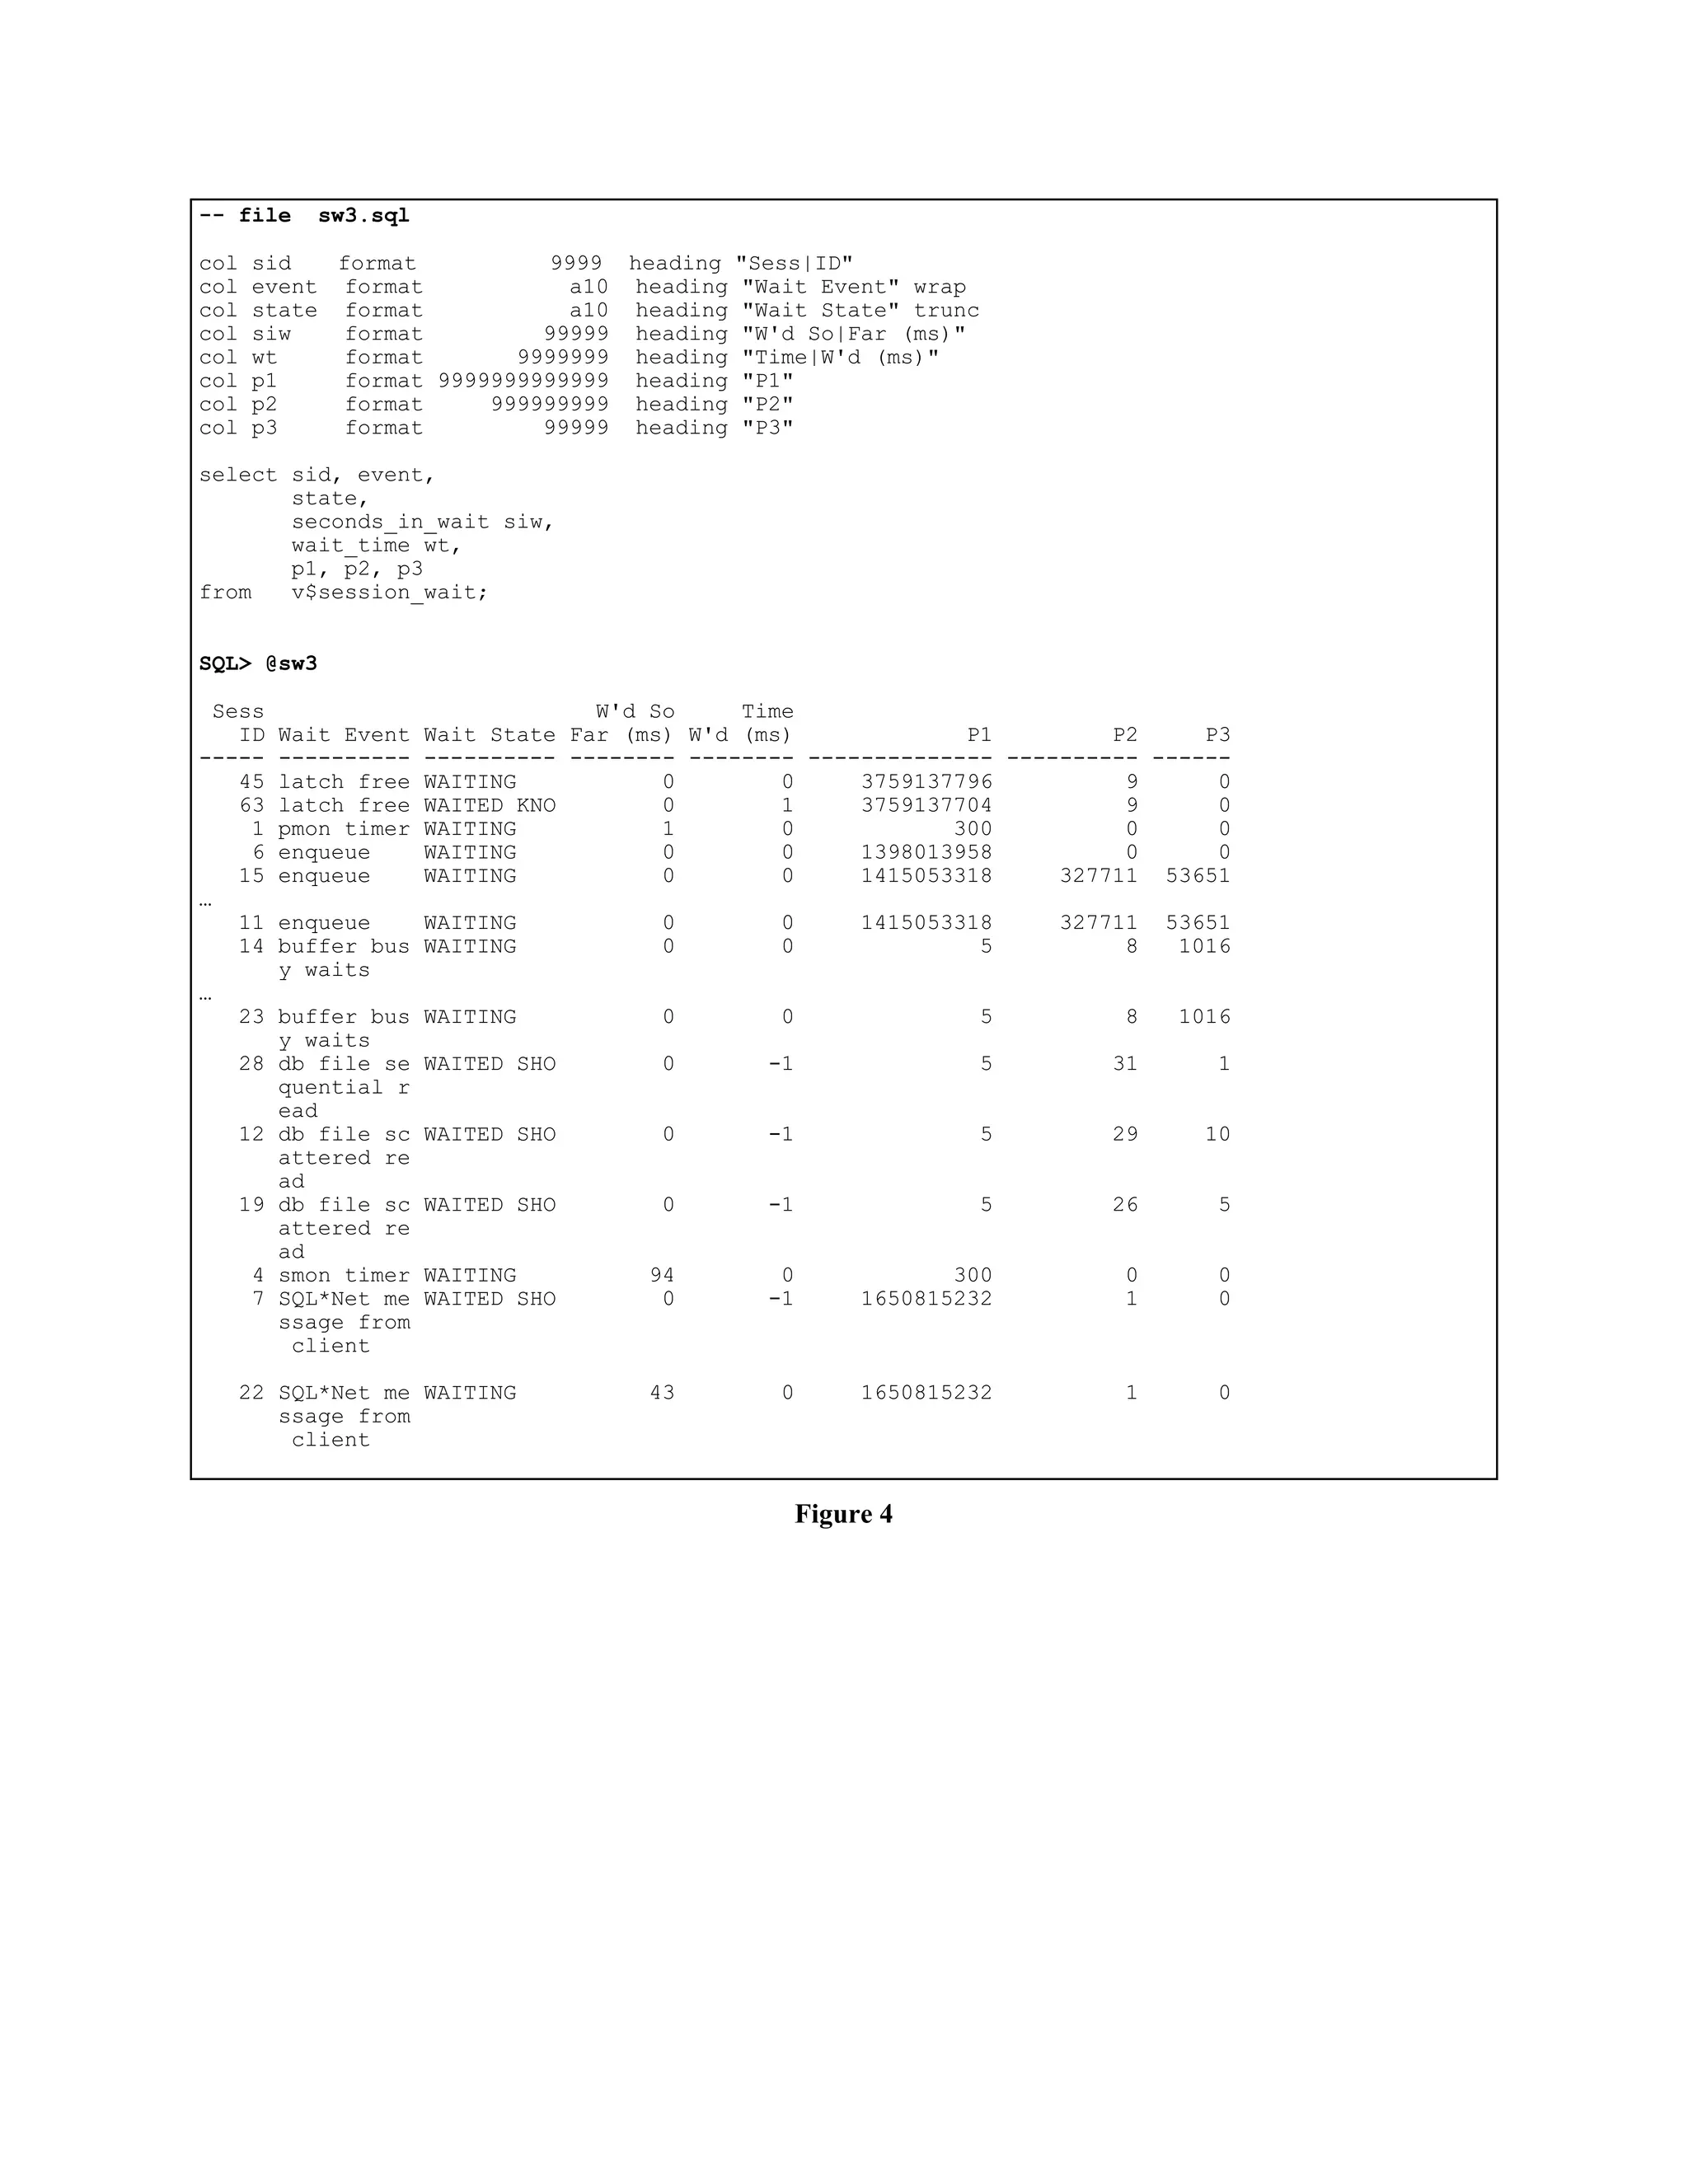
Figure 3 shows the source code and an example of 
using the v$session_wait view to gather timing in-formation. 
Whereas, Figure 4 shows the code and an 
example of using the v$session_wait view to gather 
“drill-down” information. 
4. Changing One’s Approach 
As presented above, using session wait statistics en-ables 
the performance specialist to pursue a different 
and much more productive performance tuning ap-proach. 
While the general performance management 
approach, as outlined in the Total Performance Man-agement 
paper (see reference section), remains the 
same, the drill-down strategy has been radically 
changed. This section is aimed at contrasting the two 
basic drill-down approaches to help one understand 
the differences so one can make the switch to the 
more powerful of the two. 
When drilling down using session wait statistics, one 
typically starts out at the high level using the 
v$system_events view. Based upon the statistics 
gathered, one immediately begins to drill-down using 
the v$session_events and the v$session_wait views. 
One continues this cycle until the contention infor-mation 
required is found. 
Think about the power. In the past, when a person 
reported a problem, one begin by looking at ratios, 
tracing their specific session, etc. Now one can look 
to see exactly why their session is waiting. One can 
even say “You are waiting for the X latch because 
everyone wants to update block number x, in file 
number y.” Not that anyone would actually say this, 
but the information is available. 
Now let’s outline the traditional ratio based approach. 
There are many sub-systems within an Oracle system. 
There are many latches, caches, hash chains, lists, 
processes, etc. To determine if a particular area is 
“doing well,” one had to sample some statistics over 
time and calculate the ratios which should point one 
in the right direction. Usually the statistics do point 
the performance specialist in the right direction, but 
one must truly be a performance specialist, with many 
years of training, before this method becomes effec-tive. 
What usually happens is various miscellaneous 
system changes are made which seemed to work in 
the past. If someone asked why a specific change was 
made, they would typically receive a response like, 
“Well if something works for me, I stick with it!” 
Now let’s contrast the two methods. The ratio 
method is like the newborn baby, who just screams 
when it hurts. The doctor has a very difficult problem 
to solve because before he can not effectively com-munication 
with the child. Whereas with an adult, 
effective communications are available. Contrasting 
this with the session wait method, one simply per-forms 
a few simple queries and lets the system tell the 
doctor exactly where it hurts. It’s obviously more dif-ficult 
than that, but I think you get the point. 
So next time you look at the database block buffer 
cache hit ratio and it’s 60% but there are no related 
session waits, don’t worry about it. And when the 
database block buffer cache hit ratio is 95% but there 
are no related session waits, don’t worry about it. 
And when sessions begin to wait, don’t worry about 
it, just let the statistics guide you down the critical 
path towards productive and effective performance 
tuning. 
5. Case Study 
What is presented below is real life. Nothing is made 
up and everything is real. Notice no ratios are used 
during the analysis, yet the problem and it’s related 
affects were quickly discovered and analyzed. 
Our general method is the Total Performance Method 
utilizing the holistic problem identification method-ology 
to approach the problem from an Oracle server, 
application, and operating system perspective. The 
Oracle server approach uses session wait statistics ex-clusively. 
The application section only references the 
most resource consuming SQL, and the operating 
system was diagnosed using only the UNIX sar util-ity. 
All standard tools and available to everyone. So 
here we go… 
5.1 Oracle Server Investigation 
5.1.1 High level review 
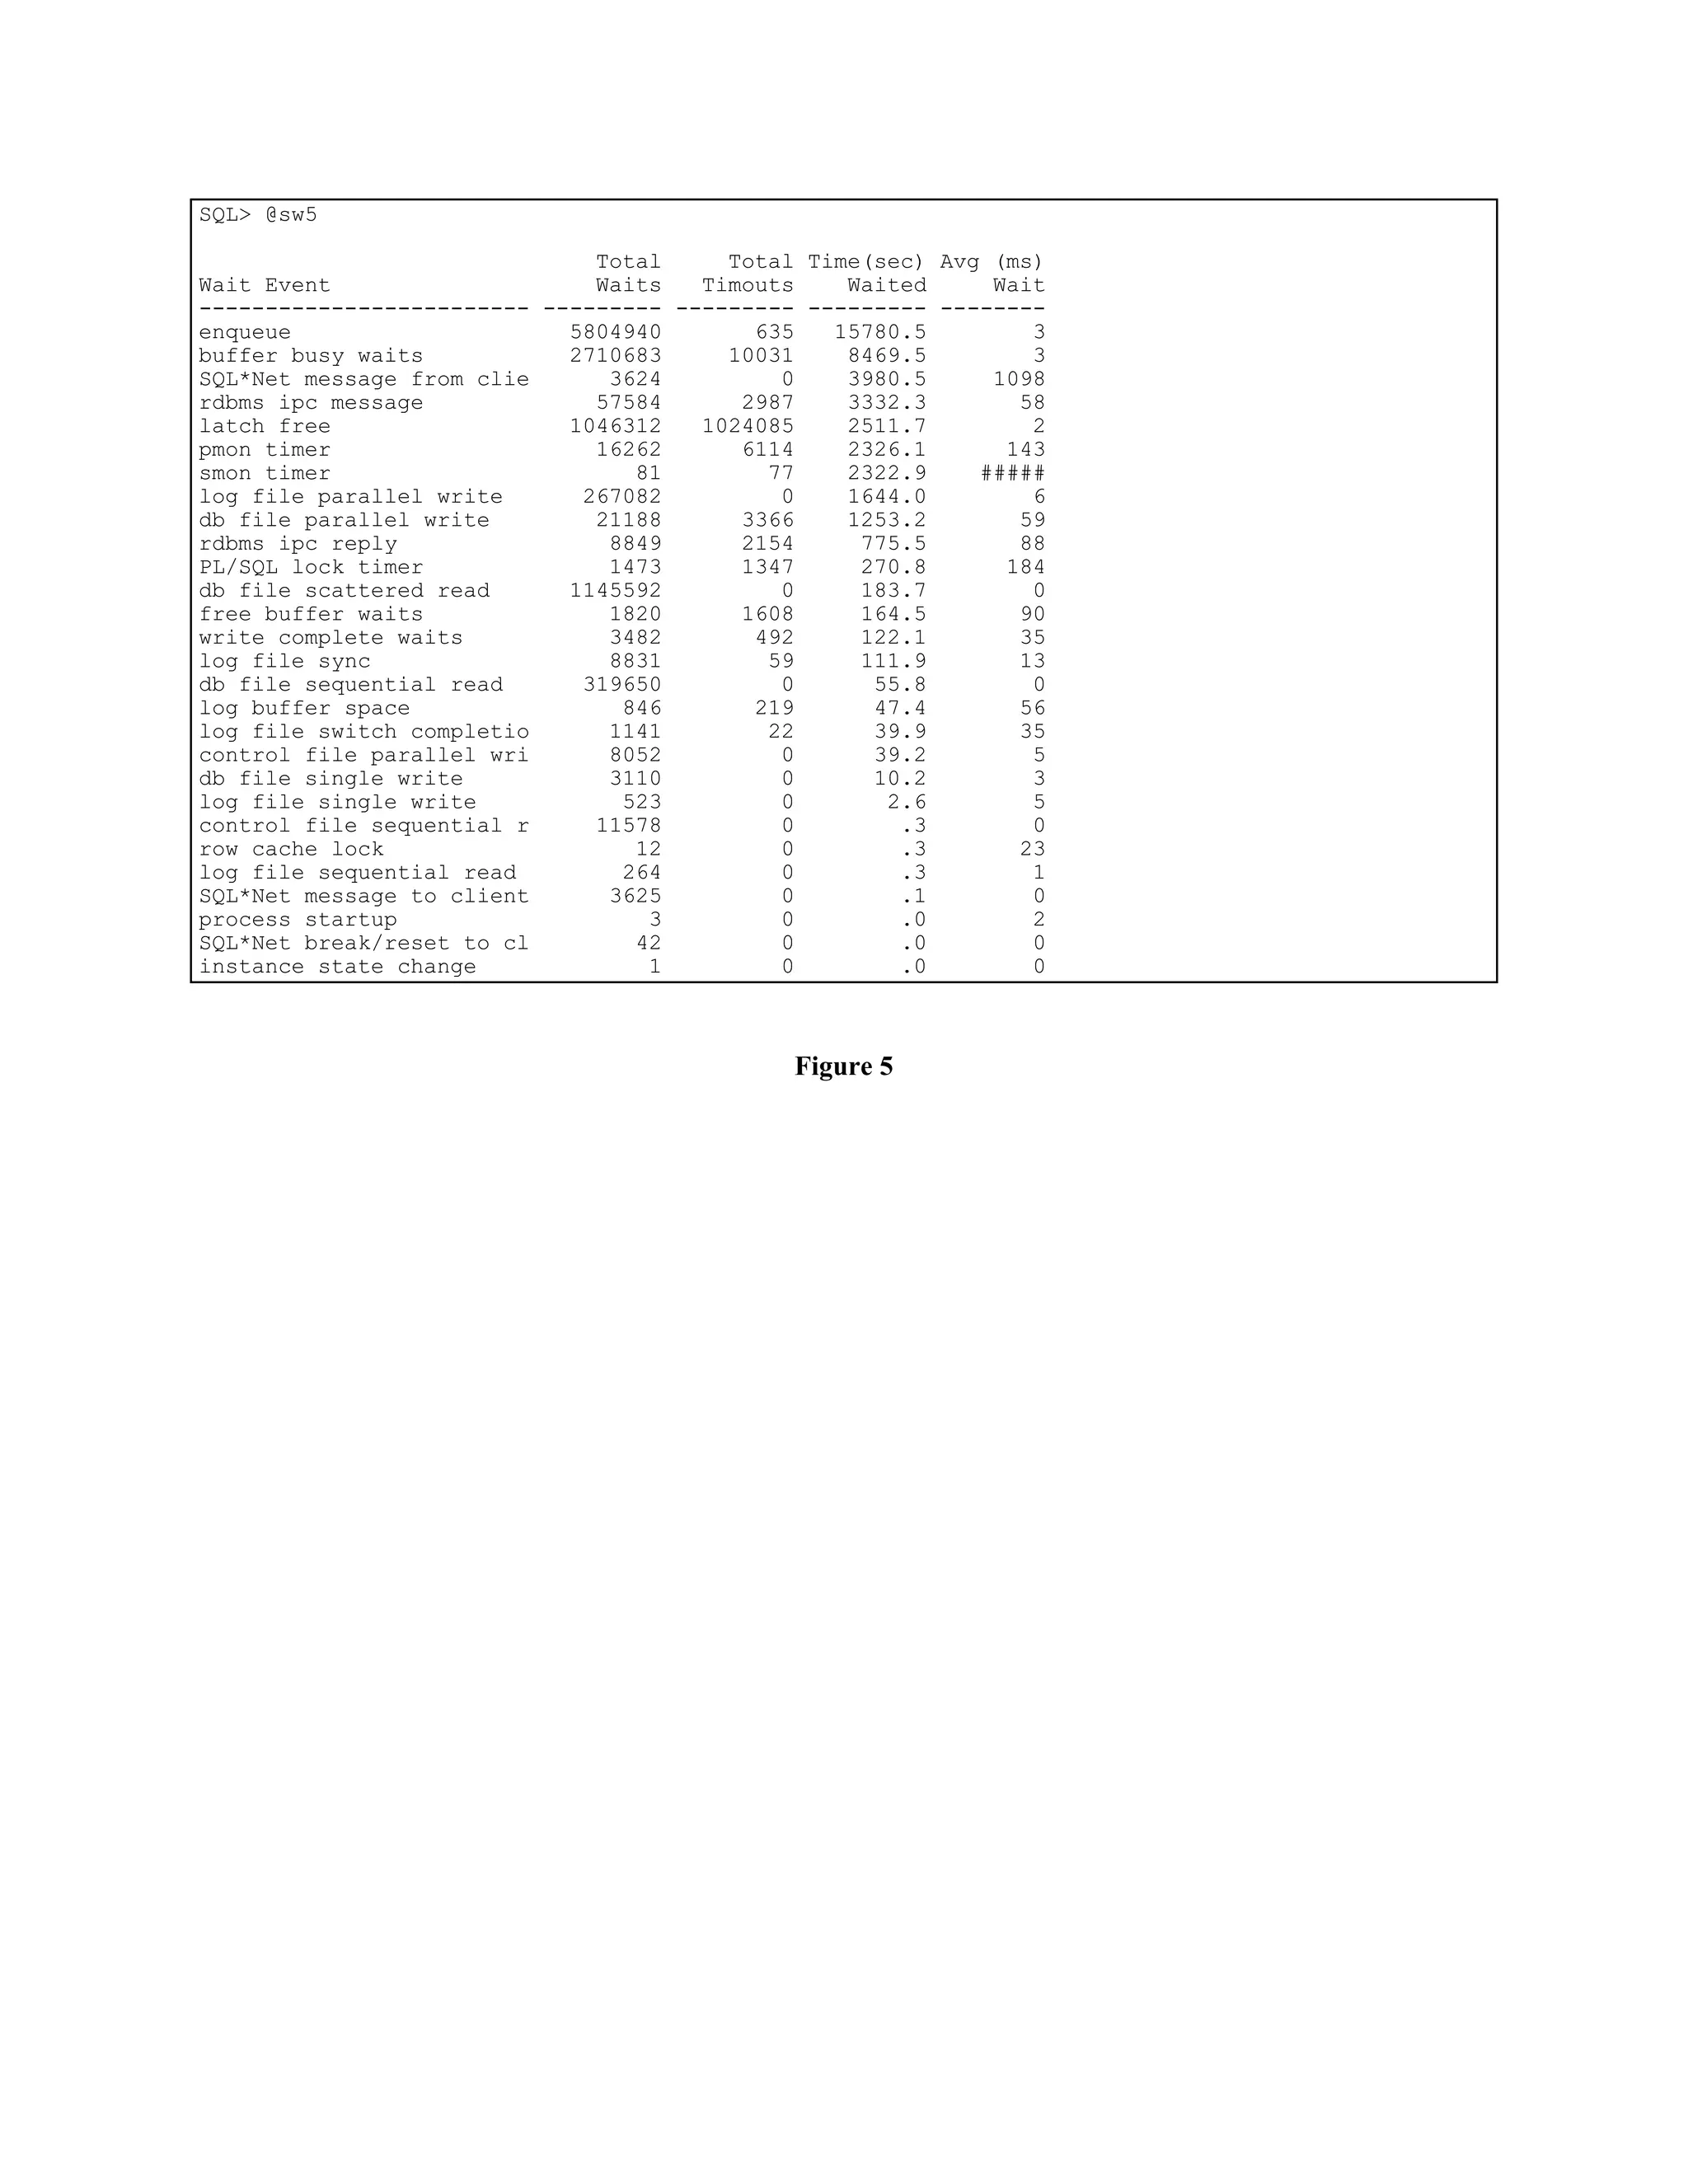
To begin our analysis, we start with examining the 
overall situation. We execute sw5.sql which refer-
ences the v$system_events view. The results are 
shown in Figure 5. 
This system is experiencing serious contention and 
the users must be furious. Five different wait types 
vividly show themselves. Enqueue waits, buffer 
busy waits, SQL*Net message from client, rdbms 
ipc message, and latch free waits. The enqueue 
waits are by the far the most prevalent, but experi-ence 
tells me all the significant waits are all closely 
related. 
I’m not interested in the SQL*Net wait message 
based upon my experiences, conversations with my 
peers, and SQL*Net is not being used in the system 
being monitored. Because db file sequential read is 
one of the most common waits in many systems, it 
will be discussed below. 
5.1.2 Enqueue Waits 
We will begin our quest by investigating the enqueue 
waits. Enqueues are probably one of the most misun-derstood 
areas in the Oracle server. Much of the 
problem stems from the fact there are many different 
types of enqueues and determining which enqueue a 
process is waiting for, what the enqueue means, and 
what to do about it, is difficult to determine and to 
find relevant documentation. Therefore, before we 
dig into how to diagnose enqueue waits, a discussion 
about protecting Oracle internal structures is in order. 
User implemented locks protect user defined struc-tures 
(e.g., gl.gl_code_combinations), enqueues 
protect Oracle internal structures (e.g., uet$ and 
fet$), and latches ensure specific sections of Oracle 
kernel code are executed serially by a single session. 
For example, allowing a process to update the uet$ 
table while another process updates the fet$ table 
could have disastrous affects. 
A difference between latches and enqueues is latches 
maintain no sequence or ordering. The latch algo-rithm 
uses either timers to sleep, wake up, and retry 
(both single and multi-CPU environments), or in 
multiprocessor environments, a process can “spin” 
and retry. Since all latch waiters are concurrently re-trying, 
any process may get the latch. While unset-tling, 
it is theoretically possible the first process to try 
to get a latch, may be the last process to get the latch. 
Latching algorithms and operating system schedulers 
obviously try to minimize this occurrence. However, 
on an extremely latch wait laden environment, this 
type of problem can and has occurred. 
An enqueue is a sophisticated locking mechanism 
which permits several processes to share known re-sources 
to varying degrees. Any object which can be 
concurrently used can be protected with an enqueue. 
For example, Oracle allows varying levels of sharing 
on tables: two processes can lock a table in share 
mode or in share update mode. 
Enqueues are platform-specific locking mechanisms. 
An enqueue allows a server-side process to store a 
value in a lock, that is, the requested lock mode. An 
operating system lock manager, manages the locked 
resources. If a process cannot be granted a lock, be-cause 
it is incompatible with the lock mode requested, 
the operating system places the requesting process in 
a FIFO wait queue. 
The instance parameter enqueue_resources sets the 
number of resources that can be locked by the lock 
manager. Since multiple DML locks can be placed 
on an object, there needs to be enough enqueues to 
cover the number of DML locks. For example, if 
three users are modifying data in one table, then three 
DML locks will be required. If three users are modi-fying 
data in two tables, then six DML locks will be 
required. As of Oracle7, all DDL locks are handled 
internally by the Oracle kernel and do not require an 
enqueue. Also, the Oracle kernel needs around 
twenty enqueues for overhead. Therefore, the maxi-mum 
sensible enqueue_resources value would be 
twenty plus the summation of the number of objects 
times the number of DML transactions against the 
object. Typically, enqueue_resources is set much 
lower. In fact, by default, enqueue_resources is 
generally set to the instance parameter sessions times 
five. 
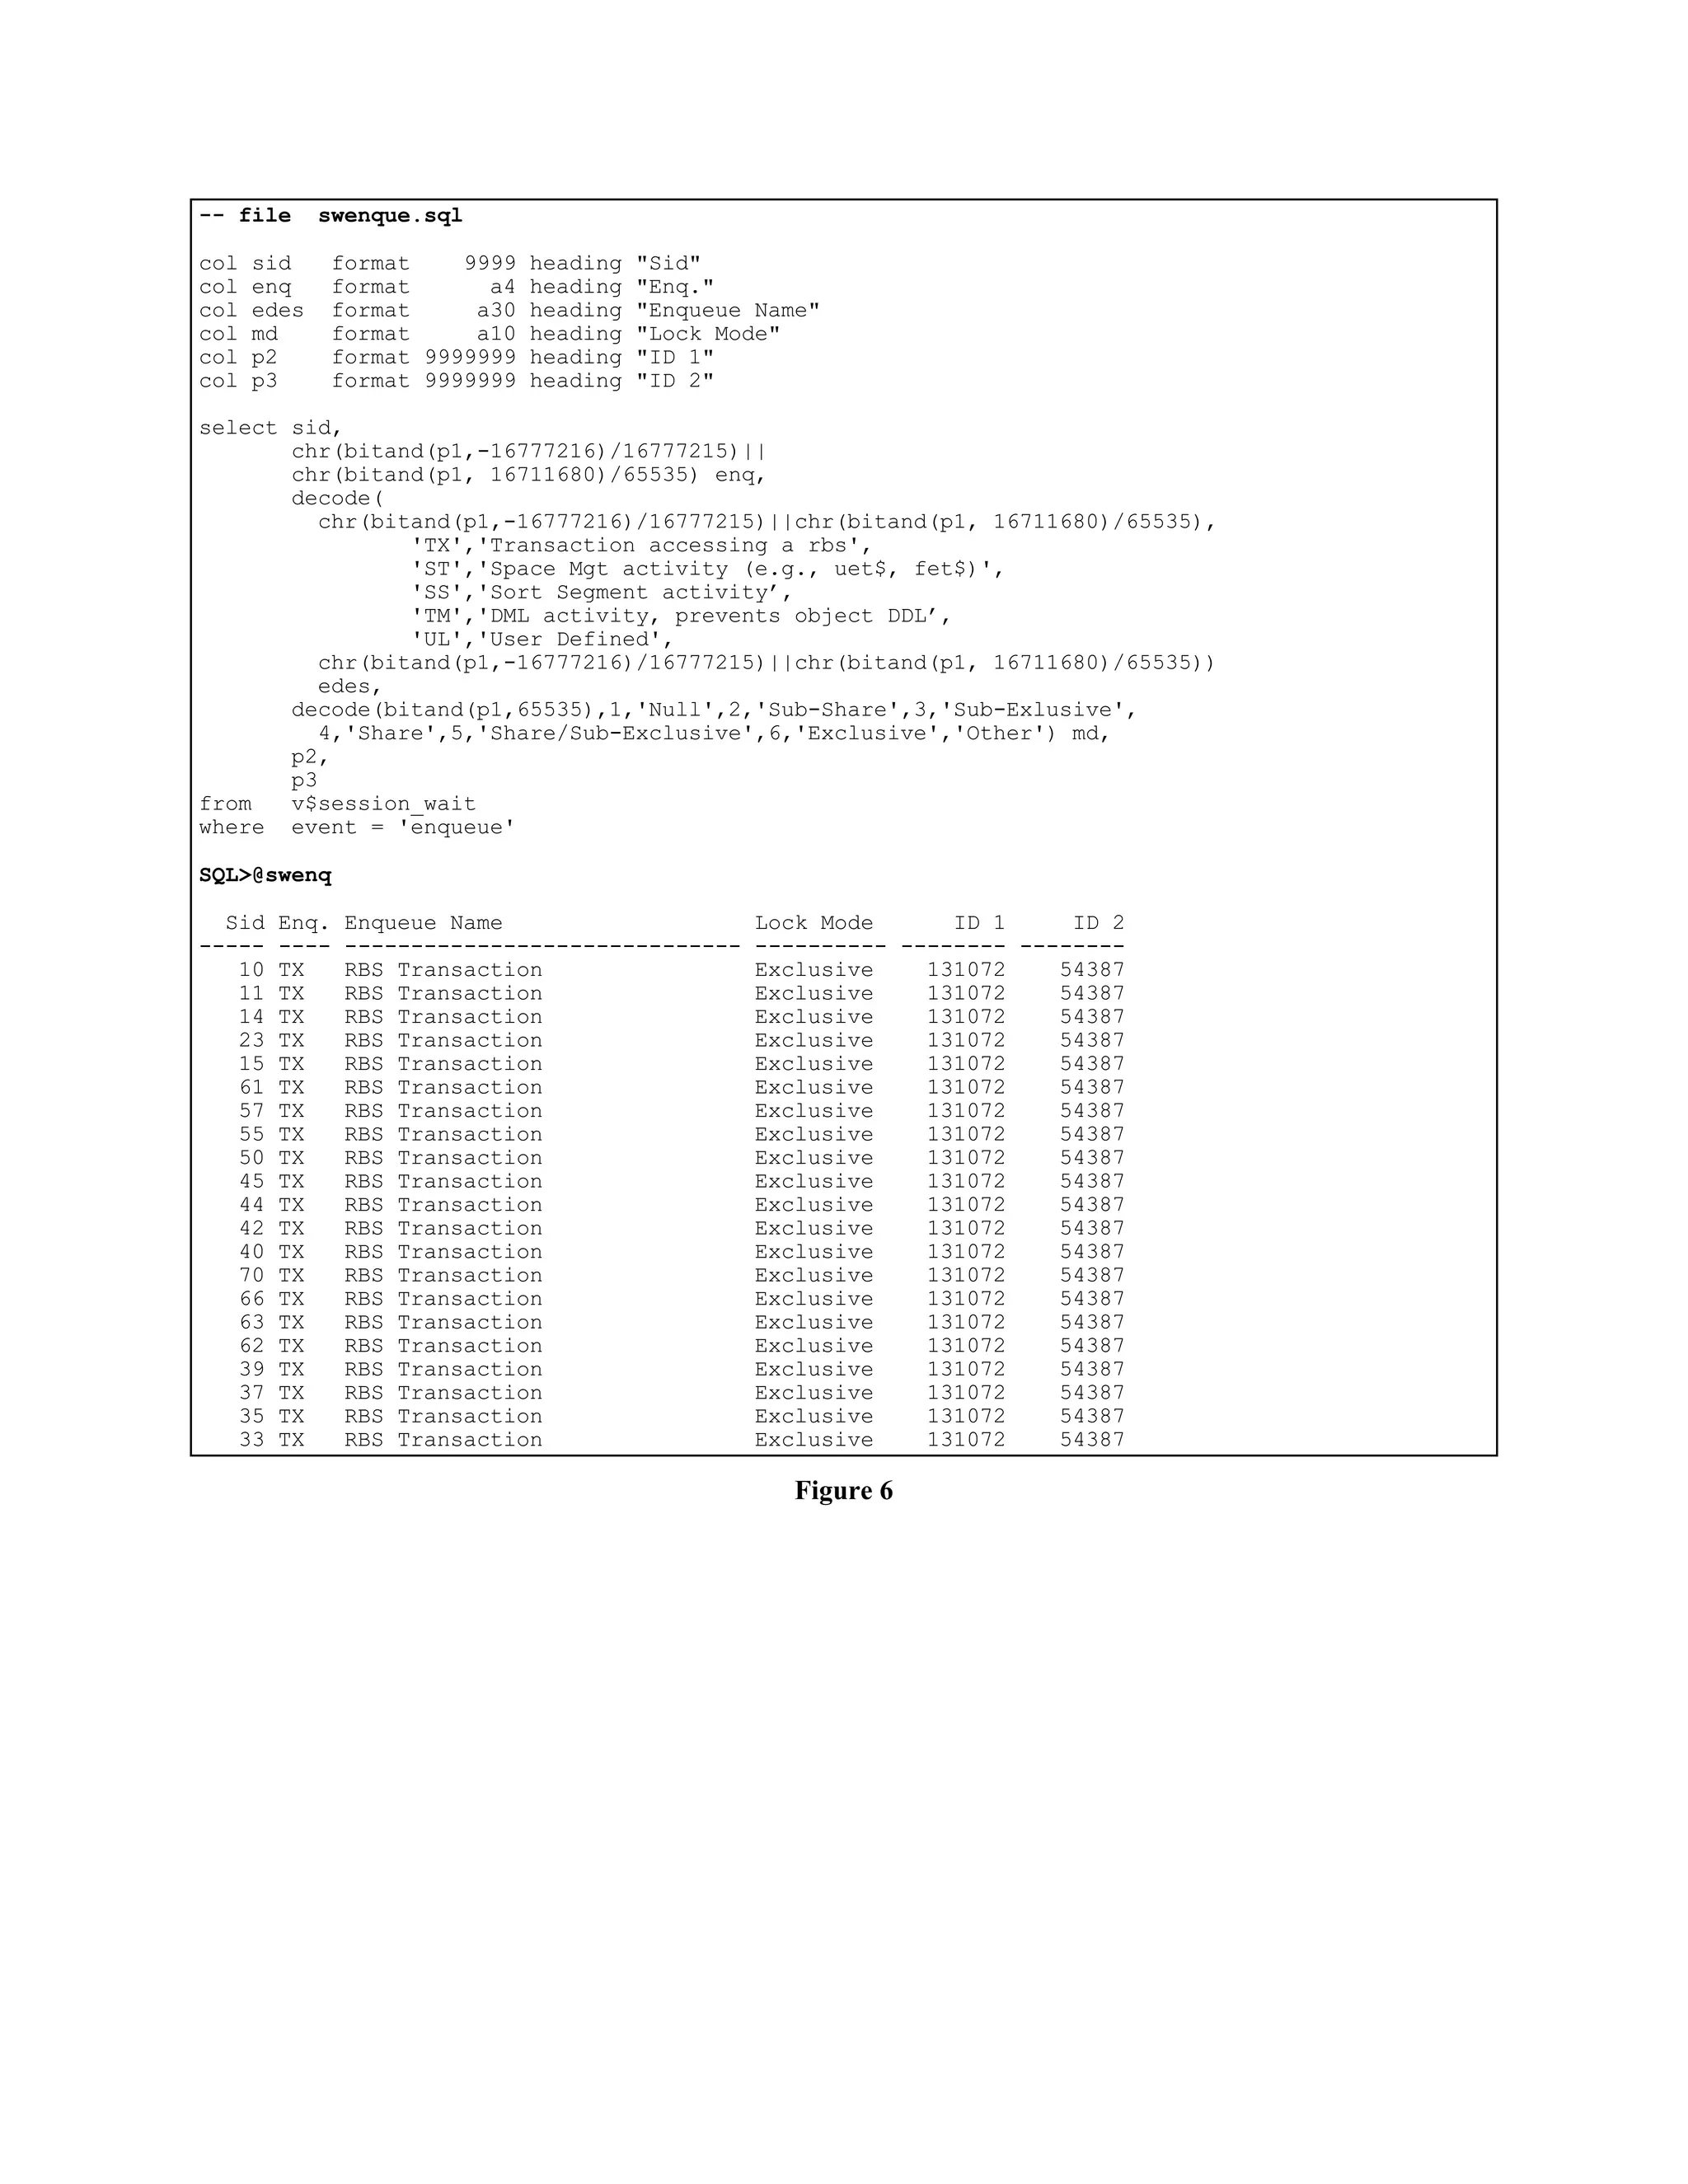
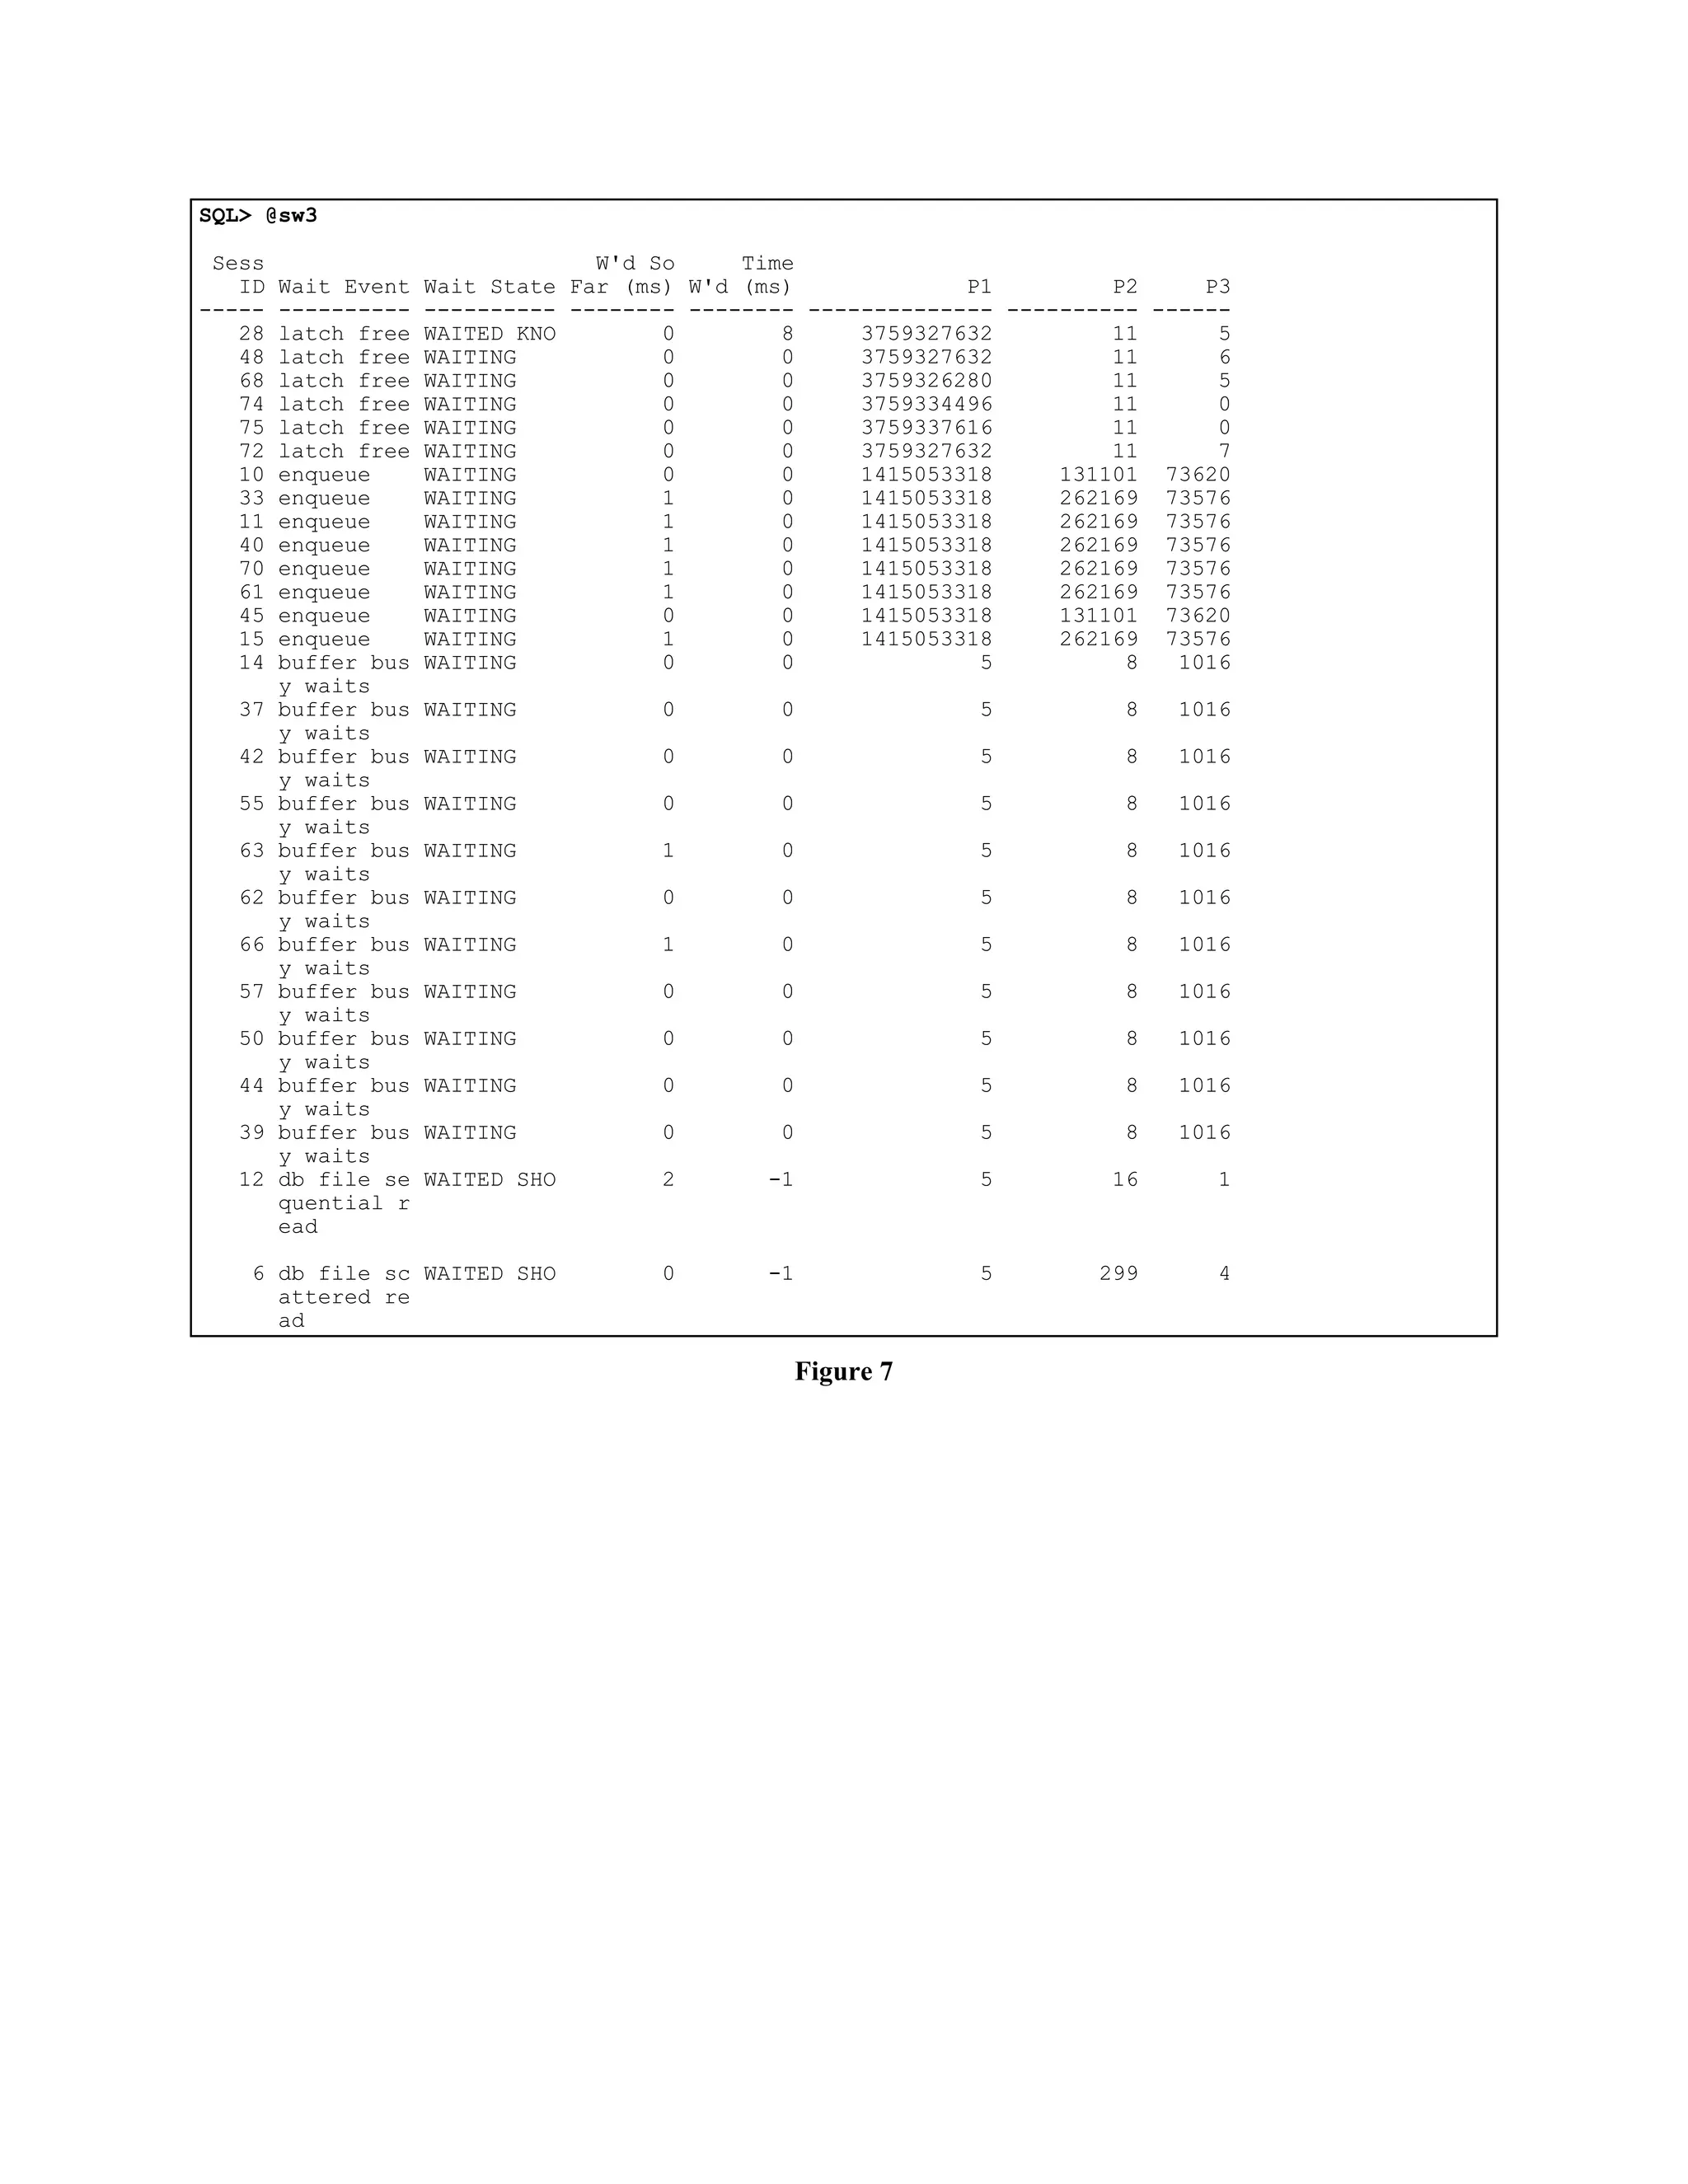
Back to our investigation. Figure 6 shows a very use-ful 
yet somewhat cryptic script. The specific en-queue 
waits are derived from the p1 parameter. 
Each enqueue wait can be drilled-down even further 
by using the p2 and p3 parameters. For example, the 
TX enqueue’s p2 and p3 parameters points one to 
the undo segment, its slot, and its sequence number. 
In most cases, drilling down to just to the specific en-queue 
wait name will provide one with plenty of in-formation. 
As v$system_events forewarned, there is significant 
enqueue waiting occurring. This script output doesn’t 
show this, but nearly three-quarters of the users on 
this system are waiting for the same enqueue re-source, 
a transaction enqueue. More specifically, the 
transaction enqueue is held in exclusive mode when a 
transaction initiates its first change and held until the 
transaction performs either commit or a rollback. 
This directs us to be on the lookout for intense DML 
activity and/or the rollback segments are poorly con-
figured. In this particular situation, the rollback seg-ments 
are configured to handle the application’s ex-pected 
workload. If however, we address the DML 
concern and transaction enqueues persists, then the 
rollback segments will need to be reconfigured. 
5.1.3 Buffer Busy Waits 
The next wait to investigate is buffer busy waits. A 
buffer is “busy” when another process is reading it 
into the data block buffer cache or the related 
block(s) are being “converted” into a “cleaned-up” 
block state. If a block is being repeatedly updated, 
locating and accessing the buffer(s) could cause a 
session to wait for the block(s). 
When a session updates row data in a block, the Ora-cle 
kernel performs the least amount of work neces-sary 
for the session to continue performing other use-ful 
work. Later on, the block(s) will be converted 
back into a stable state. However, if a specific block 
is repeatedly updated, “copies” of the block are made 
to ensure a user is not held waiting and internal Ora-cle 
integrity is maintained. While this process in-creases 
performance from one perspective, the time 
involved to locate the busy block will increase, 
thereby decreasing performance from another per-spective. 
(See the latch waits section below.) This 
process can cause a buffer(s) to become busy and in-duce 
a buffer busy wait. 
We determine the actual buffer being requested by its 
file number and its block number. Figure 7 shows the 
sw3.sql script being used to show the parameters for 
all the waits, for all the sessions. This much detail 
can only come from the v$session_wait view. On a 
very large system, the output could be pages long. 
We will also use this output for diagnosing the latch 
wait activity. 
For buffer busy waits, db file sequential reads (in-dex 
reads), and db file scattered reads (full table 
scans), p1 is the file number and p2 is the block 
number. Using this information combined with 
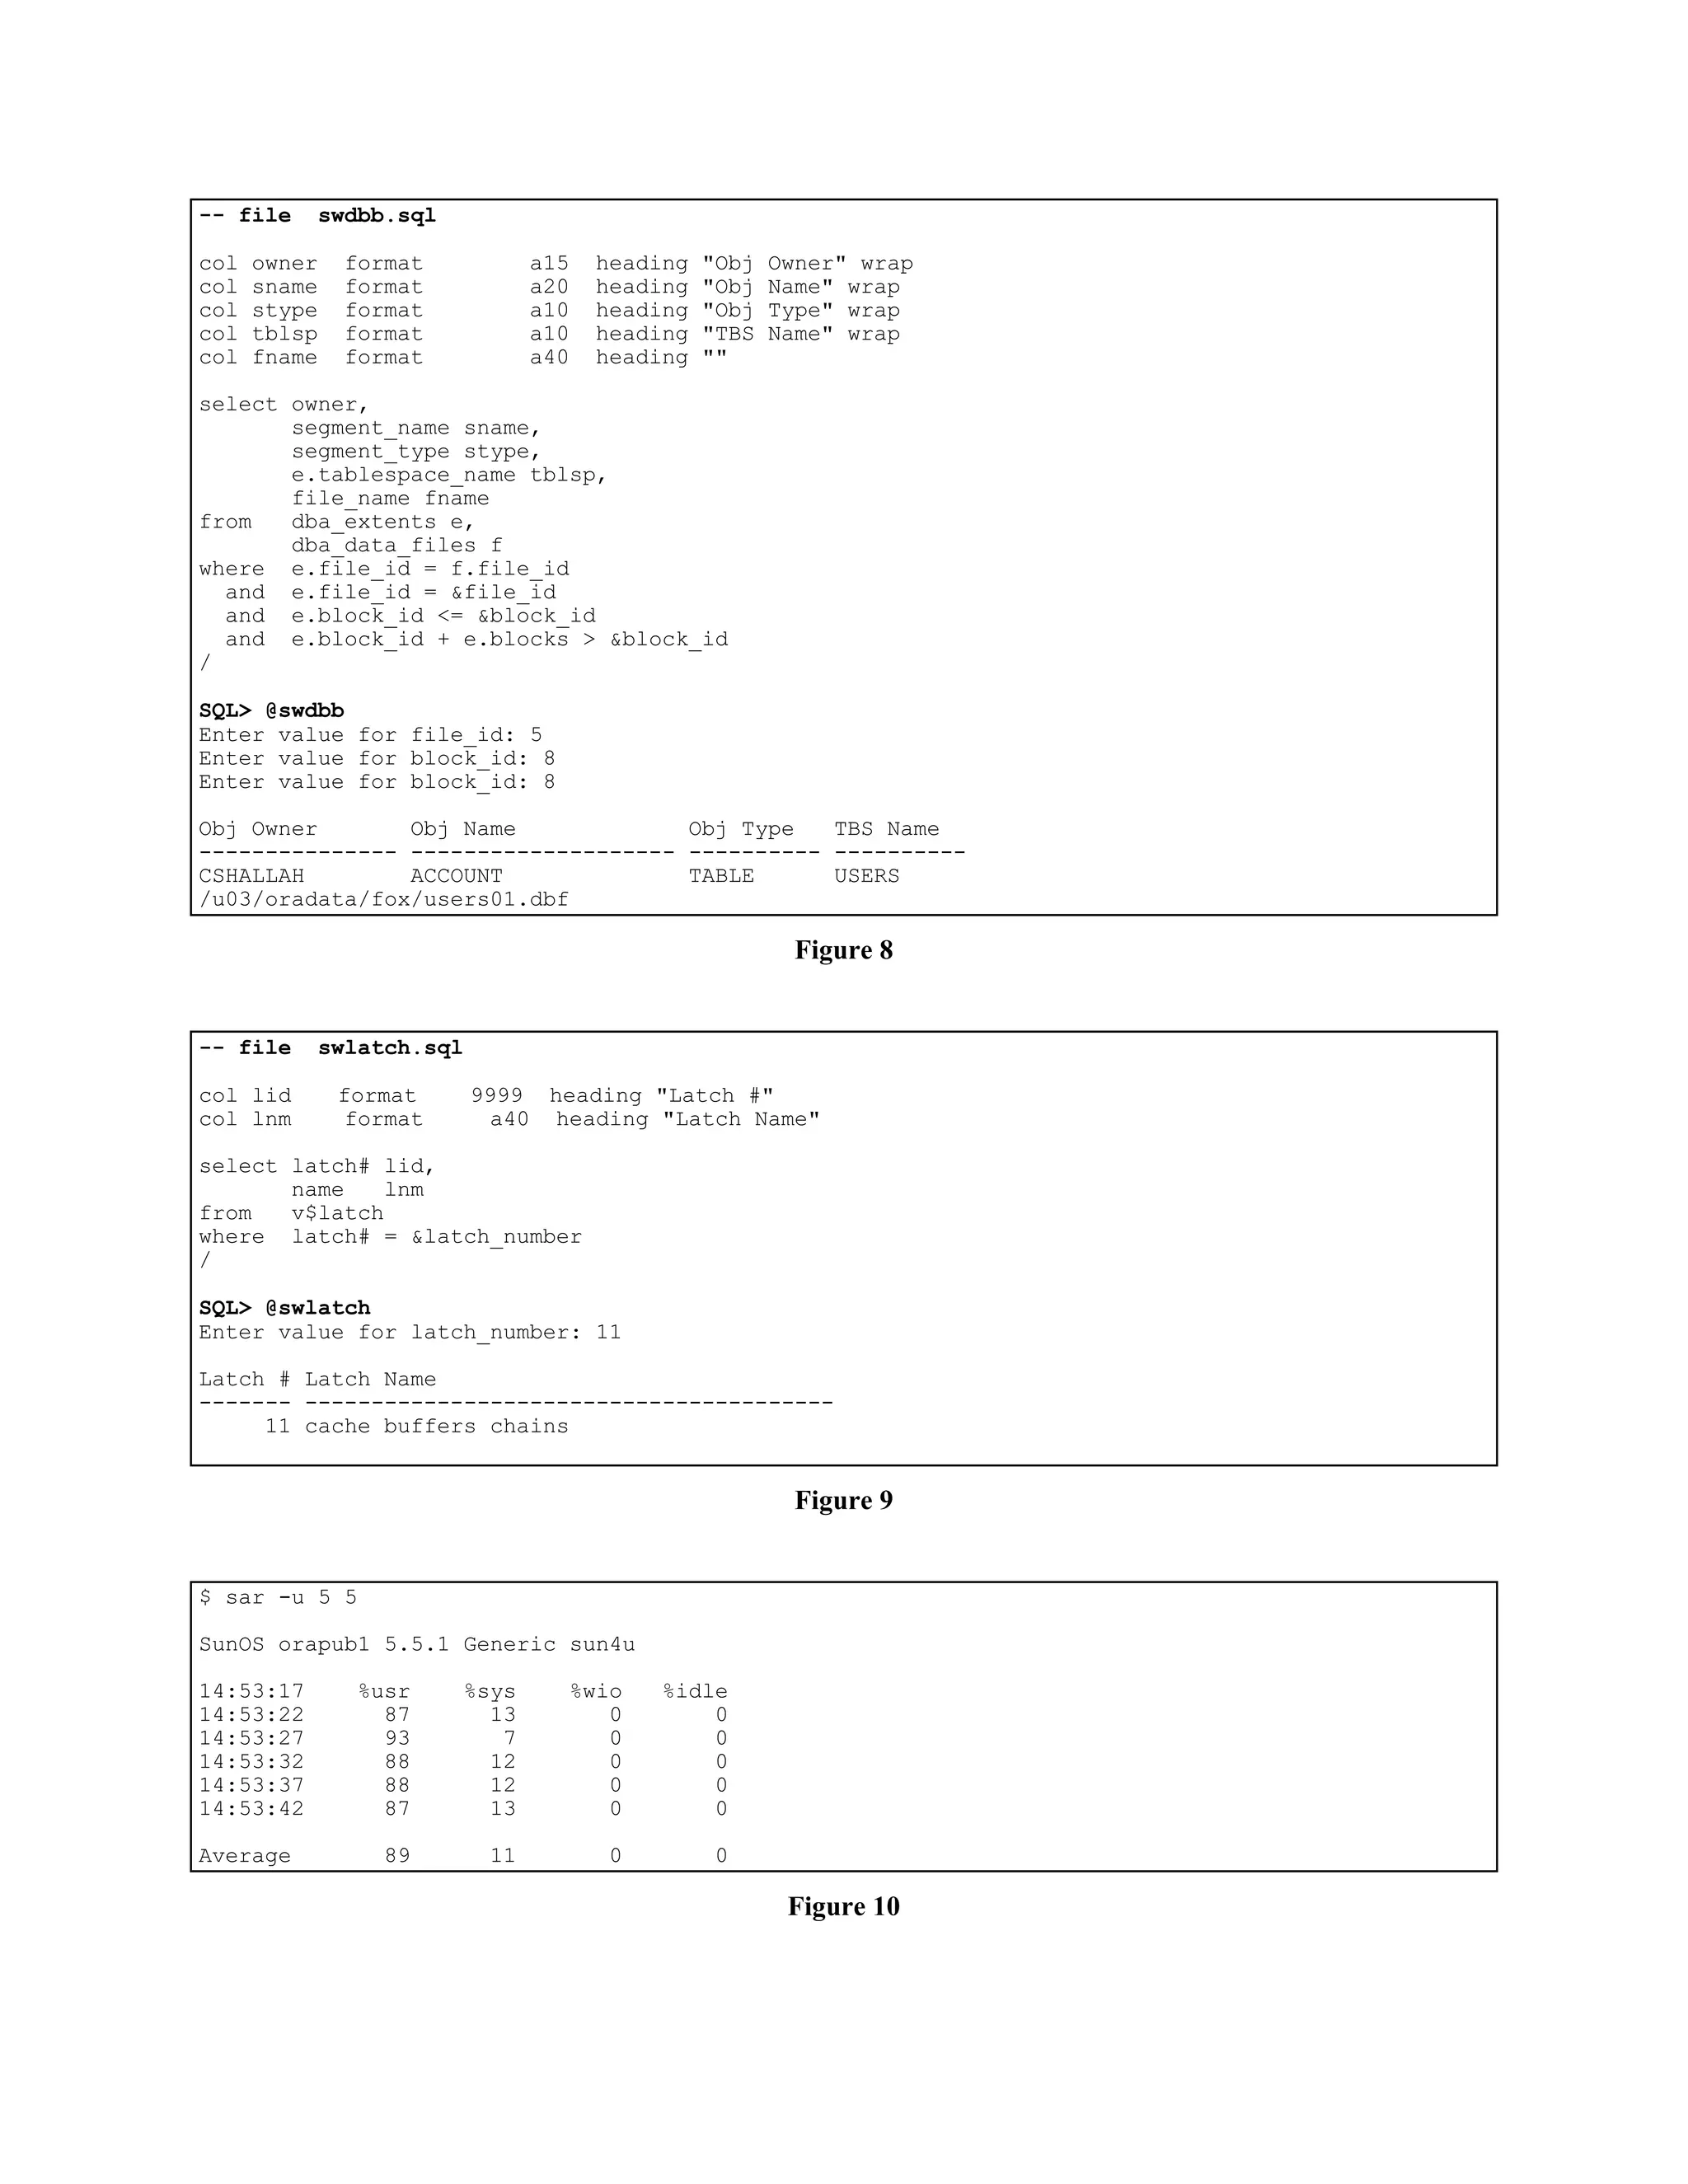
dba_data_files and dba_extents, we can determine 
the actual operating system file name and database 
object these sessions are waiting for. In this case 
study, nearly every busy buffer is for file number five, 
block number eight. File number five is 
/u03/oradata/fox/users01.dbf and buffer number 
eight is in the account table. 
Let’s review. The enqueue waits are directing one to 
be on the lookout for heavy DML activity or poorly 
configured rollback segments. The buffer busy waits 
directs one to a specific block, in the account table 
and in the users01.dbf database file. If there is an 
I/O bottleneck, the users01.dbf file will most likely 
be very “hot.” If not, they will most likely be heavy 
SGA data block buffer activity. The picture is be-coming 
clearer. 
5.1.4 Latch Waits 
Figure 7 shows many sessions waiting on the same 
latch. The latch number is provided by p2, which 
references the latch number in the v$latch view. The 
script swlatch.sql, shown in Figure 9 shows the 
cache buffer chain latch is the latch sessions are 
waiting for. 
We have already discussed latching in the previous 
two sections, but there is still more details to present 
to better understand the latching process. Certain 
parts of the Oracle kernel code should only be run by 
a single process at a time to ensure certain structures 
are properly maintained (e.g., one wouldn't want to 
query a node from a linked list if someone else was 
simultaneously deleting the node’s parent). A latch is 
a data structure and a protocol to ensure only one ses-sion 
accesses certain parts of the kernel code at a 
time. 
One latch in particular is the cache buffer chain 
latch. To allow an Oracle server-side process to 
quickly determine whether a desired database block 
resides in the buffer cache, Oracle keeps a hash table 
in the SGA. This hash table consists of several hash 
chains (there are _db_block_hash_buckets hash 
chains in the hash table). Each hash chain can be 
viewed as a hash bucket with a sequential linked list 
of blocks related to the specific bucket, hence the 
term hash chain. 
Each database block is uniquely identified by its file 
number and its block number. The hashing algorithm 
“hashes” each data block about to reside in the data 
block buffer cache. The hash function inputs are the 
file number, the block number, and the block type. 
The hash function output is the appropriate hash 
chain. 
Any time a server-side process needs to reference a 
block, for any reason, the block can be quickly refer-enced 
by hashing the block and then serially search-ing 
the appropriate hash chain for the block’s SGA 
address. So each time a block is inserted, deleted, or 
just examined, the appropriate hash chain must be ac-cessed 
and sequentially searched. To maintain inter-nal 
integrity, any Oracle server code which touches 
the cache buffer chain must only be executed by a 
single session. To accomplish this serial execution, 
the Oracle kernel code uses the cache buffer chain 
latch.
If multiple sessions want to run a section of kernel 
code, then one or more sessions must wait for the 
latch to become available. Until it does become 
available, they must wait. This wait shows up as a 
session wait, latch wait. 
As discussed in the previous two sections, the cache 
buffer chain latch wait tells one a process is waiting 
to acquire the cache buffer chain latch. If a block is 
being updated repeatedly, “copies” of the block are 
made to allow the updating processes to continue per-forming 
useful work and to allow other processes to 
access the block. Unfortunately, when this occurs, 
the related hash chain becomes “long.” So to confirm 
the existence of the desired block in the SGA, the 
cache buffer chain latch must be held longer than 
normal. This can cause the cache buffer chain latch 
wait. 
We have completed our investigation from an Oracle 
server perspective. The evidence shows most ses-sions 
are performing an update, updating the same 
block over and over again. 
5.2 Operating System Perspective 
No analysis is complete without looking at the com-puting 
system from an operating system perspective. 
Presented below, is a grossly abbreviated operating 
system investigation. But the focus of this paper is on 
session wait statistics, not on the operating system. 
In most cases, the operating system investigation will 
support findings from both an Oracle server and ap-plication 
perspective. As one will see, this case is no 
different. 
An operating system should be investigated from four 
angles. The I/O subsystem, the CPU subsystem, the 
memory subsystem, and the network subsystem. This 
particular computing system resides on a single host 
so there is no network activity occurring. While not 
shown below in Figure 10, memory was checked and 
was not a problem. That leaves CPU and I/O. The 
CPU and I/O subsystem were very quickly investi-gated 
by running the UNIX sar -u command. The 
results, which thirty seconds of statistics do not 
prove, are shown in Figure 10. The output shows a 
CPU bottleneck with less than one percent of the 
time, the CPU is waiting for information from the I/O 
subsystem. 
This shows the CPU is very busy, possibly concen-trating 
predominately on memory manipulation, such 
as very intense SGA activity. Again this supports the 
buffer busy, the latch, and the enqueue wait activity 
we discovered. 
When there is intense SGA activity, it is not uncom-mon 
to see CPU system time greater than CPU user 
time. Enqueue activity uses the operating system 
kernel code for queuing and latching uses the operat-ing 
system kernel code for “sleeping.” Oracle kernel 
code is predominately used during latch wait spinning 
which shows up as CPU user time. 
5.3 Application Perspective 
So far our investigation shows something is causing 
serious buffer activity resulting in latch waits, buffer 
busy waits, enqueue waits, and a very high CPU utili-zation. 
Just as with the operating system investiga-tion 
above, this application investigation is grossly 
abbreviated, but serves our purpose. 
Since we suspect a single SQL statement is causing 
the problems, looking at what SQL statements are 
currently being run may bring our investigation full 
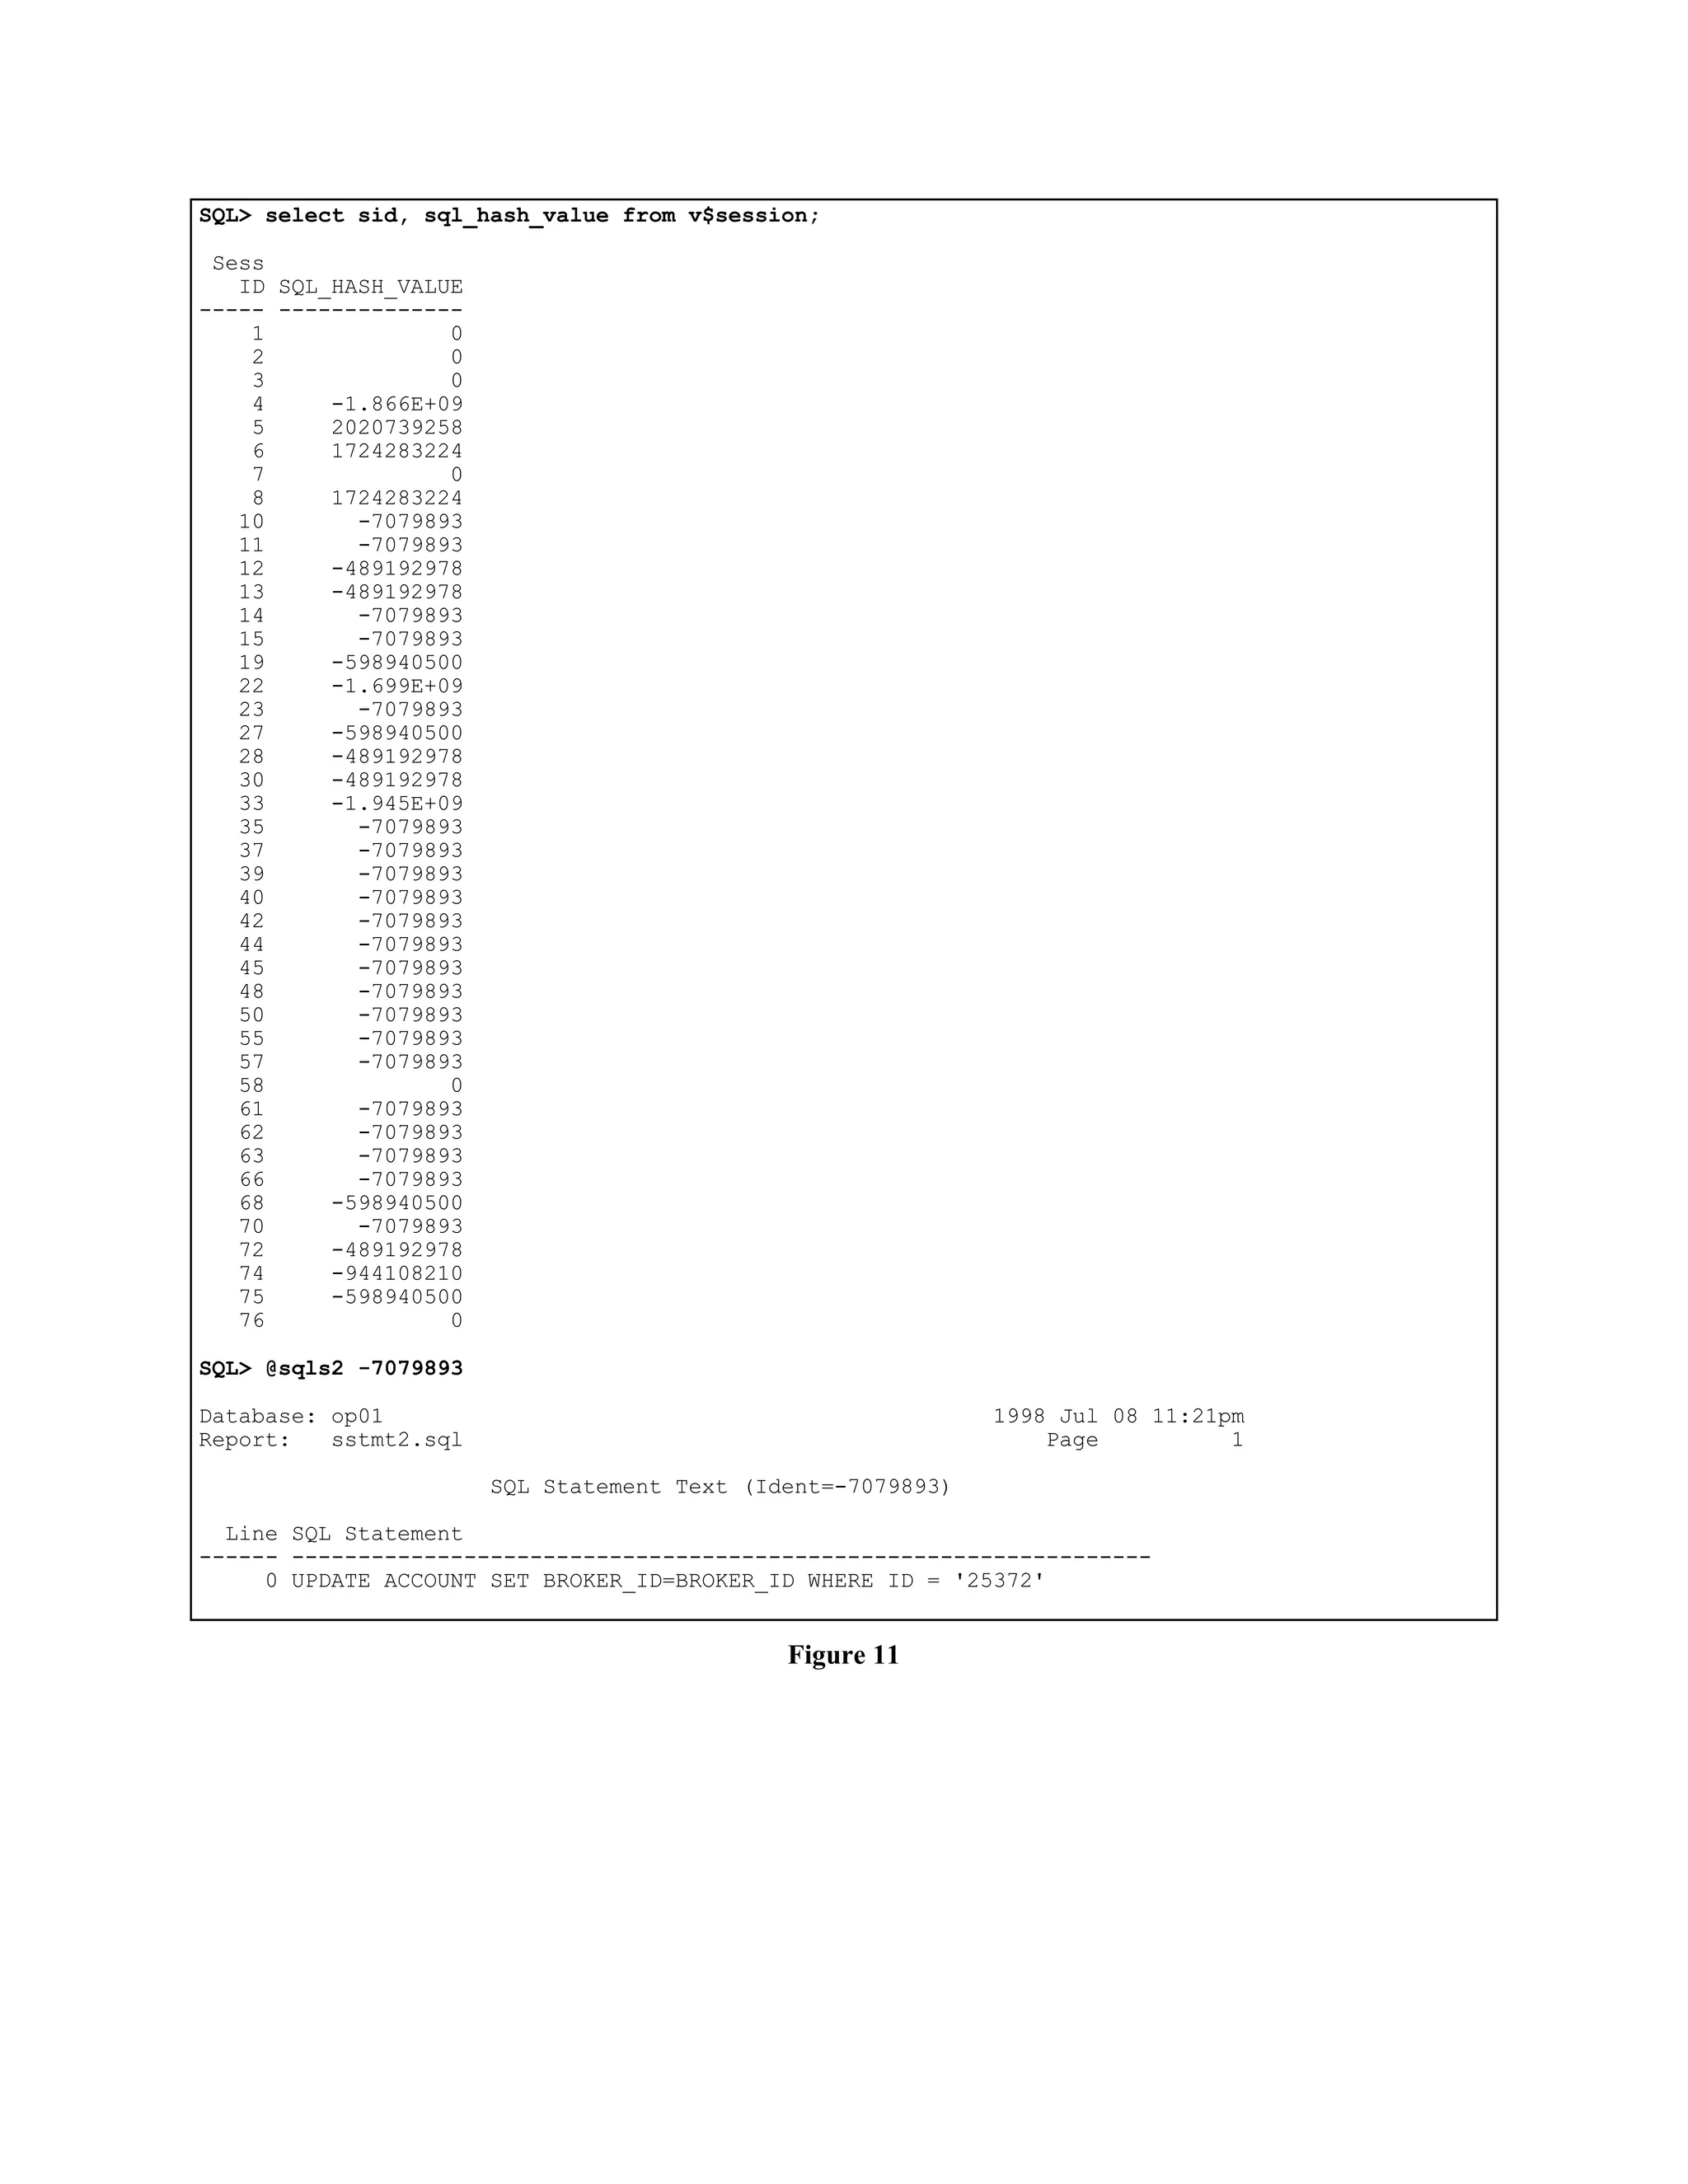
circle. Figure 11 lists all the currently running SQL 
statement hash values by querying from the v$session 
view. As we suspected, a large percentage of users 
are running the exact same SQL statement. 
Now that we have the SQL statement’s hash value we 
will query v$sqltext to show the actual SQL state-ment. 
And there’s our culprit! A very simple update 
statement. 
6. Final Analysis 
This analysis was very straightforward with each 
piece of evidence nicely building our case. Let’s re-view 
our evidence. 
· Enqueue TX waits directs one to be on the 
lookout for DML activity that many sessions are 
running, which are accessing the same table(s). 
This could also indicate poorly configured roll-back 
segments. 
· Buffer busy waits directs one to a specific 
block, in the account table and in the us-ers01. 
dbf database file. 
· Cache buffer chain latch waits directs one that 
many sessions want to touch the cache buffer 
chain. A high update concurrency rate on a sin-gle 
block could cause this. 
· CPU subsystem saturation with most of the 
time spent in user mode directs one towards 
Oracle kernel code based CPU activity. Intense 
cache buffer chain latch activity, along with 
other SGA manipulation activity such as en-queue 
and buffer busy waits are just the thing to 
cause this.
· I/O subsystem not doing much confirms that 
the users01.dbf database file is not being ac-cessed 
much from an I/O perspective, but the 
blocks in the database file are being heavily ma-nipulated 
in the SGA. 
· A single SQL update statement updating a 
single block is being performed by a large per-centage 
of the sessions. 
Now that the problem has been identified, we need to 
ask, “What the heck is going on? Why is the same 
bloody update statement being executed over and 
over?” Unfortunately, this situation is not that un-common. 
Two situations arise which could easily cause this 
pattern of activity. One example is using a table for 
sequence number generation and the other is for low 
budget and worthless benchmarks or stress tests. This 
case study shows that even a single SQL statement, 
strategically placed and executed, can cause a tre-mendous 
amount of contention. 
Besides the application and benchmark design issues 
raised by this example, using a ratio performance 
tuning approach would have brought one to the same 
conclusion, but not nearly as quickly and not with 
such exactness and persuasion. 
7. Conclusion 
This paper was written for those who find perform-ance 
tuning books and nearly all published perform-ance 
tuning papers inadequate, antiquated, and not 
supplying performance specialists with the most ef-fective 
methods to tune Oracle based systems. I hope 
this paper, through the scripts, the prose, the exam-ples, 
and the case study, have provided you with the 
information you need to begin significantly increasing 
your performance optimization productivity using 
Oracle virtual session wait based tables. Thank you 
for your time. 
8. References 
Chatterjee, S.; Price, B. Regression Analysis by Ex-ample. 
John Wiley & Sons, 1991. ISBN 0-471- 
88479-0 
Cook, D., Dudar, M., Shallahamer, C. The Ratio 
Modeling Technique. Oracle Corporation White 
Paper, 1997. http://www.europa.com/~orapub 
Jain, R. The Art of Computer Systems Performance 
Analysis. John Wiley & Sons, 1991. ISBN 0- 
471-50336-3 
Levin, R.; Kirkpatrick C.; Rubin, D. Quantitative Ap-proaches 
to Management. McGraw-Hill Book 
Company, 1982. ISBN 0-07-037436-8Menascé, 
D.; Almeida, V.; Dowdy, L. Capacity Planning 
and Performance Modeling. PTR Prentice Hall, 
Englewood Cliffs NJ, 1994. ISBN 0-13-035494- 
5 
Michalko, M. Thinkertoys. Ten Speed Press, 1991. 
ISBN 0-89815-408-1 
Millsap, C. Designing Your System To Meet Your 
Requirements. Oracle Corporation White Paper, 
1995. http://www.europa.com/~orapub 
Rubinstein, M., Firstenberg, I. Patterns Of Problem 
Solving. Prentice Hall, 1995. ISBN 0-13- 
122706-8 
Saksena, Virag. Identifying Resource Intensive SQL 
In A Production Environment. Oracle Corpora-tion 
White Paper, 1996. 
http://www.europa.com/~orapub 
Saksena, Virag. Tuning The Oracle Server - Identi-fying 
Internal Contention. Oracle Corporation 
White Paper, 1996. 
http://www.europa.com/~orapub 
Shallahamer, C. Avoiding A Database Reorganiza-toin. 
Oracle Corporation White Paper, 1995. 
http://www.europa.com/~orapub 
Shallahamer, C. Predicting Computing System 
Throughput and Capacity. Oracle Corporation 
White Paper, 1995. 
http://www.europa.com/~orapub 
Shallahamer, C. Total Performance Management. 
Oracle Corporation White Paper, 1994. 
http://www.europa.com/~orapub 
9. About the Presenter/Author 
Mr. Shallahamer's ten-plus years of experience in the 
IT marketplace brings a unique balance of controlled 
creativity to any person, team, or classroom. As the 
President of Orapub, Inc., his objective is to empower 
Oracle performance specialists and technical archi-tects. 
Recently, Mr. Shallahamer directed the global 
technical training efforts for Oracle Consulting's 
technical consultants. Previously he managed the 
Western area of Oracle Services System Performance 
Group. Since joining Oracle in 1989, Mr. Shallaha-mer 
has co-founded three highly respected technical 
consulting groups (National Product Specialist Team, 
Core Technologies, System Performance Group) and 
has worked at hundreds of client sites around the 
world. His specializations include business manage-
ment, training/education, performance optimization 
and management, performance predic-tion/ 
modeling/planning, and system/technical archi-tecture 
design related research, training, coaching, 
and consulting. As a result, Mr. Shallahamer has had 
the pleasure to publish and present a number of pa-pers 
at the EOUG, OAUG, IOUG, Openworld, and in 
Oracle Magazine.
10. Figures 
All tools shown below are available, for free, from OraPub’s web-site (http://www.europa.com/~orapub). 
-- file sw5.sql 
col event format a25 heading "Wait Event" trunc 
col tws format 99999999 heading "Total|Waits" 
col tt format 99999999 heading "Total|Timouts" 
col tw format 99999.9 heading "Time(sec)|Waited" 
col avgw format 9999 heading "Avg (ms)|Wait" 
select event, 
total_waits tws, 
total_timeouts tt, 
time_waited/1000 tw, 
average_wait avgw 
from v$system_event 
order by time_waited desc; 
SQL> @sw5 
Total Total Time(sec) Avg (ms) 
Wait Event Waits Timouts Waited Wait 
------------------------- --------- --------- --------- -------- 
enqueue 5804940 635 15780.5 3 
buffer busy waits 2710683 10031 8469.5 3 
SQL*Net message from clie 3624 0 3980.5 1098 
rdbms ipc message 57584 2987 3332.3 58 
latch free 1046312 1024085 2511.7 2 
pmon timer 16262 6114 2326.1 143 
smon timer 81 77 2322.9 ##### 
log file parallel write 267082 0 1644.0 6 
db file parallel write 21188 3366 1253.2 59 
rdbms ipc reply 8849 2154 775.5 88 
PL/SQL lock timer 1473 1347 270.8 184 
db file scattered read 1145592 0 183.7 0 
free buffer waits 1820 1608 164.5 90 
write complete waits 3482 492 122.1 35 
log file sync 8831 59 111.9 13 
db file sequential read 319650 0 55.8 0 
log buffer space 846 219 47.4 56 
log file switch completio 1141 22 39.9 35 
control file parallel wri 8052 0 39.2 5 
db file single write 3110 0 10.2 3 
log file single write 523 0 2.6 5 
control file sequential r 11578 0 .3 0 
row cache lock 12 0 .3 23 
log file sequential read 264 0 .3 1 
SQL*Net message to client 3625 0 .1 0 
process startup 3 0 .0 2 
SQL*Net break/reset to cl 42 0 .0 0 
instance state change 1 0 .0 0 
Figure 1.
-- file sw4.sql 
col sid format 9999 heading "Sess|ID" 
col event format a25 heading "Wait Event" trunc 
col tws format 9999999 heading "Total|Waits" 
col tt format 99999 heading "Total|Timouts" 
col tw format 9999999 heading "Time (ms)|Waited" 
col avgw format 9999 heading "Avg (ms)|Wait" 
select sid, event, 
total_waits tws, 
total_timeouts tt, 
time_waited tw, 
average_wait avgw 
from v$session_event 
where sid = &sid 
order by time_waited desc,event; 
SQL> @sw4 
Enter value for sid: 10 
Sess Total Total Time (ms) Avg (ms) 
ID Wait Event Waits Timouts Waited Wait 
----- ------------------------- -------- ------- --------- -------- 
10 enqueue 537484 54 1241548 2 
10 buffer busy waits 244341 755 621615 3 
10 latch free 80715 78496 120973 1 
10 write complete waits 207 16 5447 26 
10 free buffer waits 55 52 5258 96 
10 log file switch completio 75 1 2446 33 
10 log buffer space 34 8 1738 51 
10 SQL*Net message from clie 36 0 7 0 
10 SQL*Net message to client 36 0 0 0 
10 db file sequential read 12 0 0 0 
Figure 2
-- file sw2.sql 
col event format a25 heading "Wait Event" trunc 
col state format a15 heading "Wait State" trunc 
col siw format 99999 heading "Waited So|Far (ms)" 
col wt format 9999999 heading "Time Waited|(ms)" 
select event, 
state, 
seconds_in_wait siw, 
wait_time wt 
from v$session_wait 
where sid = &sid 
order by event; 
SQL> @sw2 
Enter value for sid: 10 
Waited So Time Waited 
Wait Event Wait State Far (ms) (ms) 
------------------------- --------------- --------- ----------- 
latch free WAITING 2 0 
SQL> / 
Enter value for sid: 10 
Waited So Time Waited 
Wait Event Wait State Far (ms) (ms) 
------------------------ --------------- --------- ----------- 
enqueue WAITED SHORT TI 1 -1 (both values bogus) 
SQL> / 
Enter value for sid: 10 
Waited So Time Waited 
Wait Event Wait State Far (ms) (ms) 
------------------------- --------------- --------- ----------- 
buffer busy waits WAITING 1 2(bogus value) 
SQL> / 
Enter value for sid: 10 
Waited So Time Waited 
Wait Event Wait State Far (ms) (ms) 
------------------------- --------------- --------- ----------- 
buffer busy waits WAITING 0 0 
Figure 3
-- file sw3.sql 
col sid format 9999 heading "Sess|ID" 
col event format a10 heading "Wait Event" wrap 
col state format a10 heading "Wait State" trunc 
col siw format 99999 heading "W'd So|Far (ms)" 
col wt format 9999999 heading "Time|W'd (ms)" 
col p1 format 9999999999999 heading "P1" 
col p2 format 999999999 heading "P2" 
col p3 format 99999 heading "P3" 
select sid, event, 
state, 
seconds_in_wait siw, 
wait_time wt, 
p1, p2, p3 
from v$session_wait; 
SQL> @sw3 
Sess W'd So Time 
ID Wait Event Wait State Far (ms) W'd (ms) P1 P2 P3 
----- ---------- ---------- -------- -------- -------------- ---------- ------ 
45 latch free WAITING 0 0 3759137796 9 0 
63 latch free WAITED KNO 0 1 3759137704 9 0 
1 pmon timer WAITING 1 0 300 0 0 
6 enqueue WAITING 0 0 1398013958 0 0 
15 enqueue WAITING 0 0 1415053318 327711 53651 
… 
11 enqueue WAITING 0 0 1415053318 327711 53651 
14 buffer bus WAITING 0 0 5 8 1016 
y waits 
… 
23 buffer bus WAITING 0 0 5 8 1016 
y waits 
28 db file se WAITED SHO 0 -1 5 31 1 
quential r 
ead 
12 db file sc WAITED SHO 0 -1 5 29 10 
attered re 
ad 
19 db file sc WAITED SHO 0 -1 5 26 5 
attered re 
ad 
4 smon timer WAITING 94 0 300 0 0 
7 SQL*Net me WAITED SHO 0 -1 1650815232 1 0 
ssage from 
client 
22 SQL*Net me WAITING 43 0 1650815232 1 0 
ssage from 
client 
Figure 4
SQL> @sw5 
Total Total Time(sec) Avg (ms) 
Wait Event Waits Timouts Waited Wait 
------------------------- --------- --------- --------- -------- 
enqueue 5804940 635 15780.5 3 
buffer busy waits 2710683 10031 8469.5 3 
SQL*Net message from clie 3624 0 3980.5 1098 
rdbms ipc message 57584 2987 3332.3 58 
latch free 1046312 1024085 2511.7 2 
pmon timer 16262 6114 2326.1 143 
smon timer 81 77 2322.9 ##### 
log file parallel write 267082 0 1644.0 6 
db file parallel write 21188 3366 1253.2 59 
rdbms ipc reply 8849 2154 775.5 88 
PL/SQL lock timer 1473 1347 270.8 184 
db file scattered read 1145592 0 183.7 0 
free buffer waits 1820 1608 164.5 90 
write complete waits 3482 492 122.1 35 
log file sync 8831 59 111.9 13 
db file sequential read 319650 0 55.8 0 
log buffer space 846 219 47.4 56 
log file switch completio 1141 22 39.9 35 
control file parallel wri 8052 0 39.2 5 
db file single write 3110 0 10.2 3 
log file single write 523 0 2.6 5 
control file sequential r 11578 0 .3 0 
row cache lock 12 0 .3 23 
log file sequential read 264 0 .3 1 
SQL*Net message to client 3625 0 .1 0 
process startup 3 0 .0 2 
SQL*Net break/reset to cl 42 0 .0 0 
instance state change 1 0 .0 0 
Figure 5
-- file swenque.sql 
col sid format 9999 heading "Sid" 
col enq format a4 heading "Enq." 
col edes format a30 heading "Enqueue Name" 
col md format a10 heading "Lock Mode" 
col p2 format 9999999 heading "ID 1" 
col p3 format 9999999 heading "ID 2" 
select sid, 
chr(bitand(p1,-16777216)/16777215)|| 
chr(bitand(p1, 16711680)/65535) enq, 
decode( 
chr(bitand(p1,-16777216)/16777215)||chr(bitand(p1, 16711680)/65535), 
'TX','Transaction accessing a rbs', 
'ST','Space Mgt activity (e.g., uet$, fet$)', 
'SS','Sort Segment activity’, 
'TM','DML activity, prevents object DDL’, 
'UL','User Defined', 
chr(bitand(p1,-16777216)/16777215)||chr(bitand(p1, 16711680)/65535)) 
edes, 
decode(bitand(p1,65535),1,'Null',2,'Sub-Share',3,'Sub-Exlusive', 
4,'Share',5,'Share/Sub-Exclusive',6,'Exclusive','Other') md, 
p2, 
p3 
from v$session_wait 
where event = 'enqueue' 
SQL>@swenq 
Sid Enq. Enqueue Name Lock Mode ID 1 ID 2 
----- ---- ------------------------------ ---------- -------- -------- 
10 TX RBS Transaction Exclusive 131072 54387 
11 TX RBS Transaction Exclusive 131072 54387 
14 TX RBS Transaction Exclusive 131072 54387 
23 TX RBS Transaction Exclusive 131072 54387 
15 TX RBS Transaction Exclusive 131072 54387 
61 TX RBS Transaction Exclusive 131072 54387 
57 TX RBS Transaction Exclusive 131072 54387 
55 TX RBS Transaction Exclusive 131072 54387 
50 TX RBS Transaction Exclusive 131072 54387 
45 TX RBS Transaction Exclusive 131072 54387 
44 TX RBS Transaction Exclusive 131072 54387 
42 TX RBS Transaction Exclusive 131072 54387 
40 TX RBS Transaction Exclusive 131072 54387 
70 TX RBS Transaction Exclusive 131072 54387 
66 TX RBS Transaction Exclusive 131072 54387 
63 TX RBS Transaction Exclusive 131072 54387 
62 TX RBS Transaction Exclusive 131072 54387 
39 TX RBS Transaction Exclusive 131072 54387 
37 TX RBS Transaction Exclusive 131072 54387 
35 TX RBS Transaction Exclusive 131072 54387 
33 TX RBS Transaction Exclusive 131072 54387 
Figure 6
SQL> @sw3 
Sess W'd So Time 
ID Wait Event Wait State Far (ms) W'd (ms) P1 P2 P3 
----- ---------- ---------- -------- -------- -------------- ---------- ------ 
28 latch free WAITED KNO 0 8 3759327632 11 5 
48 latch free WAITING 0 0 3759327632 11 6 
68 latch free WAITING 0 0 3759326280 11 5 
74 latch free WAITING 0 0 3759334496 11 0 
75 latch free WAITING 0 0 3759337616 11 0 
72 latch free WAITING 0 0 3759327632 11 7 
10 enqueue WAITING 0 0 1415053318 131101 73620 
33 enqueue WAITING 1 0 1415053318 262169 73576 
11 enqueue WAITING 1 0 1415053318 262169 73576 
40 enqueue WAITING 1 0 1415053318 262169 73576 
70 enqueue WAITING 1 0 1415053318 262169 73576 
61 enqueue WAITING 1 0 1415053318 262169 73576 
45 enqueue WAITING 0 0 1415053318 131101 73620 
15 enqueue WAITING 1 0 1415053318 262169 73576 
14 buffer bus WAITING 0 0 5 8 1016 
y waits 
37 buffer bus WAITING 0 0 5 8 1016 
y waits 
42 buffer bus WAITING 0 0 5 8 1016 
y waits 
55 buffer bus WAITING 0 0 5 8 1016 
y waits 
63 buffer bus WAITING 1 0 5 8 1016 
y waits 
62 buffer bus WAITING 0 0 5 8 1016 
y waits 
66 buffer bus WAITING 1 0 5 8 1016 
y waits 
57 buffer bus WAITING 0 0 5 8 1016 
y waits 
50 buffer bus WAITING 0 0 5 8 1016 
y waits 
44 buffer bus WAITING 0 0 5 8 1016 
y waits 
39 buffer bus WAITING 0 0 5 8 1016 
y waits 
12 db file se WAITED SHO 2 -1 5 16 1 
quential r 
ead 
6 db file sc WAITED SHO 0 -1 5 299 4 
attered re 
ad 
Figure 7
-- file swdbb.sql 
col owner format a15 heading "Obj Owner" wrap 
col sname format a20 heading "Obj Name" wrap 
col stype format a10 heading "Obj Type" wrap 
col tblsp format a10 heading "TBS Name" wrap 
col fname format a40 heading "" 
select owner, 
segment_name sname, 
segment_type stype, 
e.tablespace_name tblsp, 
file_name fname 
from dba_extents e, 
dba_data_files f 
where e.file_id = f.file_id 
and e.file_id = &file_id 
and e.block_id <= &block_id 
and e.block_id + e.blocks > &block_id 
/ 
SQL> @swdbb 
Enter value for file_id: 5 
Enter value for block_id: 8 
Obj Owner Obj Name Obj Type TBS Name 
--------------- -------------------- ---------- ---------- 
CSHALLAH ACCOUNT TABLE USERS 
/u03/oradata/fox/users01.dbf 
Figure 8 
-- file swlatch.sql 
col lid format 9999 heading "Latch #" 
col lnm format a40 heading "Latch Name" 
select latch# lid, 
name lnm 
from v$latch 
where latch# = &latch_number 
/ 
SQL> @swlatch 
Enter value for latch_number: 11 
Latch # Latch Name 
------- ---------------------------------------- 
11 cache buffers chains 
Figure 9 
$ sar -u 5 5 
SunOS orapub1 5.5.1 Generic sun4u 
14:53:17 %usr %sys %wio %idle 
14:53:22 87 13 0 0 
14:53:27 93 7 0 0 
14:53:32 88 12 0 0 
14:53:37 88 12 0 0 
14:53:42 87 13 0 0 
Average 89 11 0 0 
Figure 10
SQL> select sid, sql_hash_value from v$session; 
Sess 
ID SQL_HASH_VALUE 
----- -------------- 
1 0 
2 0 
3 0 
4 -1.866E+09 
5 2020739258 
6 1724283224 
7 0 
8 1724283224 
10 -7079893 
11 -7079893 
12 -489192978 
13 -489192978 
14 -7079893 
15 -7079893 
19 -598940500 
22 -1.699E+09 
23 -7079893 
27 -598940500 
28 -489192978 
30 -489192978 
33 -1.945E+09 
35 -7079893 
37 -7079893 
39 -7079893 
40 -7079893 
42 -7079893 
44 -7079893 
45 -7079893 
48 -7079893 
50 -7079893 
55 -7079893 
57 -7079893 
58 0 
61 -7079893 
62 -7079893 
63 -7079893 
66 -7079893 
68 -598940500 
70 -7079893 
72 -489192978 
74 -944108210 
75 -598940500 
76 0 
SQL> @sqls2 -7079893 
Database: op01 1998 Jul 08 11:21pm 
Report: sstmt2.sql Page 1 
SQL Statement Text (Ident=-7079893) 
Line SQL Statement 
------ ----------------------------------------------------------------- 
0 UPDATE ACCOUNT SET BROKER_ID=BROKER_ID WHERE ID = '25372' 
Figure 11

Apps session wait_tables

  • 1.
    Direct Contention IdentificationUsing Oracle’s Session Wait Virtual Tables Craig A. Shallahamer OraPub, Inc. (http://www.europa.com/~orapub) 1. Abstract With the introduction of the session wait family of virtual performance tables, standard performance tuning practices have been radically changed. No longer is it necessary to gather volumes of data, cal-culate a seemingly ever growing number of perform-ance ratios, and then finally perform analysis. Through the session wait views, Oracle database sys-tems “tell” performance specialists specifically where contention resides and what is causing the contention. This dramatically reduces problem identification time so more time can spent on problem resolution analy-sis. This paper explains how one can use the session wait views to quickly identify contention, discusses various scripts to quickly empower one, and presents techniques to shift one’s thinking from traditional ra-tio analysis to direct problem identification. 2. Introduction An optimized computing system benefits many. Us-ers are able to perform their work in a timely manner and without interruption, computing system adminis-trators can concentrate on other work, and the busi-ness can function without anyone thinking about the information system. Unfortunately this is rarely the case. With the introduction of Oracle7, a new and direct method of detecting contention and diagnosing prob-lems was made available. With the desire for an op-timized system, the professional community’s seem-ingly endless affair for traditional contention identification methods, and the introduction of new methods, have left the database administrator some-what confused, surely misdirected, resulting in wasted time and money, non-optimal computing system per-formance, and decreased system stability. Exceptional performance tuning papers are extremely rare. Virag Saksena’s papers (see references) are truly exceptional and cover areas not mentioned in this paper and briefly touch upon some of the areas covered in this paper. This paper was written to spe-cifically inform performance specialists about the new method of contention identification using Ora-cle’s session wait virtual tables. To accomplish this task, this paper first presents de-tails about the session wait family of virtual perform-ance tables, then discusses the methodology differ-ences with using session wait statistics as opposed to the traditional ratio methods, and finally a very real case study is presented, dissected, and analyzed. 3. Session Wait Statistics A baby and an adult both have a sore throat. When asked by the doctor, “What’s wrong?” the baby will look at the doctor and scream (trust me, I know.), whereas the adult will present attributes about the pain. This not so subtle difference directs the doctor towards different problem identification methods. With the baby, the doctor must perform many tests, gather the data, consolidate the data, perform analy-sis, determine the problem, and make recommenda-tions. With an adult, he simply asks a few questions and then can immediately begins a more detailed ex-amination. Starting with Oracle7, the Oracle server “acts like an adult.” The session wait statistics tells one exactly “what hurts.” Whereas with earlier versions of the sever, one had to perform costly ratio based analysis to determine where the “pain” was originating from. 3.1 “There is always a bottleneck” Don’t fall into the trap of saying, “My system’s slow but there is no bottleneck.” To summarize, you’re wrong. There is always a bottleneck. If not, com-puting systems would run infinitely fast. The fastest car on the biggest highway continually faces bottle-necks. It could be the number of cars on the freeway, the number of lanes, the weather, an accident ahead, the type of petrol, the skill of the driver, the car de-sign, the engine design, the wind direction, one’s per-sonal risk quotient, one’s respect for others, and the list goes on. But there is always a bottleneck. In an Oracle system, even a highly tuned Oracle sys-tem, there is always a bottleneck. Processes are al-
  • 2.
    ways waiting forsome resource. It could be data al-ready in the SGA, data residing on disk, a latch (seri-alizing execution for a piece of server kernel code), an enqueue (access to an internal structure), a lock (access to a user defined structure), or many other items. But the bottom line is, there is always a bot-tleneck, a session is always waiting for something (either to start something or waiting for it to finish), and the session wait statistics tells one exactly what a specific session is specifically waiting for. 3.2 Session Wait Views There is actually a family of session wait based views. Each view has a special purpose and they compliment each other providing direction for per-formance specialists. The virtual tables are v$system_event, v$session_event, and v$session_wait. Each virtual table along with an actual script and real-life output is presented below. 3.2.1 High level system perspective using v$system_event The v$system_event view looks at sessions at a high-level perspective. It doesn’t report which specific session is waiting for which specific resource or ob-ject. It sums all the waits since the database instance was last started by wait category. As with all “in-stance accumulating” statistics (e.g., v$sysstat), col-lecting and reporting the differences over periods of time is much more useful than a single query.[Total Performance Management] There are only five columns in the v$system_event view. Each is presented below. · Event. This is simply the general name of the event. While there are many wait events, the most common events are latch waits, db file scattered read, db file sequential read, en-queue wait, buffer busy wait, and free buffer waits. While I will be detailing the most com-mon events, presenting each wait event is out of scope for this paper. To get details about other events one is experiencing, contact an Oracle representative or search the WWW. · Total_waits. This is the total number of waits, i.e., a count, for the specific event since the da-tabase instance has started. · Total_timeouts. This is the total number of wait time-outs, i.e., a count, for the specific event since the database instance has started. Not all waits result in a time-out. Some waits will try “forever” (an exponential back-off algo-rithm is sometimes used) while others will try once or a few times, stop, and perform some coded action. · Time_waited. This is the total time, in milli-seconds, all sessions have waited for the specific event since the database instance has started. · Average_wait. This is the average time, in milliseconds, all sessions have waited for the specific event since the database instance has started. As one would expect, this should equal time_waited divided by total_waits. Figure 1. presents a v$system_event based tool and sample output. Figure 1. clearly shows sessions waiting for enqueues, busy database block buffers, latches, and database files. Each of these common waits will be discussed in this paper. Once the over-all system has been examined, one drills-down into each one of the significant wait areas, which we begin presenting below. 3.2.2 High level session perspective using v$session_event The v$session_event virtual view presents exactly the same information as the v$system_event virtual view except it includes the session id for each event and information is “zeroed” out after a session logs off. For example, if session ten’s statistics suddenly drop, that’s because session ten just logged off and another session logged in and was assigned session number ten. This view is very useful for determining which ses-sions are causing or experiencing the most waits and then drilling down into the contention specifics. Figure 2 below presents a v$session_event based tool and sample output. In situations where the session id is not known or is not relevant, one could execute the Figure 2 script without the session id filter. In the ex-ample shown, session id is asked for and supplied. Figure 2 clearly shows that session ten is experienc-ing significant enqueue, buffer busy, and latch waits. As we will see, this combination points towards ex-cessive buffer activity typically caused by poorly tuned SQL, poor application design, or both. 3.2.3 Low level session perspective using v$session_wait The v$session_wait view is the most complicated and the most misunderstood of the session wait fam-
  • 3.
    ily. I supposethis is because unlike the v$system_event and the v$session_event view, the v$session_wait view reports session level wait in-formation in real-time. It does not store or summa-rize information, but rather dumps out the raw infor-mation as it’s occurring. Activity in an Oracle database occurs very, very fast (as opposed to other database vendors of course), so even quickly re-running a v$session_wait query may look totally different than a split-second before. Don’t be alarmed by this, but rather understand why this occurs. In addition to presenting information in real-time, the v$session_wait view provides detailed and specific information about the actual waits. For example, it will direct one to sessions experiencing latch conten-tion and show which latch the sessions are waiting for. Or, if a session is waiting for access to a block, the actual database file number and data block num-ber are provided. The v$session_wait view also presents timing details, much like the v$system_event and v$session_event views. However, because of the v$session_wait’s real-time reporting, the times presented mean differ-ent things depending on the wait situation. This is explained in more detail below. The v$session_wait columns are presented below. · Sid. The session id number. The same as the session id number in v$session_event and v$session. · Seq#. The internal sequence number of the wait for this session. Use this column to determine the number of waits, i.e. counts, the session has experienced. · Event. This is simply the general name of the event. While there are many wait events, the most common events are latch waits, db file scattered read, db file sequential read, en-queue wait, buffer busy wait, and free buffer waits. While I will be detailing the most com-mon events, presenting each wait event is out of scope for this paper. To get details about other events one is experiencing, contact an Oracle representative or search the WWW · P[1-3]. These three parameters are pointers to more details about the specific wait. The pa-rameters are foreign keys to other views and are wait event dependent. For example, for latch waits, p2 is the latch number, which is a foreign key to v$latch. But for db file sequential read (indexed read, yes an indexed read), p1 is the file number (foreign key to v$filestat or dba_data_files) and p2 is the actual block number (related to dba_extents, sys.uet$, sys.fet$). To use these parameters, one needs a list of the waits with their associated parameters. Again, for parameter specifics contact an Oracle representative or search the WWW. The p[1- 3]text column may provide some information. · P[1-3]raw. This is the raw representation of p[1-3]. This is not used very often and none of the tools presented in this paper make reference. · P[1-3]text. Sometime the name of the parame-ter, p[1-3], is provided. Don’t count on it. · State. This is a very important parameter be-cause is tells one how to interpret the next two columns discussed below, wait_time and sec-onds_ in_wait. If one misinterprets the state or chooses to ignore it, one will most likely misin-terpret the wait_time and seconds_in_wait numbers. The state column has four possible values. · Waiting. The session is currently waiting for the event. · Waited unknown time. The instance pa-rameter, timed_statistics is set to false. · Waited short time. Indeed, the session did not wait even one clock tick to get what it wanted, so no wait time was re-corded. · Waited known time. Once the session has waited and then received what it wanted, the state turns from waiting to waited known time. · Wait_time. The value is dependent on the state column discussed above. If the state column value is: · Waiting, then the wait_time value is bo-gus. · Waited unknown time, then the wait_time value is bogus. · Waited short time, then the wait_time value is bogus. · Waited known time, then the actual wait time, in milliseconds, is shown. One is very lucky to see this value, because if the session begins waiting for another re-source, i.e., status will now be waiting, the wait_time value turns bogus. · Seconds_in_wait. The value is dependent on the state column. If the state column value is:
  • 4.
    · Waiting, thenthe actual time, in millisec-onds, is shown. If one does see a value, hopefully, one won’t see it again if re-querying. If so, the session is having to wait a relatively long time. If one repeat-edly queries, one will get a good idea when a session does wait, how long it waits. · Waited unknown time, then the sec-onds_ in_wait value is bogus. · Waited short time, then the sec-onds_ in_wait value is bogus. · Waited known time, then the sec-onds_ in_wait value is bogus. Figure 3 shows the source code and an example of using the v$session_wait view to gather timing in-formation. Whereas, Figure 4 shows the code and an example of using the v$session_wait view to gather “drill-down” information. 4. Changing One’s Approach As presented above, using session wait statistics en-ables the performance specialist to pursue a different and much more productive performance tuning ap-proach. While the general performance management approach, as outlined in the Total Performance Man-agement paper (see reference section), remains the same, the drill-down strategy has been radically changed. This section is aimed at contrasting the two basic drill-down approaches to help one understand the differences so one can make the switch to the more powerful of the two. When drilling down using session wait statistics, one typically starts out at the high level using the v$system_events view. Based upon the statistics gathered, one immediately begins to drill-down using the v$session_events and the v$session_wait views. One continues this cycle until the contention infor-mation required is found. Think about the power. In the past, when a person reported a problem, one begin by looking at ratios, tracing their specific session, etc. Now one can look to see exactly why their session is waiting. One can even say “You are waiting for the X latch because everyone wants to update block number x, in file number y.” Not that anyone would actually say this, but the information is available. Now let’s outline the traditional ratio based approach. There are many sub-systems within an Oracle system. There are many latches, caches, hash chains, lists, processes, etc. To determine if a particular area is “doing well,” one had to sample some statistics over time and calculate the ratios which should point one in the right direction. Usually the statistics do point the performance specialist in the right direction, but one must truly be a performance specialist, with many years of training, before this method becomes effec-tive. What usually happens is various miscellaneous system changes are made which seemed to work in the past. If someone asked why a specific change was made, they would typically receive a response like, “Well if something works for me, I stick with it!” Now let’s contrast the two methods. The ratio method is like the newborn baby, who just screams when it hurts. The doctor has a very difficult problem to solve because before he can not effectively com-munication with the child. Whereas with an adult, effective communications are available. Contrasting this with the session wait method, one simply per-forms a few simple queries and lets the system tell the doctor exactly where it hurts. It’s obviously more dif-ficult than that, but I think you get the point. So next time you look at the database block buffer cache hit ratio and it’s 60% but there are no related session waits, don’t worry about it. And when the database block buffer cache hit ratio is 95% but there are no related session waits, don’t worry about it. And when sessions begin to wait, don’t worry about it, just let the statistics guide you down the critical path towards productive and effective performance tuning. 5. Case Study What is presented below is real life. Nothing is made up and everything is real. Notice no ratios are used during the analysis, yet the problem and it’s related affects were quickly discovered and analyzed. Our general method is the Total Performance Method utilizing the holistic problem identification method-ology to approach the problem from an Oracle server, application, and operating system perspective. The Oracle server approach uses session wait statistics ex-clusively. The application section only references the most resource consuming SQL, and the operating system was diagnosed using only the UNIX sar util-ity. All standard tools and available to everyone. So here we go… 5.1 Oracle Server Investigation 5.1.1 High level review To begin our analysis, we start with examining the overall situation. We execute sw5.sql which refer-
  • 5.
    ences the v$system_eventsview. The results are shown in Figure 5. This system is experiencing serious contention and the users must be furious. Five different wait types vividly show themselves. Enqueue waits, buffer busy waits, SQL*Net message from client, rdbms ipc message, and latch free waits. The enqueue waits are by the far the most prevalent, but experi-ence tells me all the significant waits are all closely related. I’m not interested in the SQL*Net wait message based upon my experiences, conversations with my peers, and SQL*Net is not being used in the system being monitored. Because db file sequential read is one of the most common waits in many systems, it will be discussed below. 5.1.2 Enqueue Waits We will begin our quest by investigating the enqueue waits. Enqueues are probably one of the most misun-derstood areas in the Oracle server. Much of the problem stems from the fact there are many different types of enqueues and determining which enqueue a process is waiting for, what the enqueue means, and what to do about it, is difficult to determine and to find relevant documentation. Therefore, before we dig into how to diagnose enqueue waits, a discussion about protecting Oracle internal structures is in order. User implemented locks protect user defined struc-tures (e.g., gl.gl_code_combinations), enqueues protect Oracle internal structures (e.g., uet$ and fet$), and latches ensure specific sections of Oracle kernel code are executed serially by a single session. For example, allowing a process to update the uet$ table while another process updates the fet$ table could have disastrous affects. A difference between latches and enqueues is latches maintain no sequence or ordering. The latch algo-rithm uses either timers to sleep, wake up, and retry (both single and multi-CPU environments), or in multiprocessor environments, a process can “spin” and retry. Since all latch waiters are concurrently re-trying, any process may get the latch. While unset-tling, it is theoretically possible the first process to try to get a latch, may be the last process to get the latch. Latching algorithms and operating system schedulers obviously try to minimize this occurrence. However, on an extremely latch wait laden environment, this type of problem can and has occurred. An enqueue is a sophisticated locking mechanism which permits several processes to share known re-sources to varying degrees. Any object which can be concurrently used can be protected with an enqueue. For example, Oracle allows varying levels of sharing on tables: two processes can lock a table in share mode or in share update mode. Enqueues are platform-specific locking mechanisms. An enqueue allows a server-side process to store a value in a lock, that is, the requested lock mode. An operating system lock manager, manages the locked resources. If a process cannot be granted a lock, be-cause it is incompatible with the lock mode requested, the operating system places the requesting process in a FIFO wait queue. The instance parameter enqueue_resources sets the number of resources that can be locked by the lock manager. Since multiple DML locks can be placed on an object, there needs to be enough enqueues to cover the number of DML locks. For example, if three users are modifying data in one table, then three DML locks will be required. If three users are modi-fying data in two tables, then six DML locks will be required. As of Oracle7, all DDL locks are handled internally by the Oracle kernel and do not require an enqueue. Also, the Oracle kernel needs around twenty enqueues for overhead. Therefore, the maxi-mum sensible enqueue_resources value would be twenty plus the summation of the number of objects times the number of DML transactions against the object. Typically, enqueue_resources is set much lower. In fact, by default, enqueue_resources is generally set to the instance parameter sessions times five. Back to our investigation. Figure 6 shows a very use-ful yet somewhat cryptic script. The specific en-queue waits are derived from the p1 parameter. Each enqueue wait can be drilled-down even further by using the p2 and p3 parameters. For example, the TX enqueue’s p2 and p3 parameters points one to the undo segment, its slot, and its sequence number. In most cases, drilling down to just to the specific en-queue wait name will provide one with plenty of in-formation. As v$system_events forewarned, there is significant enqueue waiting occurring. This script output doesn’t show this, but nearly three-quarters of the users on this system are waiting for the same enqueue re-source, a transaction enqueue. More specifically, the transaction enqueue is held in exclusive mode when a transaction initiates its first change and held until the transaction performs either commit or a rollback. This directs us to be on the lookout for intense DML activity and/or the rollback segments are poorly con-
  • 6.
    figured. In thisparticular situation, the rollback seg-ments are configured to handle the application’s ex-pected workload. If however, we address the DML concern and transaction enqueues persists, then the rollback segments will need to be reconfigured. 5.1.3 Buffer Busy Waits The next wait to investigate is buffer busy waits. A buffer is “busy” when another process is reading it into the data block buffer cache or the related block(s) are being “converted” into a “cleaned-up” block state. If a block is being repeatedly updated, locating and accessing the buffer(s) could cause a session to wait for the block(s). When a session updates row data in a block, the Ora-cle kernel performs the least amount of work neces-sary for the session to continue performing other use-ful work. Later on, the block(s) will be converted back into a stable state. However, if a specific block is repeatedly updated, “copies” of the block are made to ensure a user is not held waiting and internal Ora-cle integrity is maintained. While this process in-creases performance from one perspective, the time involved to locate the busy block will increase, thereby decreasing performance from another per-spective. (See the latch waits section below.) This process can cause a buffer(s) to become busy and in-duce a buffer busy wait. We determine the actual buffer being requested by its file number and its block number. Figure 7 shows the sw3.sql script being used to show the parameters for all the waits, for all the sessions. This much detail can only come from the v$session_wait view. On a very large system, the output could be pages long. We will also use this output for diagnosing the latch wait activity. For buffer busy waits, db file sequential reads (in-dex reads), and db file scattered reads (full table scans), p1 is the file number and p2 is the block number. Using this information combined with dba_data_files and dba_extents, we can determine the actual operating system file name and database object these sessions are waiting for. In this case study, nearly every busy buffer is for file number five, block number eight. File number five is /u03/oradata/fox/users01.dbf and buffer number eight is in the account table. Let’s review. The enqueue waits are directing one to be on the lookout for heavy DML activity or poorly configured rollback segments. The buffer busy waits directs one to a specific block, in the account table and in the users01.dbf database file. If there is an I/O bottleneck, the users01.dbf file will most likely be very “hot.” If not, they will most likely be heavy SGA data block buffer activity. The picture is be-coming clearer. 5.1.4 Latch Waits Figure 7 shows many sessions waiting on the same latch. The latch number is provided by p2, which references the latch number in the v$latch view. The script swlatch.sql, shown in Figure 9 shows the cache buffer chain latch is the latch sessions are waiting for. We have already discussed latching in the previous two sections, but there is still more details to present to better understand the latching process. Certain parts of the Oracle kernel code should only be run by a single process at a time to ensure certain structures are properly maintained (e.g., one wouldn't want to query a node from a linked list if someone else was simultaneously deleting the node’s parent). A latch is a data structure and a protocol to ensure only one ses-sion accesses certain parts of the kernel code at a time. One latch in particular is the cache buffer chain latch. To allow an Oracle server-side process to quickly determine whether a desired database block resides in the buffer cache, Oracle keeps a hash table in the SGA. This hash table consists of several hash chains (there are _db_block_hash_buckets hash chains in the hash table). Each hash chain can be viewed as a hash bucket with a sequential linked list of blocks related to the specific bucket, hence the term hash chain. Each database block is uniquely identified by its file number and its block number. The hashing algorithm “hashes” each data block about to reside in the data block buffer cache. The hash function inputs are the file number, the block number, and the block type. The hash function output is the appropriate hash chain. Any time a server-side process needs to reference a block, for any reason, the block can be quickly refer-enced by hashing the block and then serially search-ing the appropriate hash chain for the block’s SGA address. So each time a block is inserted, deleted, or just examined, the appropriate hash chain must be ac-cessed and sequentially searched. To maintain inter-nal integrity, any Oracle server code which touches the cache buffer chain must only be executed by a single session. To accomplish this serial execution, the Oracle kernel code uses the cache buffer chain latch.
  • 7.
    If multiple sessionswant to run a section of kernel code, then one or more sessions must wait for the latch to become available. Until it does become available, they must wait. This wait shows up as a session wait, latch wait. As discussed in the previous two sections, the cache buffer chain latch wait tells one a process is waiting to acquire the cache buffer chain latch. If a block is being updated repeatedly, “copies” of the block are made to allow the updating processes to continue per-forming useful work and to allow other processes to access the block. Unfortunately, when this occurs, the related hash chain becomes “long.” So to confirm the existence of the desired block in the SGA, the cache buffer chain latch must be held longer than normal. This can cause the cache buffer chain latch wait. We have completed our investigation from an Oracle server perspective. The evidence shows most ses-sions are performing an update, updating the same block over and over again. 5.2 Operating System Perspective No analysis is complete without looking at the com-puting system from an operating system perspective. Presented below, is a grossly abbreviated operating system investigation. But the focus of this paper is on session wait statistics, not on the operating system. In most cases, the operating system investigation will support findings from both an Oracle server and ap-plication perspective. As one will see, this case is no different. An operating system should be investigated from four angles. The I/O subsystem, the CPU subsystem, the memory subsystem, and the network subsystem. This particular computing system resides on a single host so there is no network activity occurring. While not shown below in Figure 10, memory was checked and was not a problem. That leaves CPU and I/O. The CPU and I/O subsystem were very quickly investi-gated by running the UNIX sar -u command. The results, which thirty seconds of statistics do not prove, are shown in Figure 10. The output shows a CPU bottleneck with less than one percent of the time, the CPU is waiting for information from the I/O subsystem. This shows the CPU is very busy, possibly concen-trating predominately on memory manipulation, such as very intense SGA activity. Again this supports the buffer busy, the latch, and the enqueue wait activity we discovered. When there is intense SGA activity, it is not uncom-mon to see CPU system time greater than CPU user time. Enqueue activity uses the operating system kernel code for queuing and latching uses the operat-ing system kernel code for “sleeping.” Oracle kernel code is predominately used during latch wait spinning which shows up as CPU user time. 5.3 Application Perspective So far our investigation shows something is causing serious buffer activity resulting in latch waits, buffer busy waits, enqueue waits, and a very high CPU utili-zation. Just as with the operating system investiga-tion above, this application investigation is grossly abbreviated, but serves our purpose. Since we suspect a single SQL statement is causing the problems, looking at what SQL statements are currently being run may bring our investigation full circle. Figure 11 lists all the currently running SQL statement hash values by querying from the v$session view. As we suspected, a large percentage of users are running the exact same SQL statement. Now that we have the SQL statement’s hash value we will query v$sqltext to show the actual SQL state-ment. And there’s our culprit! A very simple update statement. 6. Final Analysis This analysis was very straightforward with each piece of evidence nicely building our case. Let’s re-view our evidence. · Enqueue TX waits directs one to be on the lookout for DML activity that many sessions are running, which are accessing the same table(s). This could also indicate poorly configured roll-back segments. · Buffer busy waits directs one to a specific block, in the account table and in the us-ers01. dbf database file. · Cache buffer chain latch waits directs one that many sessions want to touch the cache buffer chain. A high update concurrency rate on a sin-gle block could cause this. · CPU subsystem saturation with most of the time spent in user mode directs one towards Oracle kernel code based CPU activity. Intense cache buffer chain latch activity, along with other SGA manipulation activity such as en-queue and buffer busy waits are just the thing to cause this.
  • 8.
    · I/O subsystemnot doing much confirms that the users01.dbf database file is not being ac-cessed much from an I/O perspective, but the blocks in the database file are being heavily ma-nipulated in the SGA. · A single SQL update statement updating a single block is being performed by a large per-centage of the sessions. Now that the problem has been identified, we need to ask, “What the heck is going on? Why is the same bloody update statement being executed over and over?” Unfortunately, this situation is not that un-common. Two situations arise which could easily cause this pattern of activity. One example is using a table for sequence number generation and the other is for low budget and worthless benchmarks or stress tests. This case study shows that even a single SQL statement, strategically placed and executed, can cause a tre-mendous amount of contention. Besides the application and benchmark design issues raised by this example, using a ratio performance tuning approach would have brought one to the same conclusion, but not nearly as quickly and not with such exactness and persuasion. 7. Conclusion This paper was written for those who find perform-ance tuning books and nearly all published perform-ance tuning papers inadequate, antiquated, and not supplying performance specialists with the most ef-fective methods to tune Oracle based systems. I hope this paper, through the scripts, the prose, the exam-ples, and the case study, have provided you with the information you need to begin significantly increasing your performance optimization productivity using Oracle virtual session wait based tables. Thank you for your time. 8. References Chatterjee, S.; Price, B. Regression Analysis by Ex-ample. John Wiley & Sons, 1991. ISBN 0-471- 88479-0 Cook, D., Dudar, M., Shallahamer, C. The Ratio Modeling Technique. Oracle Corporation White Paper, 1997. http://www.europa.com/~orapub Jain, R. The Art of Computer Systems Performance Analysis. John Wiley & Sons, 1991. ISBN 0- 471-50336-3 Levin, R.; Kirkpatrick C.; Rubin, D. Quantitative Ap-proaches to Management. McGraw-Hill Book Company, 1982. ISBN 0-07-037436-8Menascé, D.; Almeida, V.; Dowdy, L. Capacity Planning and Performance Modeling. PTR Prentice Hall, Englewood Cliffs NJ, 1994. ISBN 0-13-035494- 5 Michalko, M. Thinkertoys. Ten Speed Press, 1991. ISBN 0-89815-408-1 Millsap, C. Designing Your System To Meet Your Requirements. Oracle Corporation White Paper, 1995. http://www.europa.com/~orapub Rubinstein, M., Firstenberg, I. Patterns Of Problem Solving. Prentice Hall, 1995. ISBN 0-13- 122706-8 Saksena, Virag. Identifying Resource Intensive SQL In A Production Environment. Oracle Corpora-tion White Paper, 1996. http://www.europa.com/~orapub Saksena, Virag. Tuning The Oracle Server - Identi-fying Internal Contention. Oracle Corporation White Paper, 1996. http://www.europa.com/~orapub Shallahamer, C. Avoiding A Database Reorganiza-toin. Oracle Corporation White Paper, 1995. http://www.europa.com/~orapub Shallahamer, C. Predicting Computing System Throughput and Capacity. Oracle Corporation White Paper, 1995. http://www.europa.com/~orapub Shallahamer, C. Total Performance Management. Oracle Corporation White Paper, 1994. http://www.europa.com/~orapub 9. About the Presenter/Author Mr. Shallahamer's ten-plus years of experience in the IT marketplace brings a unique balance of controlled creativity to any person, team, or classroom. As the President of Orapub, Inc., his objective is to empower Oracle performance specialists and technical archi-tects. Recently, Mr. Shallahamer directed the global technical training efforts for Oracle Consulting's technical consultants. Previously he managed the Western area of Oracle Services System Performance Group. Since joining Oracle in 1989, Mr. Shallaha-mer has co-founded three highly respected technical consulting groups (National Product Specialist Team, Core Technologies, System Performance Group) and has worked at hundreds of client sites around the world. His specializations include business manage-
  • 9.
    ment, training/education, performanceoptimization and management, performance predic-tion/ modeling/planning, and system/technical archi-tecture design related research, training, coaching, and consulting. As a result, Mr. Shallahamer has had the pleasure to publish and present a number of pa-pers at the EOUG, OAUG, IOUG, Openworld, and in Oracle Magazine.
  • 10.
    10. Figures Alltools shown below are available, for free, from OraPub’s web-site (http://www.europa.com/~orapub). -- file sw5.sql col event format a25 heading "Wait Event" trunc col tws format 99999999 heading "Total|Waits" col tt format 99999999 heading "Total|Timouts" col tw format 99999.9 heading "Time(sec)|Waited" col avgw format 9999 heading "Avg (ms)|Wait" select event, total_waits tws, total_timeouts tt, time_waited/1000 tw, average_wait avgw from v$system_event order by time_waited desc; SQL> @sw5 Total Total Time(sec) Avg (ms) Wait Event Waits Timouts Waited Wait ------------------------- --------- --------- --------- -------- enqueue 5804940 635 15780.5 3 buffer busy waits 2710683 10031 8469.5 3 SQL*Net message from clie 3624 0 3980.5 1098 rdbms ipc message 57584 2987 3332.3 58 latch free 1046312 1024085 2511.7 2 pmon timer 16262 6114 2326.1 143 smon timer 81 77 2322.9 ##### log file parallel write 267082 0 1644.0 6 db file parallel write 21188 3366 1253.2 59 rdbms ipc reply 8849 2154 775.5 88 PL/SQL lock timer 1473 1347 270.8 184 db file scattered read 1145592 0 183.7 0 free buffer waits 1820 1608 164.5 90 write complete waits 3482 492 122.1 35 log file sync 8831 59 111.9 13 db file sequential read 319650 0 55.8 0 log buffer space 846 219 47.4 56 log file switch completio 1141 22 39.9 35 control file parallel wri 8052 0 39.2 5 db file single write 3110 0 10.2 3 log file single write 523 0 2.6 5 control file sequential r 11578 0 .3 0 row cache lock 12 0 .3 23 log file sequential read 264 0 .3 1 SQL*Net message to client 3625 0 .1 0 process startup 3 0 .0 2 SQL*Net break/reset to cl 42 0 .0 0 instance state change 1 0 .0 0 Figure 1.
  • 11.
    -- file sw4.sql col sid format 9999 heading "Sess|ID" col event format a25 heading "Wait Event" trunc col tws format 9999999 heading "Total|Waits" col tt format 99999 heading "Total|Timouts" col tw format 9999999 heading "Time (ms)|Waited" col avgw format 9999 heading "Avg (ms)|Wait" select sid, event, total_waits tws, total_timeouts tt, time_waited tw, average_wait avgw from v$session_event where sid = &sid order by time_waited desc,event; SQL> @sw4 Enter value for sid: 10 Sess Total Total Time (ms) Avg (ms) ID Wait Event Waits Timouts Waited Wait ----- ------------------------- -------- ------- --------- -------- 10 enqueue 537484 54 1241548 2 10 buffer busy waits 244341 755 621615 3 10 latch free 80715 78496 120973 1 10 write complete waits 207 16 5447 26 10 free buffer waits 55 52 5258 96 10 log file switch completio 75 1 2446 33 10 log buffer space 34 8 1738 51 10 SQL*Net message from clie 36 0 7 0 10 SQL*Net message to client 36 0 0 0 10 db file sequential read 12 0 0 0 Figure 2
  • 12.
    -- file sw2.sql col event format a25 heading "Wait Event" trunc col state format a15 heading "Wait State" trunc col siw format 99999 heading "Waited So|Far (ms)" col wt format 9999999 heading "Time Waited|(ms)" select event, state, seconds_in_wait siw, wait_time wt from v$session_wait where sid = &sid order by event; SQL> @sw2 Enter value for sid: 10 Waited So Time Waited Wait Event Wait State Far (ms) (ms) ------------------------- --------------- --------- ----------- latch free WAITING 2 0 SQL> / Enter value for sid: 10 Waited So Time Waited Wait Event Wait State Far (ms) (ms) ------------------------ --------------- --------- ----------- enqueue WAITED SHORT TI 1 -1 (both values bogus) SQL> / Enter value for sid: 10 Waited So Time Waited Wait Event Wait State Far (ms) (ms) ------------------------- --------------- --------- ----------- buffer busy waits WAITING 1 2(bogus value) SQL> / Enter value for sid: 10 Waited So Time Waited Wait Event Wait State Far (ms) (ms) ------------------------- --------------- --------- ----------- buffer busy waits WAITING 0 0 Figure 3
  • 13.
    -- file sw3.sql col sid format 9999 heading "Sess|ID" col event format a10 heading "Wait Event" wrap col state format a10 heading "Wait State" trunc col siw format 99999 heading "W'd So|Far (ms)" col wt format 9999999 heading "Time|W'd (ms)" col p1 format 9999999999999 heading "P1" col p2 format 999999999 heading "P2" col p3 format 99999 heading "P3" select sid, event, state, seconds_in_wait siw, wait_time wt, p1, p2, p3 from v$session_wait; SQL> @sw3 Sess W'd So Time ID Wait Event Wait State Far (ms) W'd (ms) P1 P2 P3 ----- ---------- ---------- -------- -------- -------------- ---------- ------ 45 latch free WAITING 0 0 3759137796 9 0 63 latch free WAITED KNO 0 1 3759137704 9 0 1 pmon timer WAITING 1 0 300 0 0 6 enqueue WAITING 0 0 1398013958 0 0 15 enqueue WAITING 0 0 1415053318 327711 53651 … 11 enqueue WAITING 0 0 1415053318 327711 53651 14 buffer bus WAITING 0 0 5 8 1016 y waits … 23 buffer bus WAITING 0 0 5 8 1016 y waits 28 db file se WAITED SHO 0 -1 5 31 1 quential r ead 12 db file sc WAITED SHO 0 -1 5 29 10 attered re ad 19 db file sc WAITED SHO 0 -1 5 26 5 attered re ad 4 smon timer WAITING 94 0 300 0 0 7 SQL*Net me WAITED SHO 0 -1 1650815232 1 0 ssage from client 22 SQL*Net me WAITING 43 0 1650815232 1 0 ssage from client Figure 4
  • 14.
    SQL> @sw5 TotalTotal Time(sec) Avg (ms) Wait Event Waits Timouts Waited Wait ------------------------- --------- --------- --------- -------- enqueue 5804940 635 15780.5 3 buffer busy waits 2710683 10031 8469.5 3 SQL*Net message from clie 3624 0 3980.5 1098 rdbms ipc message 57584 2987 3332.3 58 latch free 1046312 1024085 2511.7 2 pmon timer 16262 6114 2326.1 143 smon timer 81 77 2322.9 ##### log file parallel write 267082 0 1644.0 6 db file parallel write 21188 3366 1253.2 59 rdbms ipc reply 8849 2154 775.5 88 PL/SQL lock timer 1473 1347 270.8 184 db file scattered read 1145592 0 183.7 0 free buffer waits 1820 1608 164.5 90 write complete waits 3482 492 122.1 35 log file sync 8831 59 111.9 13 db file sequential read 319650 0 55.8 0 log buffer space 846 219 47.4 56 log file switch completio 1141 22 39.9 35 control file parallel wri 8052 0 39.2 5 db file single write 3110 0 10.2 3 log file single write 523 0 2.6 5 control file sequential r 11578 0 .3 0 row cache lock 12 0 .3 23 log file sequential read 264 0 .3 1 SQL*Net message to client 3625 0 .1 0 process startup 3 0 .0 2 SQL*Net break/reset to cl 42 0 .0 0 instance state change 1 0 .0 0 Figure 5
  • 15.
    -- file swenque.sql col sid format 9999 heading "Sid" col enq format a4 heading "Enq." col edes format a30 heading "Enqueue Name" col md format a10 heading "Lock Mode" col p2 format 9999999 heading "ID 1" col p3 format 9999999 heading "ID 2" select sid, chr(bitand(p1,-16777216)/16777215)|| chr(bitand(p1, 16711680)/65535) enq, decode( chr(bitand(p1,-16777216)/16777215)||chr(bitand(p1, 16711680)/65535), 'TX','Transaction accessing a rbs', 'ST','Space Mgt activity (e.g., uet$, fet$)', 'SS','Sort Segment activity’, 'TM','DML activity, prevents object DDL’, 'UL','User Defined', chr(bitand(p1,-16777216)/16777215)||chr(bitand(p1, 16711680)/65535)) edes, decode(bitand(p1,65535),1,'Null',2,'Sub-Share',3,'Sub-Exlusive', 4,'Share',5,'Share/Sub-Exclusive',6,'Exclusive','Other') md, p2, p3 from v$session_wait where event = 'enqueue' SQL>@swenq Sid Enq. Enqueue Name Lock Mode ID 1 ID 2 ----- ---- ------------------------------ ---------- -------- -------- 10 TX RBS Transaction Exclusive 131072 54387 11 TX RBS Transaction Exclusive 131072 54387 14 TX RBS Transaction Exclusive 131072 54387 23 TX RBS Transaction Exclusive 131072 54387 15 TX RBS Transaction Exclusive 131072 54387 61 TX RBS Transaction Exclusive 131072 54387 57 TX RBS Transaction Exclusive 131072 54387 55 TX RBS Transaction Exclusive 131072 54387 50 TX RBS Transaction Exclusive 131072 54387 45 TX RBS Transaction Exclusive 131072 54387 44 TX RBS Transaction Exclusive 131072 54387 42 TX RBS Transaction Exclusive 131072 54387 40 TX RBS Transaction Exclusive 131072 54387 70 TX RBS Transaction Exclusive 131072 54387 66 TX RBS Transaction Exclusive 131072 54387 63 TX RBS Transaction Exclusive 131072 54387 62 TX RBS Transaction Exclusive 131072 54387 39 TX RBS Transaction Exclusive 131072 54387 37 TX RBS Transaction Exclusive 131072 54387 35 TX RBS Transaction Exclusive 131072 54387 33 TX RBS Transaction Exclusive 131072 54387 Figure 6
  • 16.
    SQL> @sw3 SessW'd So Time ID Wait Event Wait State Far (ms) W'd (ms) P1 P2 P3 ----- ---------- ---------- -------- -------- -------------- ---------- ------ 28 latch free WAITED KNO 0 8 3759327632 11 5 48 latch free WAITING 0 0 3759327632 11 6 68 latch free WAITING 0 0 3759326280 11 5 74 latch free WAITING 0 0 3759334496 11 0 75 latch free WAITING 0 0 3759337616 11 0 72 latch free WAITING 0 0 3759327632 11 7 10 enqueue WAITING 0 0 1415053318 131101 73620 33 enqueue WAITING 1 0 1415053318 262169 73576 11 enqueue WAITING 1 0 1415053318 262169 73576 40 enqueue WAITING 1 0 1415053318 262169 73576 70 enqueue WAITING 1 0 1415053318 262169 73576 61 enqueue WAITING 1 0 1415053318 262169 73576 45 enqueue WAITING 0 0 1415053318 131101 73620 15 enqueue WAITING 1 0 1415053318 262169 73576 14 buffer bus WAITING 0 0 5 8 1016 y waits 37 buffer bus WAITING 0 0 5 8 1016 y waits 42 buffer bus WAITING 0 0 5 8 1016 y waits 55 buffer bus WAITING 0 0 5 8 1016 y waits 63 buffer bus WAITING 1 0 5 8 1016 y waits 62 buffer bus WAITING 0 0 5 8 1016 y waits 66 buffer bus WAITING 1 0 5 8 1016 y waits 57 buffer bus WAITING 0 0 5 8 1016 y waits 50 buffer bus WAITING 0 0 5 8 1016 y waits 44 buffer bus WAITING 0 0 5 8 1016 y waits 39 buffer bus WAITING 0 0 5 8 1016 y waits 12 db file se WAITED SHO 2 -1 5 16 1 quential r ead 6 db file sc WAITED SHO 0 -1 5 299 4 attered re ad Figure 7
  • 17.
    -- file swdbb.sql col owner format a15 heading "Obj Owner" wrap col sname format a20 heading "Obj Name" wrap col stype format a10 heading "Obj Type" wrap col tblsp format a10 heading "TBS Name" wrap col fname format a40 heading "" select owner, segment_name sname, segment_type stype, e.tablespace_name tblsp, file_name fname from dba_extents e, dba_data_files f where e.file_id = f.file_id and e.file_id = &file_id and e.block_id <= &block_id and e.block_id + e.blocks > &block_id / SQL> @swdbb Enter value for file_id: 5 Enter value for block_id: 8 Enter value for block_id: 8 Obj Owner Obj Name Obj Type TBS Name --------------- -------------------- ---------- ---------- CSHALLAH ACCOUNT TABLE USERS /u03/oradata/fox/users01.dbf Figure 8 -- file swlatch.sql col lid format 9999 heading "Latch #" col lnm format a40 heading "Latch Name" select latch# lid, name lnm from v$latch where latch# = &latch_number / SQL> @swlatch Enter value for latch_number: 11 Latch # Latch Name ------- ---------------------------------------- 11 cache buffers chains Figure 9 $ sar -u 5 5 SunOS orapub1 5.5.1 Generic sun4u 14:53:17 %usr %sys %wio %idle 14:53:22 87 13 0 0 14:53:27 93 7 0 0 14:53:32 88 12 0 0 14:53:37 88 12 0 0 14:53:42 87 13 0 0 Average 89 11 0 0 Figure 10
  • 18.
    SQL> select sid,sql_hash_value from v$session; Sess ID SQL_HASH_VALUE ----- -------------- 1 0 2 0 3 0 4 -1.866E+09 5 2020739258 6 1724283224 7 0 8 1724283224 10 -7079893 11 -7079893 12 -489192978 13 -489192978 14 -7079893 15 -7079893 19 -598940500 22 -1.699E+09 23 -7079893 27 -598940500 28 -489192978 30 -489192978 33 -1.945E+09 35 -7079893 37 -7079893 39 -7079893 40 -7079893 42 -7079893 44 -7079893 45 -7079893 48 -7079893 50 -7079893 55 -7079893 57 -7079893 58 0 61 -7079893 62 -7079893 63 -7079893 66 -7079893 68 -598940500 70 -7079893 72 -489192978 74 -944108210 75 -598940500 76 0 SQL> @sqls2 -7079893 Database: op01 1998 Jul 08 11:21pm Report: sstmt2.sql Page 1 SQL Statement Text (Ident=-7079893) Line SQL Statement ------ ----------------------------------------------------------------- 0 UPDATE ACCOUNT SET BROKER_ID=BROKER_ID WHERE ID = '25372' Figure 11