High-Tech Sales Benchmarking Initiative
          High-Tech Sales Benchmarking Initiative
        High-Tech Sales Benchmarking Initiative
        Understanding and Optimizing Sales ROI
          Understanding and Optimizing Sales ROI
        Understanding and Optimizing Sales ROI


        Marc Metzner, Vice President     Linda Mahoney, Vice President
        mmetzner@alexandergroupinc.com   Account Manager for CA Technologies
        203.905.5584                     lmahoney@alexandergroupinc.com
                                         203.905.5582


© 2010 The Alexander Group, Inc.®            2777 Summer Street   Suite 505   Stamford, CT 06905 203.975.9344                0
                                                                                               © 2010 The Alexander Group, Inc.®
High-Tech Sales Benchmarking

 Thank you for your interest in our Software Sales Benchmarking Initiative. We are confident you will find great value
 in understanding the approaches your peers are taking to enhance sales coverage, productivity, compensation, and
 selling/support roles. While each company’s data is kept confidential, you will receive a detailed Gap Analysis of your
 data against an aggregate view of participants, including trends, benchmarks and best practices.

 This analysis will cover a range of specific sales metrics, including 20 different sales cost components, 7 support-to-
 seller ratios, 15 sales time/activity categories, key sales productivity dimensions, and compensation designs,. For
 each metric, we will compare your personnel to peer companies and determine your best opportunities to improve
 productivity and execution.

 It is our experience that your Findings Report, along with your in-person Readout Session, will contribute significantly
 to such key sales objectives as:
         1. Increasing sales productivity and growth
         2. Building activity/time allocation “success profiles” for your key selling roles
         3. Driving growth from new customers and new products
         4. Maximizing cooperation across: Field Reps, Specialists, SEs, Renewal Reps, Inside Sales, and Partner
             Managers
         5. Identifying and sharing winning coaching practices internally
         6. Understanding which sales coverage approaches are most successful in the market

 We look forward to working closely with your team on this important initiative!

 Best Regards,

 Marc Metzner
 Vice President
 The Alexander Group, Inc.®
 203-905-5584
 mmetzner@alexandergroupinc.com

                                                                                                                                               1
                                                                                                                 © 2010 The Alexander Group, Inc.®
Who Is The Alexander Group?


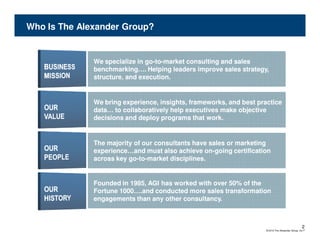
              We specialize in go-to-market consulting and sales
                               go-to-
              benchmarking…. Helping leaders improve sales strategy,
              structure, and execution.


              We bring experience, insights, frameworks, and best practice
              data… to collaboratively help executives make objective
              decisions and deploy programs that work.


              The majority of our consultants have sales or marketing
              experience…and must also achieve on-going certification
                                                 on-
              across key go-to-market disciplines.
                         go-to-


              Founded in 1985, AGI has worked with over 50% of the
              Fortune 1000….and conducted more sales transformation
              engagements than any other consultancy.


                                                                                                   2
                                                                     © 2010 The Alexander Group, Inc.®
What Services Does The Alexander Group Offer?


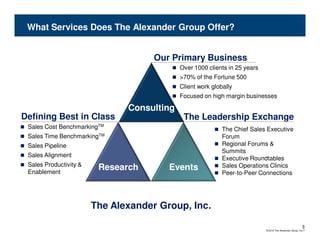
                                     Our Primary Business
                                            Over 1000 clients in 25 years
                                            >70% of the Fortune 500
                                            Client work globally
                                            Focused on high margin businesses

                               Consulting
Defining Best in Class                       The Leadership Exchange
 Sales Cost BenchmarkingTM                                  The Chief Sales Executive
 Sales Time   BenchmarkingTM                                Forum
 Sales Pipeline                                             Regional Forums &
                                                            Summits
 Sales Alignment
                                                            Executive Roundtables
 Sales Productivity &                                       Sales Operations Clinics
 Enablement
                          Research      Events
                                                            Peer-to-Peer Connections


                        The Alexander Group, Inc.

                                                                                                          3
                                                                            © 2010 The Alexander Group, Inc.®
What Is High-Tech Sales Benchmarking?

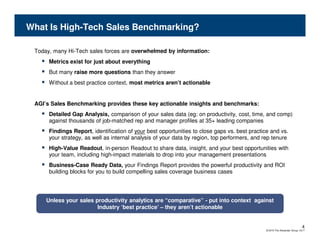
 Today, many Hi-Tech sales forces are overwhelmed by information:
      Metrics exist for just about everything
      But many raise more questions than they answer
      Without a best practice context, most metrics aren’t actionable


 AGI’s Sales Benchmarking provides these key actionable insights and benchmarks:
      Detailed Gap Analysis, comparison of your sales data (eg: on productivity, cost, time, and comp)
      against thousands of job-matched rep and manager profiles at 35+ leading companies
      Findings Report, identification of your best opportunities to close gaps vs. best practice and vs.
      your strategy, as well as internal analysis of your data by region, top performers, and rep tenure
      High-Value Readout, in-person Readout to share data, insight, and your best opportunities with
      your team, including high-impact materials to drop into your management presentations
      Business-Case Ready Data, your Findings Report provides the powerful productivity and ROI
      building blocks for you to build compelling sales coverage business cases


     Unless your sales productivity analytics are “comparative” - put into context against
                        Industry ‘best practice’ – they aren’t actionable


                                                                                                                             4
                                                                                               © 2010 The Alexander Group, Inc.®
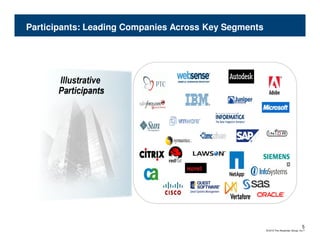
Participants: Leading Companies Across Key Segments


      Illustrative
      Participants


                                                                                    5
                                                      © 2010 The Alexander Group, Inc.®
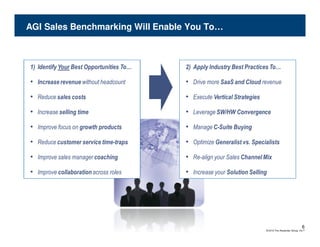
AGI Sales Benchmarking Will Enable You To…


1) Identify Your Best Opportunities To…   2) Apply Industry Best Practices To…

• Increase revenue without headcount      • Drive more SaaS and Cloud revenue
• Reduce sales costs                      • Execute Vertical Strategies
• Increase selling time                   • Leverage SW/HW Convergence
• Improve focus on growth products        • Manage C-Suite Buying
• Reduce customer service time-traps      • Optimize Generalist vs. Specialists
• Improve sales manager coaching          • Re-align your Sales Channel Mix
• Improve collaboration across roles      • Increase your Solution Selling


                                                                                                        6
                                                                          © 2010 The Alexander Group, Inc.®
AGI High-Tech Sales Benchmarking

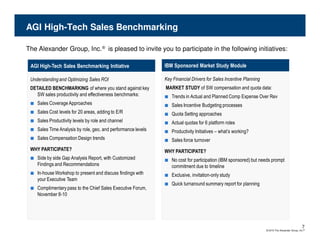
The Alexander Group, Inc.® is pleased to invite you to participate in the following initiatives:

 AGI High-Tech Sales Benchmarking Initiative                    IBM Sponsored Market Study Module

 Understanding and Optimizing Sales ROI                         Key Financial Drivers for Sales Incentive Planning
 DETAILED BENCHMARKING of where you stand against key           MARKET STUDY of SW compensation and quota data:
   SW sales productivity and effectiveness benchmarks:          ■   Trends in Actual and Planned Comp Expense Over Rev
 ■   Sales Coverage Approaches                                  ■   Sales Incentive Budgeting processes
 ■   Sales Cost levels for 20 areas, adding to E/R              ■   Quota Setting approaches
 ■   Sales Productivity levels by role and channel              ■   Actual quotas for 6 platform roles
 ■   Sales Time Analysis by role, geo, and performance levels   ■   Productivity Initiatives – what’s working?
 ■   Sales Compensation Design trends                           ■   Sales force turnover
 WHY PARTICIPATE?                                               WHY PARTICIPATE?
 ■ Side by side Gap Analysis Report, with Customized            ■ No cost for participation (IBM sponsored) but needs prompt
     Findings and Recommendations                                   commitment due to timeline
 ■ In-house Workshop to present and discuss findings with       ■ Exclusive, invitation-only study
     your Executive Team
                                                                ■ Quick turnaround summary report for planning
 ■ Complimentary pass to the Chief Sales Executive Forum,
     November 8-10


                                                                                                                                                   7
                                                                                                                     © 2010 The Alexander Group, Inc.®
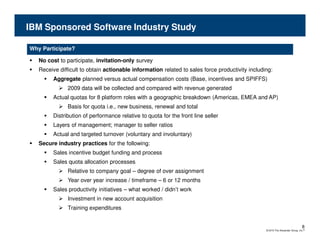
IBM Sponsored Software Industry Study

Why Participate?

   No cost to participate, invitation-only survey
   Receive difficult to obtain actionable information related to sales force productivity including:
         Aggregate planned versus actual compensation costs (Base, incentives and SPIFFS)
               2009 data will be collected and compared with revenue generated
         Actual quotas for 8 platform roles with a geographic breakdown (Americas, EMEA and AP)
               Basis for quota i.e., new business, renewal and total
         Distribution of performance relative to quota for the front line seller
         Layers of management; manager to seller ratios
         Actual and targeted turnover (voluntary and involuntary)
   Secure industry practices for the following:
         Sales incentive budget funding and process
         Sales quota allocation processes
               Relative to company goal – degree of over assignment
               Year over year increase / timeframe – 6 or 12 months
         Sales productivity initiatives – what worked / didn’t work
               Investment in new account acquisition
               Training expenditures


                                                                                                                               8
                                                                                                 © 2010 The Alexander Group, Inc.®
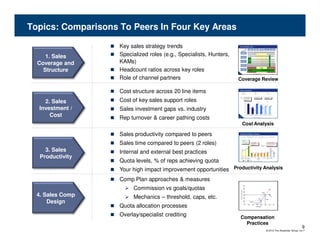
Topics: Comparisons To Peers In Four Key Areas

                    Key sales strategy trends
     1. Sales       Specialized roles (e.g., Specialists, Hunters,
  Coverage and      KAMs)
    Structure       Headcount ratios across key roles
                    Role of channel partners                         Coverage Review

                    Cost structure across 20 line items
    2. Sales        Cost of key sales support roles
  Investment /      Sales investment gaps vs. industry
      Cost          Rep turnover & career pathing costs
                                                                                                           Cost Analysis

                    Sales productivity compared to peers
                    Sales time compared to peers (2 roles)
     3. Sales       Internal and external best practices
   Productivity
                    Quota levels, % of reps achieving quota
                    Your high impact improvement opportunities Productivity Analysis
                    Comp Plan approaches & measures
                                                                                                           600%


                         Commission vs goals/quotas                                                        500%


                                                                      P ercen t of T arg et In cen ti ve
                                                                                                           400%
                                                                                                                                                               Excellence


  4. Sales Comp          Mechanics – threshold, caps, etc.
                                                                                                           300%


                                                                                                           200%
                                                                                                                                                   Target
                                                                                                                                                                                                Cap

                                                                                                                                                                            2:1 Upside


      Design                                                                                               100%
                                                                                                                            Threshold


                    Quota allocation processes
                                                                                                            0%
                                                                                                                 0%   25%           50%    75%              100%        125%             150%         175%
                                                                                                                                          Attainment of Goal


                    Overlay/specialist crediting                     Compensation
                                                                       Practices
                                                                                                                                                                                                             9
                                                                                                                                                                               © 2010 The Alexander Group, Inc.®
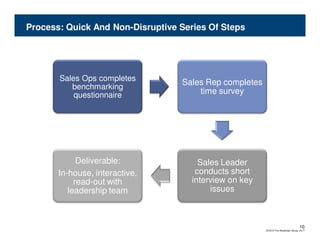
Process: Quick And Non-Disruptive Series Of Steps


       Sales Ops completes
                                  Sales Rep completes
          benchmarking
           questionnaire              time survey


             Deliverable:              Sales Leader
       In-house, interactive,         conducts short
            read-out with            interview on key
          leadership team                 issues


                                                                                    10
                                                        © 2010 The Alexander Group, Inc.®
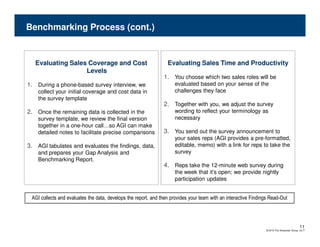
Benchmarking Process (cont.)


   Evaluating Sales Coverage and Cost                             Evaluating Sales Time and Productivity
                   Levels
                                                                1. You choose which two sales roles will be
1. During a phone-based survey interview, we                         evaluated based on your sense of the
    collect your initial coverage and cost data in                   challenges they face
    the survey template
                                                                2. Together with you, we adjust the survey
2. Once the remaining data is collected in the                       wording to reflect your terminology as
    survey template, we review the final version                     necessary
    together in a one-hour call…so AGI can make
    detailed notes to facilitate precise comparisons            3. You send out the survey announcement to
                                                                     your sales reps (AGI provides a pre-formatted,
3. AGI tabulates and evaluates the findings, data,                   editable, memo) with a link for reps to take the
    and prepares your Gap Analysis and                               survey
    Benchmarking Report.
                                                                4. Reps take the 12-minute web survey during
                                                                     the week that it’s open; we provide nightly
                                                                     participation updates


 AGI collects and evaluates the data, develops the report, and then provides your team with an interactive Findings Read-Out


                                                                                                                                             11
                                                                                                                 © 2010 The Alexander Group, Inc.®
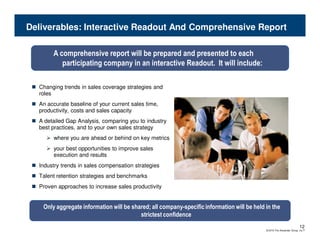
Deliverables: Interactive Readout And Comprehensive Report

       A comprehensive report will be prepared and presented to each
          participating company in an interactive Readout. It will include:

  Changing trends in sales coverage strategies and
  roles
  An accurate baseline of your current sales time,
  productivity, costs and sales capacity
  A detailed Gap Analysis, comparing you to industry
  best practices, and to your own sales strategy
       where you are ahead or behind on key metrics
       your best opportunities to improve sales
       execution and results
  Industry trends in sales compensation strategies
  Talent retention strategies and benchmarks
  Proven approaches to increase sales productivity


   Only aggregate information will be shared; all company-specific information will be held in the
                                         strictest confidence
                                                                                                                        12
                                                                                            © 2010 The Alexander Group, Inc.®
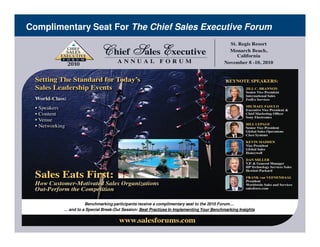
Complimentary Seat For The Chief Sales Executive Forum


                  Benchmarking participants receive a complimentary seat to the 2010 Forum…
        … and to a Special Break-Out Session: Best Practices In Implementing Your Benchmarking Insights


                                                                                                                                      13
                                                                                                          © 2010 The Alexander Group, Inc.®
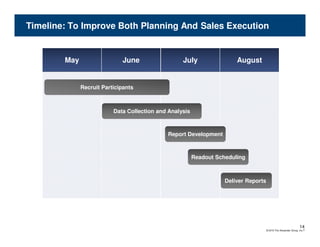
Timeline: To Improve Both Planning And Sales Execution


        May                  June                  July                 August


              Recruit Participants


                          Data Collection and Analysis


                                             Report Development


                                                         Readout Scheduling


                                                                    Deliver Reports


                                                                                                                  14
                                                                                      © 2010 The Alexander Group, Inc.®
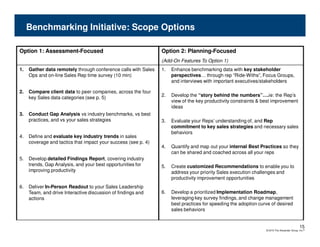
Benchmarking Initiative: Scope Options

Option 1: Assessment-Focused                                    Option 2: Planning-Focused
                                                                (Add-On Features To Option 1)
1.   Gather data remotely through conference calls with Sales   1.   Enhance benchmarking data with key stakeholder
     Ops and on-line Sales Rep time survey (10 min)                  perspectives… through rep “Ride-Withs”, Focus Groups,
                                                                     and interviews with important executives/stakeholders

2.   Compare client data to peer companies, across the four
                                                                2.   Develop the “story behind the numbers”….ie: the Rep’s
     key Sales data categories (see p. 5)
                                                                     view of the key productivity constraints & best improvement
                                                                     ideas
3.   Conduct Gap Analysis vs industry benchmarks, vs best
     practices, and vs your sales strategies                    3.   Evaluate your Reps’ understanding of, and Rep
                                                                     commitment to key sales strategies and necessary sales
                                                                     behaviors
4.   Define and evaluate key industry trends in sales
     coverage and tactics that impact your success (see p. 4)
                                                                4.   Quantify and map out your internal Best Practices so they
                                                                     can be shared and coached across all your reps
5.   Develop detailed Findings Report, covering industry
     trends, Gap Analysis, and your best opportunities for      5.   Create customized Recommendations to enable you to
     improving productivity                                          address your priority Sales execution challenges and
                                                                     productivity improvement opportunities
6.   Deliver In-Person Readout to your Sales Leadership
     Team, and drive Interactive discussion of findings and     6.   Develop a prioritized Implementation Roadmap,
     actions                                                         leveraging key survey findings, and change management
                                                                     best practices for speeding the adoption curve of desired
                                                                     sales behaviors


                                                                                                                                             15
                                                                                                                 © 2010 The Alexander Group, Inc.®
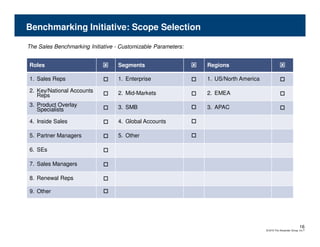
Benchmarking Initiative: Scope Selection

The Sales Benchmarking Initiative - Customizable Parameters:


Roles                             Segments                     Regions

1. Sales Reps                     1. Enterprise                1. US/North America

2. Key/National Accounts          2. Mid-Markets               2. EMEA
   Reps
3. Product Overlay                3. SMB                       3. APAC
   Specialists

4. Inside Sales                   4. Global Accounts

5. Partner Managers               5. Other

6. SEs

7. Sales Managers

8. Renewal Reps

9. Other


                                                                                                                 16
                                                                                     © 2010 The Alexander Group, Inc.®