Agro-Advisory Services In India

              Surabhi Mittal
         Agricultural Economist
 CSISA Phase II- Obj 1 Work Plan meeting
            Jan 23-15, 2013
                Kathmandu
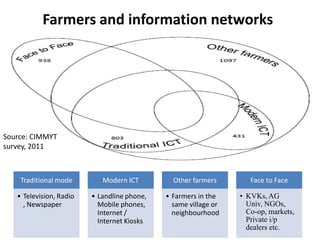
Farmers and information networks


Source: CIMMYT
survey, 2011


    Traditional mode        Modern ICT         Other farmers        Face to Face

   • Television, Radio   • Landline phone,   • Farmers in the    • KVKs, AG
     , Newspaper           Mobile phones,      same village or     Univ, NGOs,
                           Internet /          neighbourhood       Co-op, markets,
                           Internet Kiosks                         Private i/p
                                                                   dealers etc.
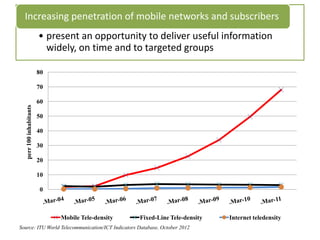
Increasing penetration of mobile networks and subscribers
                          • present an opportunity to deliver useful information
                            widely, on time and to targeted groups

                          80

                          70

                          60
   perr 100 inhabitants


                          50

                          40

                          30

                          20

                          10

                          0


                               Mobile Tele-density   Fixed-Line Tele-density   Internet teledensity
Source: ITU World Telecommunication/ICT Indicators Database, October 2012
180
160
140           Rural Teledensity     Urban Teledensity
120
100
 80
 60
 40
 20
 0


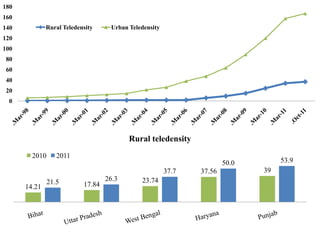
                                          Rural teledensity
        2010      2011
                                                                       50.0        53.9
                                                        37.7   37.56          39
               21.5                26.3       23.74
      14.21                17.84
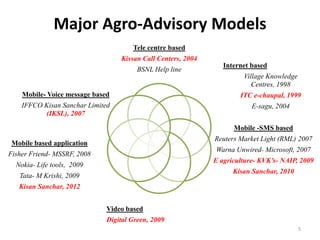
Major Agro-Advisory Models
                                      Tele centre based
                                  Kissan Call Centers, 2004
                                                                 Internet based
                                        BSNL Help line
                                                                       Village Knowledge
                                                                          Centres, 1998
    Mobile- Voice message based                                       ITC e-chaupal, 1999
    IFFCO Kisan Sanchar Limited                                           E-sagu, 2004
          (IKSL), 2007

                                                                    Mobile -SMS based
                                                              Reuters Market Light (RML) 2007
Mobile based application
                                                              Warna Unwired- Microsoft, 2007
Fisher Friend- MSSRF, 2008
                                                              E agriculture- KVK’s- NAIP, 2009
  Nokia- Life tools, 2009
                                                                    Kisan Sanchar, 2010
   Tata- M Krishi, 2009
   Kisan Sanchar, 2012


                              Video based
                              Digital Green, 2009
                                                                                           5
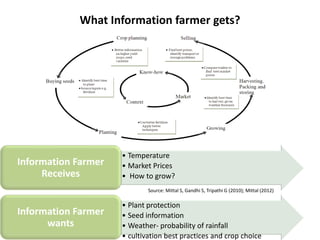
What Information farmer gets?


                     • Temperature
Information Farmer   • Market Prices
     Receives        • How to grow?
                             Source: Mittal S, Gandhi S, Tripathi G (2010); Mittal (2012)

                     • Plant protection
Information Farmer   • Seed information
      wants          • Weather- probability of rainfall
                     • cultivation best practices and crop choice
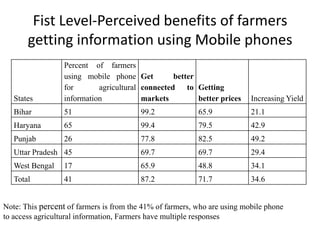
Fist Level-Perceived benefits of farmers
       getting information using Mobile phones
                  Percent of farmers
                  using mobile phone Get          better
                  for       agricultural connected to Getting
   States         information            markets         better prices    Increasing Yield
   Bihar          51                     99.2             65.9            21.1
   Haryana        65                     99.4             79.5            42.9
   Punjab         26                     77.8             82.5            49.2
   Uttar Pradesh 45                      69.7             69.7            29.4
   West Bengal    17                     65.9             48.8            34.1
   Total          41                     87.2             71.7            34.6


Note: This percent of farmers is from the 41% of farmers, who are using mobile phone
to access agricultural information, Farmers have multiple responses
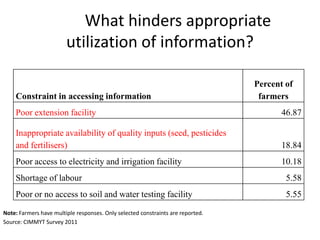
What hinders appropriate
                        utilization of information?

                                                                                 Percent of
    Constraint in accessing information                                           farmers
    Poor extension facility                                                             46.87

    Inappropriate availability of quality inputs (seed, pesticides
    and fertilisers)                                                                    18.84
    Poor access to electricity and irrigation facility                                  10.18
    Shortage of labour                                                                   5.58
    Poor or no access to soil and water testing facility                                 5.55

Note: Farmers have multiple responses. Only selected constraints are reported.
Source: CIMMYT Survey 2011
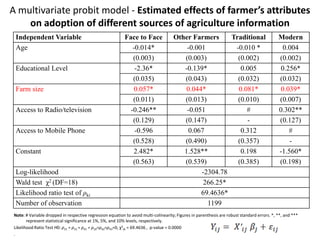
A multivariate probit model - Estimated effects of farmer’s attributes
    on adoption of different sources of agriculture information
 Independent Variable                                      Face to Face              Other Farmers     Traditional                           Modern
 Age                                                          -0.014*                    -0.001         -0.010 *                              0.004
                                                              (0.003)                   (0.003)          (0.002)                             (0.002)
 Educational Level                                             -2.36*                   -0.139*           0.005                               0.256*
                                                              (0.035)                   (0.043)          (0.032)                             (0.032)
 Farm size                                                    0.057*                     0.044*          0.081*                               0.039*
                                                              (0.011)                   (0.013)          (0.010)                             (0.007)
 Access to Radio/television                                  -0.246**                    -0.051             #                                0.302**
                                                              (0.129)                   (0.147)             -                                (0.127)
 Access to Mobile Phone                                        -0.596                    0.067            0.312                                  #
                                                              (0.528)                   (0.490)          (0.357)                                 -
 Constant                                                     2.482*                    1.528**           0.198                              -1.560*
                                                              (0.563)                   (0.539)          (0.385)                             (0.198)
 Log-likelihood                                                                               -2304.78
 Wald test χ2 (DF=18)                                                                         266.25*
 Likelihood ratio test of ρki                                                                 69.4636*
 Number of observation                                                                          1199
Note: # Variable dropped in respective regression equation to avoid multi-colinearity; Figures in parenthesis are robust standard errors. *, **, and ***
       represent statistical significance at 1%, 5%, and 10% levels, respectively.
Likelihood Ratio Test H0: ρ21 = ρ31 = ρ41 = ρ32=ρ42=ρ43=0, χ2(6 = 69.4636 , p-value = 0.0000
.
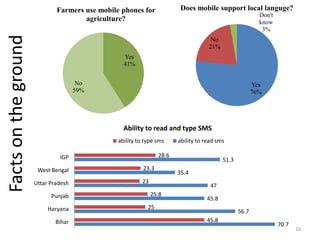
Farmers use mobile phones for              Does mobile support local languge?
                                                                                                          Don't
                                      agriculture?                                                        know
                                                                                                           3%
Facts on the ground
                                                                                     No
                                                                                    21%
                                                  Yes
                                                  41%


                                       No                                                               Yes
                                      59%                                                               76%


                                                  Ability to read and type SMS
                                                ability to type sms     ability to read sms

                               IGP                               28.6
                                                                                          51.3
                       West Bengal                        23.3
                                                                        35.4
                      Uttar Pradesh                       23
                                                                                     47
                            Punjab                             25.8
                                                                                   45.8
                           Haryana                          25
                                                                                                 56.7
                              Bihar                                                45.8
                                                                                                                  70.7
                                                                                                                         10
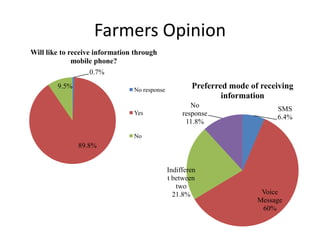
Farmers Opinion
Will like to receive information through
              mobile phone?
                    0.7%
        9.5%                    No response
                                                      Preferred mode of receiving
                                                              information
                                                      No
                                                                            SMS
                                Yes                response
                                                                            6.4%
                                                    11.8%

                                No
               89.8%


                                              Indifferen
                                              t between
                                                 two
                                                21.8%                   Voice
                                                                       Message
                                                                        60%
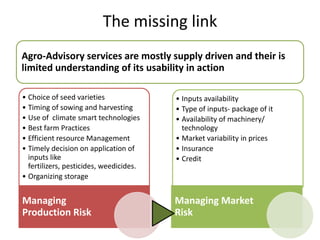
The missing link
Agro-Advisory services are mostly supply driven and their is
limited understanding of its usability in action

• Choice of seed varieties               • Inputs availability
• Timing of sowing and harvesting        • Type of inputs- package of it
• Use of climate smart technologies      • Availability of machinery/
• Best farm Practices                      technology
• Efficient resource Management          • Market variability in prices
• Timely decision on application of      • Insurance
  inputs like                            • Credit
  fertilizers, pesticides, weedicides.
• Organizing storage


Managing                                 Managing Market
Production Risk                          Risk
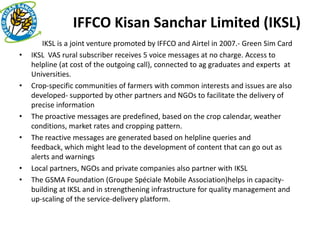
IFFCO Kisan Sanchar Limited (IKSL)
•      IKSL is a joint venture promoted by IFFCO and Airtel in 2007.- Green Sim Card
•   IKSL VAS rural subscriber receives 5 voice messages at no charge. Access to
    helpline (at cost of the outgoing call), connected to ag graduates and experts at
    Universities.
•   Crop-specific communities of farmers with common interests and issues are also
    developed- supported by other partners and NGOs to facilitate the delivery of
    precise information
•   The proactive messages are predefined, based on the crop calendar, weather
    conditions, market rates and cropping pattern.
•   The reactive messages are generated based on helpline queries and
    feedback, which might lead to the development of content that can go out as
    alerts and warnings
•   Local partners, NGOs and private companies also partner with IKSL
•   The GSMA Foundation (Groupe Spéciale Mobile Association)helps in capacity-
    building at IKSL and in strengthening infrastructure for quality management and
    up-scaling of the service-delivery platform.
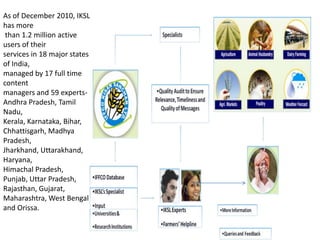
As of December 2010, IKSL
has more
 than 1.2 million active
users of their
services in 18 major states
of India,
managed by 17 full time
content
managers and 59 experts-
Andhra Pradesh, Tamil
Nadu,
Kerala, Karnataka, Bihar,
Chhattisgarh, Madhya
Pradesh,
Jharkhand, Uttarakhand,
Haryana,
Himachal Pradesh,
Punjab, Uttar Pradesh,
Rajasthan, Gujarat,
Maharashtra, West Bengal
and Orissa.
Kissan Sanchar
•   Kisan Sanchar an enterprise-class communication platform to broadcast text and
    voice messages on agricultural to individual framers through KVKs
•   Received ‘Vodaphone –Mobile for Good 2011 award’ of One million rupees
    (approx. 18 thousand USD) for up-scaling their activities.
•   Registered as a NGO’ and transiting from SMS based system to mobile-based
    inbuilt applications- tied with mobile phone manufacturers like MAX and Spice for
    having an inbuilt application in the handsets- low cost smart phones.
•   School going children of farmers are being sensitised with these information’s
    through printed information bulletin on the last two pages of school notebooks.
•   At the village level e-panchayat- is being exposed to use of internet to gather and
    distribute information-6000 farmers in 419 villages of District Kurushetra of
    Haryana, India are now linked with government extension system under this
    venture.
•   Also 150 volunteers across 110 districts in 9 states of Northern India are trained as
    information networks to improve small farmers reach ability to information related
    to climate adaptation and mitigation.
•   Database of all input providers
Partners and Users of Kissan Sanchar
• Kisan Sachar, Krishi Vigyan Kendras (KVKs), Input
  dealers, Farmers, Extension department, Village
  Panchayats, National Bank for agriculture and
  rural development (NABARD)
• Also 150 volunteers across 110 districts in 9
  states of Northern India are trained as
  information networks to improve small farmers
  reach ability to information related to climate
  adaptation and mitigation.
• Explore- Database of all input providers
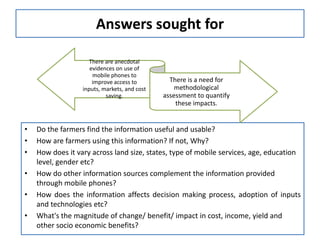
Answers sought for

                     There are anecdotal
                     evidences on use of
                      mobile phones to
                      improve access to         There is a need for
                  inputs, markets, and cost       methodological
                           saving.            assessment to quantify
                                                  these impacts.


•   Do the farmers find the information useful and usable?
•   How are farmers using this information? If not, Why?
•   How does it vary across land size, states, type of mobile services, age, education
    level, gender etc?
•   How do other information sources complement the information provided
    through mobile phones?
•   How does the information affects decision making process, adoption of inputs
    and technologies etc?
•   What's the magnitude of change/ benefit/ impact in cost, income, yield and
    other socio economic benefits?
Lessons from past
• Mobile phones and mobile enabled information services can
  act as catalyst in removing existing information asymmetry
• Bridge the gap between the availability and delivery of inputs
  and infrastructure
• Magnitude        of   economic      benefits    depends    on
  quality, timeliness and trustworthiness of the information
• Need to improve the linkages between service providers and
  service users and also need to create a feedback loop
• Telecom Regulatory Authority of India (TRAI)-
  Not to forget how policies/ regulations can
  can hinder the whole component of the
  project