Downloaded 188 times
- 1 / 60

- 2 / 60

- 3 / 60

- 4 / 60

- 5 / 60
- 6 / 60

- 7 / 60
- 8 / 60

- 9 / 60

- 10 / 60

- 11 / 60
- 12 / 60
- 13 / 60
- 14 / 60
- 15 / 60

- 16 / 60
- 17 / 60
- 18 / 60
- 19 / 60
- 20 / 60


![www.elastic.coCopyright Elastic 2015 Copying, publishing and/or distributing
without written permission is strictly prohibited
43
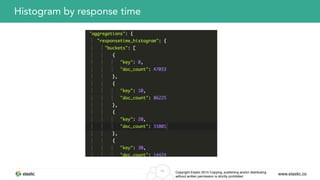
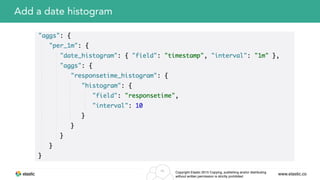
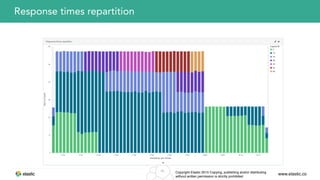
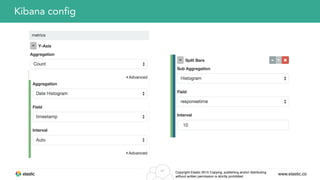
Histogram by response time
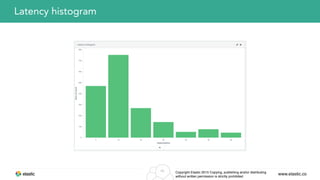
• Splits data in buckets by response time
• [0-10ms), [10ms-20ms), …](https://image.slidesharecdn.com/113packetbeatelasticsearch-150914020054-lva1-app6891/85/131-packetbeat-elasticsearch-43-320.jpg)
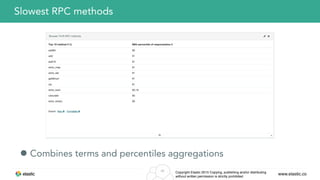
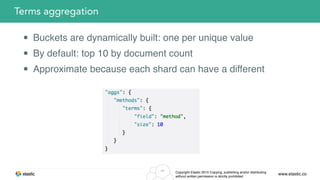
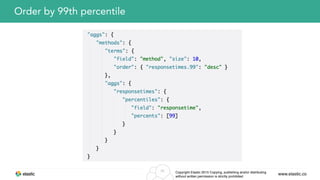
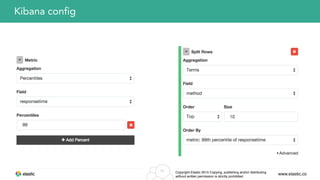

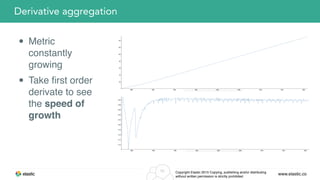
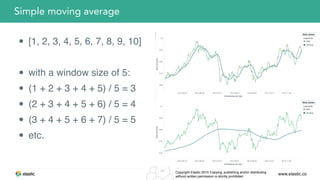
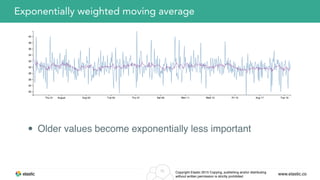
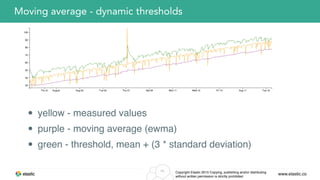
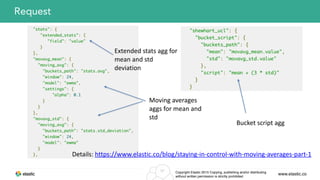
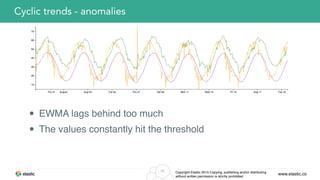
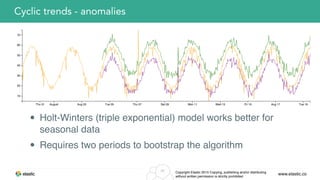


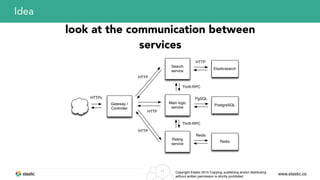
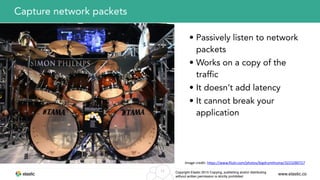
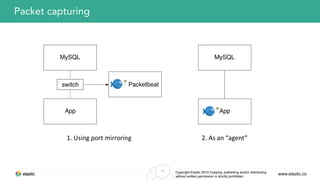
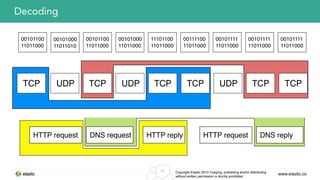
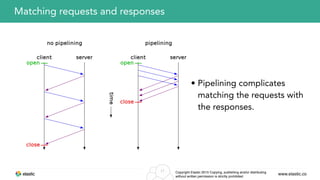
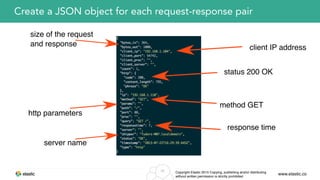
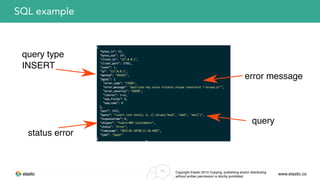
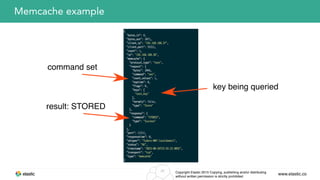
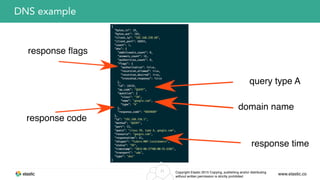
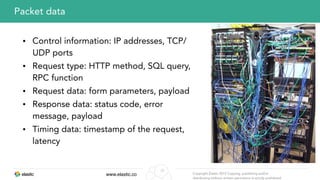
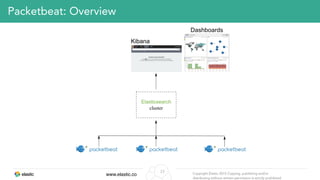
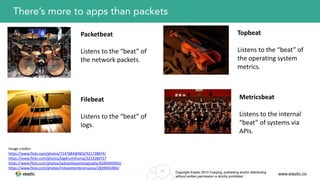
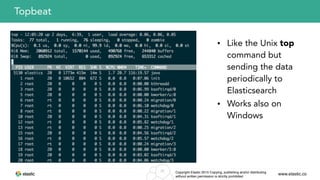
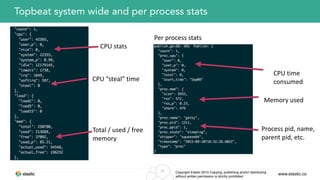
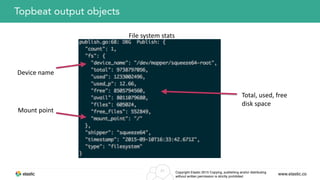
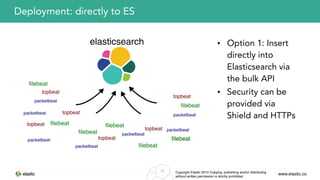
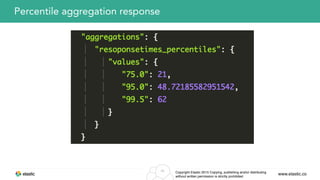
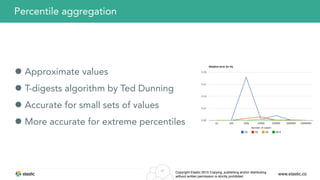
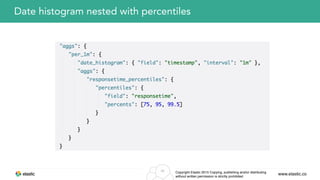
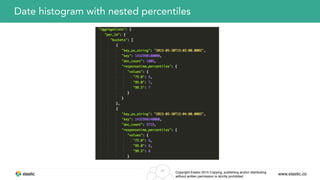
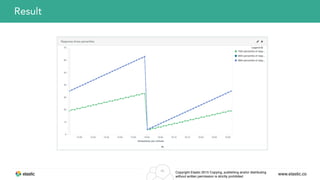
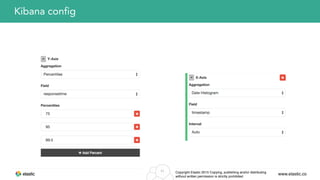
This document summarizes a presentation about Packetbeat and monitoring distributed systems. It discusses how Packetbeat passively captures network packets, decodes protocols, and matches requests and responses to create JSON objects. It then sends this data to Elasticsearch for analysis. Aggregations like histograms, percentiles, and moving averages are used to analyze latency, identify slow methods, and detect anomalies in metrics over time. Other Beats like Topbeat, Filebeat, and Metricsbeat are also briefly introduced.


