
Recommended
Recommended
More Related Content
What's hot
What's hot (20)
Viewers also liked
Viewers also liked (20)
Similar to Natural gas, a clean fuel against the constraints to its growth in europe sa hamdani
Similar to Natural gas, a clean fuel against the constraints to its growth in europe sa hamdani (20)
Recently uploaded
Recently uploaded (20)
Natural gas, a clean fuel against the constraints to its growth in europe sa hamdani
- 1. 1 Natural Gas, a clean fuel against the constraints to its growth in Europe Sid Ahmed Hamdani, 5th Algerian Gas Industry Symposium Algiers, 16 – 17 February 2016 Cadre Supérieur, Direction Stratégie, DCG SPE, Sonatrach Email : sid-ahmed.hamdani@sonatrach.dz, Tél : 021547000 Ext : 6066 Table des matières I. RECENT GAS DEMAND EVOLUTIONS IN EUROPE: SIGNIFICANT DECREASE AND QUESTIONS ABOUT FUTURE PROSPECTS............................................... 2 II. PROSPECTS OF THE EUROPEAN GAS DEMAND DETEMINANTS.............. 5 II.1 MACRO ECONOMIC DETERMINANTS ....................................................... 5 II.2 SECTORAL EVOLUTIONS ......................................................................... 6 II.2.1 Power Generation....................................................................................................................7 II.2.2 Industrial sector ....................................................................................................................12 II.2.3 Residential an Commercial sectors.......................................................................................13 II.2.4 Transport sector....................................................................................................................14 II.3 GAS PRICES AND THEIR EFFECT ON GAS DEMAND IN EUROPE ............... 15 II.3 EUROPEAN ENERGY POLICIES .............................................................. 17 III. MAIN CONSTRAINTS TO THE GROWTH OF GAS DEMAND IN EUROPE23 III.1 CONTRAINTS TO THE COMPETITIVENESS OF NATURAL GAS IN POWER GENERATION................................................................................................ 24 III.2 CONSTRAINTS RELATED TO THE DEPLOYED ENERGY POLICIES IN EUROPE 29 CONCLUSION....................................................................................................... 35
- 2. 2 I. Recent gas demand evolutions in Europe: significant decrease and questions about future prospects The evolution of natural gas demand in Europe, and particularly in the European Union, is more and more a major issue for the gas suppliers of this region. Indeed, the downward trend observed since 2010 has been confirmed in 2014. If we refer to the latest BP Statistical Review estimates, the gas consumption of the European Union has reached less than 400 Bcm in 2014, its lowest level since 2008; natural gas has lost more than 100 Bcm over this period. This decrease can be noticed in the major gas consuming countries, particularly the United Kingdom, Italy, Spain and Germany, which together account for more than 70 Bcm of the observed demand decline between 2008 and 2014. Graph 1: Gas consumption in EU 28, Bcm (Right Axis) – Main gas consuming countries, Bcm (Left Axis) SOURCE : BP STATISTICALREVIEW JUNE 2015 Despite disparities in gas demand developments between European countries, one common feature can be noticed in most of these countries, which is related to the major role of the Power Generation sector in the gas consumption decrease. The IEA estimates the gas demand decrease in power generation sector, between 2008 and 2013, at about 52 Bcm1 , more than 75% of the total decline of EU gas demand, all sectors included, over this period (see Graph. 2). Furthermore, Eurostat estimations of the gas for power decrease in the EU is about 56 Bcm2 between 2008 and 2013, compared to a total drop in gas demand, all economic sectors included, of about 64 Bcm3 . These figures confirm that the power generation which was the driver of gas demand growth in Europe since the mid-90s, has recently become a major cause of the demand decline. European industry is also concerned by lower gas demand, heavily hit by the consequences of the economic recession and by the lack of competitiveness, comparing to industries in the emerging exporting regions and also in North America, the latter region benefiting from a comparative advantage due to the lower energy prices seen after the unconventional boom. The industrial sector in the EU has then observed a 1Including plants with combined heat and power 2Including plants with combined heat and power 3 Eurostat Database (Supply, transformation, consumption - gas - annual data)
- 3. 3 dynamic of closing industrial plants and delocalization, particularly of the energy-and gas intensive industries. Graph 2: Gas demand change by sector, between 2008 and 2013, Bcm Source: IEA Statistics 2014 2008 was a pivotal year in relation to the dynamic evolution of European gas demand, in power generation and also in other economic sectors, mainly owing to the perceived effects, of the economic crisis, of the energy price increase seen in the last decade and also of the energy policies adopted by the European Union countries. In connection with the latest economic and energy policies’ developments, three main factors are often cited by the energy scene observers, as direct causes of the recent decline of the European gas demand : i) the persistence of the economic crisis and its negative effects on the demand of energy in general and natural gas in particular; ii) the high penetration of renewables in power generation, advantaged by subsidizes and priority regimes in supplying power markets and iii) the competitiveness of coal which saw its consumption increase comparing to natural gas; this highly affects gas despite its environmental advantages. In this context, what will be the future development of gas demand in Europe and in the EU in particular? Will the EU gas demand decline persist over the mid to long terms? Opinions are often very divergent on the future of natural gas in the European Union, and this may be reflected in the differences of gas demand projections, which are developed by prospective agencies and energy actors4 . We can see in the various scenarios and visions elaborated by energy actors, that gas prospects vary significantly between pessimism and optimism 4Several analyzes exist in the literature on European Gas demand scenarios. We recommend, in particular, the analysis made in the report "Outlook of gas demand in Europe" published by "Oxford Energy Institute" in June 2014. -60,00 -50,00 -40,00 -30,00 -20,00 -10,00 - 10,00 20,00 France UK Italie Espagne Portugal Allemagne Pays Bas EU Génération électrique (incluant la production combinée de chaleur et d'électricité) Industrie (incluant les autoconsommation énergétiques et la pétrochimie) Résidentiel, Commercial & Tertiaire Transport Autres
- 4. 4 In fact, some projections such as those of the European Commission 2013 Reference scenario [EC, 2013] show that the European Union gas demand has already reached a peak, before 2008, and that the future demand would not see the levels observed previously. In its annual report "World Energy Outlook", the IEA has made successive downward revisions of gas demand projections in the baseline scenario ("New Policies Scenario") between 2011 and 2014, marking a major change comparing to the optimism shown in its "Gas Gloden Age" scenario published in 2011. However, other scenarios are more optimistic for European gas demand, such as Eurogas scenarios, which claim for an important role of gas, mainly in the context of the economies’ decarbonization. Today, we can say that despite these differences in scenarios’ projections, there is a consensus on the large uncertainties and lack of visibility characterizing gas demand in Europe, as well as on the fact that gas market is experiencing major changes in this region. These developments are, in particular, manifested through significant and complex interactions between different fuels and energy sources, particularly the interaction between natural gas and renewables whose effect on the European gas demand level remains difficult to predict. In this context, two questions could be asked and which are of main concerns for the gas suppliers: What are the determinants that drive the role of gas in European energy mix? What are the constraints and barriers that prevent gas, a clean fuel, to play its full role in the decarbonization of the European economies? In order to provide elements of clarifications to these questions, we analyze through this communication, firstly, the possible evolutions of the various determinants that affect gas demand in Europe, distinguishing macro-economic factors, sectoral factors and Graph 3 : Gas demand scenarios for EU 28, Bcm Graph 4 : IEA Gas demand Scenarios in WEO Successive reports, Bcm
- 5. 5 factors related to energy policies, and secondly, the various barriers that affect gas growth despite its technical, economic and environmental advantages. II. Prospects of the European gas demand deteminants II.1 Macro economic determinants The evolution of the European Union economy, both in terms of growth and also of structure of the Gross Domestic Product (GDP), is a major determinant that drives the future energy requirements and consequently natural gas needs in this region. Figures published recently on the European economy5 , show the beginning of a gradual exit from the recession seen in Europe since 2008. This evolution raises optimism but this optimism should be considered with caution, because persistent weaknesses are still characterizing the EU economy, particularly in some countries showing modest economic performances. We can notice that various factors contribute to a positive development of the European Union economies: • First, the decline in energy prices observed recently, which brought a breath to the European economies and led to positive reviews of many EU countries’ economic growth; • Expansionary monetary policies implemented by the central banks of different countries in Europe, under the impetus of the European Central Bank (ECB), in order to stimulate growth and to support stability of domestic prices which face strong deflationary pressures in the region. Measures adopted under such policies were indeed considered as positive levers for economic growth. In this respect, we can note that the decision of the European Central Bank (ECB) to intervene in financial markets by purchases program of the financial assets available in banks ("Asset Purchases Program"), was deemed by experts as an important action, enabling to give a stimulus to the European economy through the channel of financial markets6 . • The relative low euro exchange rate which has contributed to improve the competitiveness of the European economy. • The major investment plan announced by the President of the European Commission (Junker Plan), which was also positively received as an instrument providing support to the growth of the European economy. Besides the positive determinants, major weaknesses characterize the economic growth in European countries; they are mainly related to: • The persistence of high unemployment rates, especially in countries like France and Spain; • The persistence of the deflation risk and of very low levels of nominal interest rates, which would increase the financial vulnerabilities of economies, mainly by constraining credits and investment financing activities, which are necessary for the economic recovery; 5Mainly the OECD Publication (November 2015), Publications of the European Commission and Eurostat 6This action the ECB aims to support the prices of financial assets with longer maturities, in order provide liquidity for the banking sector, and thus improve lending conditions, particularly in a context of low levels of inflation and Nominal interest rates
- 6. 6 0.000 0.020 0.040 0.060 0.080 0.100 0.120 0.140 0.160 0.180 0.00 2000000.00 4000000.00 6000000.00 8000000.00 10000000.00 12000000.00 14000000.00 2005 2006 2007 2008 2009 2010 2011 2012 2013 2014 VA Services VA Industrie (sauf construction) VA Construction VA Agriculture, sylviculture et pêche Energy intensity • The tax burden in the context of deficit reduction policies adopted by EU Countries; • Disruptions in the global economy and the crisis in emerging markets, including China, which could affect global trades and financial markets; • The migratory crisis challenges and the rise of nationalism behaviors observed in many European countries; • The unpredictable consequences of a possible exit from the EU (or Eurozone) of Greece and also the United Kingdom. Beyond the levels of growth, the European economy continues to show a significant change in the structure of GDP. Indeed, EU economy is witnessing the continuation of the dematerialization trends, and the progress of services in the added value creation (Figure below), particularly in the most developed European countries. This development is not without consequences on the energy requirements of Europe. The changing structure of European Union economies combined with energy efficiency efforts in the region have contributed to the decrease in the energy intensity of economies, as can be seen in the graph below Graph 5: EU Economic structure and energy intensity evolutions (Right Axis: Added Values by economic sector, M.Euros – Left Axis: Energy Intensity, TOE/Euro) Source: Eurostat + BP StatisticalReview 2015 The important developments indicated above could mean that even a sustained recovery in economic growth in Europe, would not translate in the levels of energy consumption growth observed in the past. This constitutes a real challenge with regards to the visibility of energy demand and also of gas demand in the region. II.2 Sectoral evolutions Demand for natural gas is largely affected by the developments and trends observed in the various economic sectors. According to IEA statistics, the residential sector remains the largest consuming sector of natural gas in Europe, with a share of 29%7 , despite a relatively stagnant demand trends observed in this sector since the early 2000s. The 7IEA statistics pour l’année 2013
- 7. 7 Power Generation sector, including combined heat and power, which has been the driver of growth before the downturn observed after 2010, represents a share of around 26%, followed by industry, whose share in the gas consumption reached 21%. However, these figures hide the significant disparities between countries, depending on the specificities of these countries and on their gas penetration policies. II.2.1 Power Generation As noted above, the Power generation sector is largely responsible of the recent drop in European gas demand, with a double effect related on one side, to the relative stagnation of electricity demand especially in the context of the economic crisis, and on the other side, to the competition of renewable and coal. In this respect, recent developments show a significant decrease in European residual demand (total electricity demand - renewable production), which has to be satisfied by the production of dispatchable sources (including thermal sources such as gas and nuclear sources). The role of gas in satisfying the European residual demand has been squeezed by the progress of renewables, particularly wind power (see Chart below) and also by the increase of generation from coal (especially between 2009 and 2013). We can see the significant decrease of Power generation from gas in EU since 2010. Graph 6: EU Power Generation by energy source (GWH) Source : ENTSOE / ENTSOG 2015 Regarding the future prospects, the power generation sector in Europe carries considerable uncertainties on the role of gas. In order to estimate the future gas for power demand, it is necessary to consider evolutions of both installed gas capacities and of their operating rates, which reflect the functioning regimes of gas power plants and affects directly their electricity production levels. Firstly, we analyze the prospects of Gas capacities’ development comparing to other power production alternatives, and the drivers of these capacities’ development, before assessing, secondly, the operating rates ("Plant Load Factors")8 of natural gas plants and the parameters affecting these operation rates 8We define operating rates by the electricity generated for the year / electricity that can be generated if the nominal capacity is operational all year
- 8. 8 A. Development prospects of gas power capacities against other alternatives It is useful to remind first, that future needs of power generation capacities in Europe are strongly driven by the prospects of electricity demand, which has recently shown signs of relative stagnation. Indeed, the future of European electricity demand remains uncertain with: • Demand Increase drivers such as the penetration of electrical use in sectors like transport or residential sectors, a penetration which is enhanced by the availability of renewable electricity, • Demand decrease drivers, especially those related to energy efficiency efforts made in Europe, and which could be further supported by the adoption of the Directive on Energy Efficiency in 2012. The development of power generation capacity in Europe has recently seen a sharp slowdown with the stagnation and uncertainty about electricity demand prospects. In this respect, the development of natural gas capacity was hardly hit and has even experienced a stagnant evolution last five years, affected by the huge recent development of renewable capacities (wind and solar), and also by the economic difficulties faced by gas plants (see Paragraph III.1 constraints on gas-fired competitiveness), which have discouraged investments in gas based capacities. Regarding future prospects, and if we refer to the baseline scenario projections of ENTSOG9 (graph 7), we can notice a decrease in gas installed capacities in 2016 compared to its 2010 level, owing to the closure of many gas power plants (the decrease is estimated at more than 7 GW), Graph 7: Prospects for PG capacities’ developments and Electricity Demand (Right Axis: Capacities, MW – Left Axis: Electricity demand, GWH) Source: ENTSOG 2015 (TYNDP Plan 2015, Annex C3 – Power Generation) However, these projections show that gas power generation capacity could regain growth momentum in the longer term, particularly after 2020, and thereby it could 9Association of European gas Transmission Systems Operators (TSOs). (TSOs). ENTSOG Projections include 25 countries of the European Union, considered in the Document "TYNDP Year Plan 2015 - Annex C3 - Power Generation". The baseline scenario is the Vision 1 of this organization, which incorporates a gradual evolution of renewable energies.,
- 9. 9 maintain a significant share of total installed power generation capacity by 2030 (the Additional gas based capacity would reach 22 GW between 2020 and 2030, against 5 GW between 2016 and 2020). Several factors are likely to explain this renewed interest in gas capacity development, such as the need to replace old coal and nuclear power plants and also the increased need, with the high renewables penetration, to have flexible "Back Up" capacity allowing the balancing of power systems, the gas based power plants are indeed well positioned to provide this “Back up”. Projections of installed gas capacities are however dependent on the prospects of alternative power generation capacities, including renewables, coal and nuclear. These prospects are conditioned by the economic profitability conditions as well as by the environmental and energy policies deployed in European countries. For renewable capacities, the baseline scenario projections of ENTSOG estimate additional renewable capacities (including hydropower) at about 160 GW between 2015 and 2030, with a dominance of wind and solar (60% of the additional capacity for wind and 26% for solar). In another Green Scenario developed by ENTSOG10, renewable capacities would reach over 380 GW between 2015 and 2030, with about 55% of additional wind capacity and 35% of solar capacity. The deployment of renewable wind and solar capacities will highly drive the future power generation capacities’ mix in Europe. These projections could be compared to recent projections of the IEA baseline scenario, estimating the additional renewable capacity in EU to about 265 GW11 between 2012 and 2030 (56% and 31% solar wind). The IEA transition scenario (Bridge Scenario)12 estimates an additional renewable capacity at about 282 GW between 2013 and 2030. Despite the differences noted, most of elaborated scenarios agree on the huge potential development of renewables, that would be stimulated by the penetration targets, announced in Europe and also by the willingness to decarbonize economies in this region, Nevertheless, and despite these optimistic renewable projections, a sharp slowdown in the pace of their development is not completely excluded (See Part II.4 relating to renewable development policies in the EU). Disparities in this development between countries would exist, with some countries seeking to catch up, regarding their relative delay in renewables development, such as France, Netherlands or even UK. For nuclear capacities, the ENTSOG organization foresees a decrease in installed capacity by about 25 GW in 2030 from its level in 201213, a decrease which will accelerate from 2020, with the decommissionning of old nuclear plants, and also with political announcements made by some European governments to exit from Nuclear or to reduce its share in their energy mix, following the Fukushima disaster. Germany remains the country showing the strongest position in this direction, with its decision to put off operation, 8 GW of nuclear capacity just after Fukushima, and to make de- commissioning 22 GW of nuclear capacity by 2022. 10This is the vision 3 ENTSOG, which considers stronger growth than Vision 1 and therefore a more rapid transition to the adoption of green energy. 11 not include the de-commissioned capacity 12Scenario elaborated in the "World Energy Outlook Special Report" published in 2015 by the IEA 13-17 GW of decrease between 2012 and 2030 according to its IEA WEO 2014 projections
- 10. 10 0 500 1000 1500 2000 2500 3000 3500 4000 4500 5000 2010 2011 2012 2013 2014 Germany Espagne Portugal However, many uncertainties remain with respect to the share of nuclear in the power capacities’ mix, and some hesitations are observed. We have even seen recently a marked renewed nuclear interest by some countries (United Kingdom for example), where the Fukushima effect seems to be strongly weakened. In addition, the objectives of reducing greenhouse gas emissions under the climate commitments of the “Paris Agreement” (ref. Agreement on Climate Change COP 21), could also help to maintain the nuclear and to slow down the pace of nuclear plants decommissioning, despite the risks of this energy source, which could significantly increase with nuclear plants’ aging. For coal fired capacities, environmental policies deployed on various EU Directives, such as the "Large Combustion Plants - LCPD Directive" and the "Industrial Emission Directive" would impose investments to comply with standards, and could lead to the decommissionning of coal plants, especially the old plants (IEA estimates coal capacity to be withdrawn at about 80 GW between 2014 and 202514). It is worth to note that more stringent environmental policies, and the possible increase in CO2 taxes or carbon prices, would raise the potential for further coal capacity reduction, and thereby could be favorable for the gas combined cycles. B. Evolution of the Gas power plants’ operating rates In addition to the prospects of installed gas based power capacities, gas for power consumption is also driven by the evolution of the gas power plants’ operating rates. These rates are directly linked to the number of operating hours of the gas power plants. Looking at the recent evolutions of the average gas power plants operating rates15in major consuming European countries (Chart 8 below); we can see a significant decrease, particularly in the Iberian Peninsula and Germany, reflecting a significant reduction in the number of operating hours of gas plants. Indeed, the number of hours of operation of gas plants in Spain and Portugal has declined from about 4000 hours on average in 2010, to less than 1600 hours in 2014. This number of hours decreased from 4000 to 2500 hours in Germany, between 2010 and 2014. Source: ENTSOG, IEA statistics 2014 14 Projections World Energy Outlook 2014 15 Operating rates are estimated for an average capacity at the beginning and end of the year, to reflect capacities’ variations that may occur during the year See [DUKES, 2015]. Graph 8 : Gas power plants’ operating rates (%) Graph 9 : Number of gas plants’ operating hours (Hours)
- 11. 11 What do explain the lower operating rates of gas power plants between 2010 and 2014? Gas power plants were in fact disadvantaged by, a lower competitiveness compared to coal and nuclear for the "Baseload regime", and also, by the large use of renewable energy benefiting from subsidies and privileged regimes in the supply of electricity. Therefore, Gas power plants operate mostly in "Intermediate load" or "Peak load", to meet residual demand for electricity; the latter is furthermore weakened by the growth of renewable and also by the stagnation of the European electricity demand. Moreover, even for intermediate and Peakload regimes, gas plants are in competition with coal plants, which have the advantage of low prices for fuel and CO2. We can see in the chart below, for the German case, the Power capacities in operation, by source of energy, during September 2015. This chart highlights the high variability of the gas fired and hard coal fired capacities in operation, which reflects that both hard coal and gas power plants are functioning in intermediate and Peak load regimes, to respond to the fluctuations of electrical load curves and to the intermittency of renewables. Graph 10: Operational Power Capacities by source in Germany, MW Source: Franhaufer institute It is in this context that the gas power plants, most often designed to operate more than 4,000 hours, are functioning during much less time in many European countries. This has led to a real revenue problem for the gas-power plants owners, especially gas combined cycle owners. Consequently, many gas power plants have been put in standby or even decommissioned. Nevertheless, it is worth noting that an important factor would encourage operators to maintain or to develop gas based capacities, even if they anticipate a reduced operation rates; This factor is related to the fact that gas plants have emerged as a flexible response to the significant needs of power systems Balancing16 .The gas plants could indeed ensure the “Back Up” for Renewable Energy, because of their technical and economic advantages and also because of existing synergies between gas and 16These balancing needs are caused by the high penetration of renewables and thereby by the resulting fluctuations in the supply of electricity
- 12. 12 renewables. However, the number of operating hours for the gas “Back Up” Capacities remains a major challenge, since it will drive their profitability and economic viability. In order to encourage operators to keep or invest in “Back Up” capacities, including flexible gas capacities, one option discussed by the EU in its proposal of European electricity sector reforms, is to consider a capacity payment mechanism17 . While this option would be favorable to gas capacities, it does not necessarily lead to increase significantly gas power plants’ operating rates and thus the consumption of gas of these plants In this context, what are the prospects of gas power plants’ operating rates and of their functioning regimes in Europe? Operating rates are indeed driven by a number of factors, including economic factors or factors related to energy policies deployed in Europe [IGU PGC C, 2015]: Economic factors affecting gas power plants’ operating rates: i) Electricity prices’ prospects in relation to the evolution of the European electricity markets’ configurations (Regulation Vs. liberalization); ii) Evolution of the Relative prices of fuels (gas, coal) and of renewable energy, as well as the degree of integration of environmental externalities into these prices; iii) Electricity demand prospects; iv) Evolution of the available flexible options to meet the needs of electrical systems’ balancing18 , which could challenge the advantage of gas in its role as Renewable Energy “Back Up”; v) Technology developments that may affect technical and economic operating conditions of different types of power plants. Energy policy Factors affecting gas power plants’ operating rates: i) Policies and measures regarding nuclear energy; ii) Renewable support regimes and alternative energy subsidies (including coal and renewables); iii) Carbon markets’ reforms and environmental protection measures; iv) Electricity reforms and the likely integration of capacity payment mechanisms to encourage “Back Up” capacities. II.2.2 Industrial sector Over the last decade, the European industrial sector has faced a lot of difficulties, mainly related to the economic crisis and its lack of competitiveness, accentuated by high energy prices. This has led to important developments and adaptations in this sector, particularly in the European industrialized countries where we have seen: i) significant 17 Some European markets has yet considered a form of remuneration for the capacity Back Up capacities’ remuneration, such as Spain and Ireland (see Timera Energy, Power capacity payments are coming across Europe, March 2015) 18 Many balancing alternatives exist such as: Demand electricity management, storage, or development of flexible power generation technology, Power interconnections and inter countries trades of electricity
- 13. 13 reduction in the share of heavy and high energy consuming industries; ii) plant closures and delocalization realized by major industry players in order to improve their competitiveness, and iii) significant effort made to reduce the energy intensity of industries. Energy demand of the industrial sector was driven by three main determinants including: i) evolution of industrial activities (or industrial added values), ii) changes in the structure of industry and iii) changes in industrial energy intensity [Enerdata, 2015]. With respect to these determinants, Europe has seen: a moderate growth of its industrial activity, trends to the economy dematerialization and greater penetration of service sector, as well as significant efforts made to improve energy efficiency of industries. In this context, industrial energy demand and particularly industrial gas demand projections, developed by the different prospective organizations, often show moderate or downward trends for industrial sector gas demand in Europe. The IEA projections estimate a decrease of gas demand in the industrial sector, between 5 and 8% in 2020 compared to its 2012 level (about 107 Bcm decrease) and between 20 and 30% in 2040. These forecasts show that the industrial sector is not a vector of growth of natural gas in Europe, and especially in the traditionally industrialized countries in the region. It is worth to note that the first industrial gas consuming sector in Europe, which is the chemicals and petrochemicals sector (over 20% of the industry's gas demand), is severely hit by the competition of regions benefiting from low hydrocarbon prices (Middle East and also the United States with the development of shale gas). Another trend observed in the industrial sector in Europe is the development of decentralized electricity generation, particularly renewable based electricity. This development could have a double negative effect on gas demand: it encourages substitutions of gas by electricity in industry sector and also would affect the electricity demand from gas based power plants. [A. Honoré, 2014]. II.2.3 Residential an Commercial sectors Gas demand in commercial and residential buildings is mainly driven by heating needs of space and water. This makes gas demand strongly dependent on the climatic conditions in Europe. In this regard, a cold wave, such as that observed in the winter 2012 - 2013, has a direct and strong effect on European gas demand. The outlook for European gas demand in the residential and commercial sectors remain modest. IEA estimates in its WEO 2014, an average annual growth of these 2 sectors at around 0.7% between 2012 and 2035. This growth is mainly driven by the substitutions’ possibilities of coal and fuel and by further expansion of gas in the European southern and eastern countries. However, many other factors could limit this potential growth such as: • The energy efficiency measures in buildings, which allow to improve the insulation levels and thus reduce the energy demand for heating. • The development of electricity use in residential and commercial buildings, particularly with the increase of the decentralized produced electricity (auto production), mainly driven by the penetration of solar Photovoltaic in many European countries (Expansion of PV panels installation at the roofs of houses).
- 14. 14 II.2.4 Transport sector Transport sector displays an interesting growth potential of gas demand in Europe, although this will require an effort from different actors and stakeholders in the sector, in order to reduce economic, technical and regulatory barriers to its development. The main factors determining the penetration of natural gas in transportation sector could be related to: i) Development of infrastructure and fueling stations to supply gas supply, ii) Development of gas fueled vehicles with acceptable costs, iii) Establishment of regulatory mechanisms and incentives to support both the cost of gas based transportation means and the development of gas distribution chains, iv) Establishment of environmental standards encouraging the use of cleaner transportation fuels. Two main transportation segments which consume gas in Europe could be distinguished: Road transport segment and Maritime transport segment: • According to NGVA statistics, gas consumption of road vehicles is estimated at around 3.2 Bcm in 2014; this consumption is dominated by the light vehicles representing about 75% of the gas volume consumed. Italy is the first consumer of gas in road transport with a fleet of vehicles running on gas estimated 880,000 vehicles, followed by Poland and Germany. These three countries represent around 80% of gas demand for road transport in the EU. • For the sea transport, natural gas is mainly consumed by LNG tankers with an estimated consumption in 2013 according Poten at about 12 Mt of LNG (equivalent to around 7 Bcm) [C. The Fevre, 2014]. European energy policy has set up a number of instruments aiming to reduce greenhouse gas emissions; some of these instruments are related to the transport sector19, including mainly the directive on clean fuels (Fuel Quality Directive), adopted in 2013, which established norms and standards for transportation fuels. These standards would help to promote natural gas in the transport sector. Another important lever that could significantly encourage natural gas in transport is related to the adoption by the International Maritime Organization of the Convention on the Prevention of Maritime Pollution (MARPOL). This agreement established standards and pollutants emission norms (Ex: Sulfur oxide, Nitrogen Oxides), especially in Specific Emissions Control Areas (SECAs), which include some important European maritime transport routes (such as the Baltic Sea and the North Sea). This agreement would be an important driver for the development of gas in the maritime transport, and we can notice in this regard, the observed expansion of LNG supply infrastructures, especially in Northern Europe, serving some important SECAs in the region. Despite the existing instruments that can drive the growth of gas in transportation sector, the supports of governments still remain of paramount importance. Many uncertainties and barriers do exist to the development of gas in transport sector, particularly with regards to the evolutions of oil and natural gas relative prices. 19 Transport sector continues to display increasing CO2 emission trends and also delays in emission mitigation efforts comparing to other sectors in Europe ,
- 15. 15 II.3 Gas prices and their effect on gas demand in Europe The relationship between price and demand of energy is a complex relationship, with retroactive dynamics reflecting the fact that prices of one source of energy are both drivers and driven by the demand on this source of energy and also by the demand on other competing sources. For natural gas, this relationship is even more complex since that natural gas face strong competition from other sources in all kinds of its usages20 , making the prices of competing energy sources as important determinants for gas demand. In addition, the relationship between gas prices and gas demand is highly variable, depending on sectors and countries: • For sectors, electricity generation would offer greater responsiveness (or in other words, greater elasticity of demand to price) with the existing flexibility and the substitutions’ possibilities between energy sources in his sector. However, the high penetration of renewables in Europe and the privileged regime in supplying renewable electricity to markets, could alter significantly the assessment that we can have of the gas demand reaction (elasticity) to its prices in this region. Indeed, some signals show that in some European countries, with high renewables penetration, gas demand would respond more to climatic variations and to “Back up” requirements affecting the generation of renewable electricity, than to the price of gas as a fuel. • On another side, the configuration of energy mix, the gas market structure and the energy policies applied in different countries, have also impact on the reaction of gas demand to gas prices. We can note in this regards, that there is a gap, often important, between the gas wholesale prices and end use prices applied to final consumers. This gap often reflects the use of energy policy levers such as taxes, where a decrease in wholesale prices is not systematically passed on to the final prices (see paragraph on the barriers to the consumption of natural gas) The graphs below show the reaction of the gas demand to the gas wholesale price indexes, in Germany and the United Kingdom. Gas demand is expressed in variation of consumption of the month compared to the same month of previous year, in order to neutralize the effects of seasonality. 20 This is a major characteristic of natural gas, which make the visibility on its demand and price stabilities as important derivers for gas suppliers, investing in capital intensive supply chains
- 16. 16 Graph 11: Germany: Gas import FSO index, $/mmbtu (Right Axis) Vs. Change in monthly consumption Month /Month of previous year, Bcm (Left Axis) Source : Eurostat, FSO Allemagne We can see that, for Germany, the wholesale prices’ decrease observed in 2013 had not led to significant response of the German gas demand. Indeed, significant reductions have occurred in monthly demand levels in 2014 compared to the same month of 2013 and even in 201521 compared to the same month of 2014. Source: Eurostat, OFGEM 21This is despite the expectation of a catch-up effect after the significant decrease in 2014 Graphique 12 : UK : NBP Day ahead ($/mmbtu) (Right Axis) Vs. Change in monthly consumption Month /Month of previous year, Bcm (Left Axis) Graphique 13 : UK : UK : NBP Day ahead ($/mmbtu) (Right Axis) Vs. Change in monthly PG consumption Month /Month of previous year, Bcm (Left Axis)
- 17. 17 For UK, the NBP prices have observed more fluctuations compared to German wholesale price index. We can see some responsiveness of gas demand to prices, with often observed monthly demand increase after a reduction in NBP prices. As seen in chart above, Power Generation sector is the sector which responds most to the NBP price dynamics. However, we can observe a downward gas demand trend for the winter months, between 2012 and 2015, reflecting a mild climate and thus less need for heating in UK. II.3 European Energy policies Energy policies deployed in different EU countries, affect significantly their natural gas demand, since these policies usually define mechanisms and instruments which could mainly affect: i) the configuration and functioning of energy and gas markets; ii) the energy prices and competition between different sources of energy and iii) energy mix on the medium and long terms as well as the place of gas in this energy mix. Energy policies are then important determinants of natural gas demand, Notwithstanding the fact that differences can be noted in the policies and measures adopted at countries’ levels, marking specificities and national choices in each European country, The European Union Energy Policy has been designed as a reference framework which engage EU member states and whose principles and directives are to be adopted and implemented on the national level. . We analyze in following paragraphs, this European energy policy, highlighting its main objectives, instruments and the progress made by EU with regards to the defined objectives. Our analysis aims to provide some elements of assessment of the European energy policy effect on gas demand. The European Union energy policy whose the "Green Paper" published in 2006 [EC, 2006] had defined its three main strategic axes (Economic Competitiveness, Environmental Sustainability and Security of Supply), was materialized by the establishment of many levers and instruments in line with the strategic axes and objectives. Two important levers can be distinguished and analyzed in the following: The establishment of an European integrated and competitive energy market; The protection of environment and climate change mitigation, through decarbonization of the European economies and improvement of energy efficiency. => The establishment of an integrated and competitive European energy market has been one of the major levers of European energy policy. The vision promoted in this context by the European Union, is that liberalization and development of an integrated and competitive market allow to improve the efficiency in energy market functioning, to ensure security of supply and also to improve the competitiveness of European Union economy. The process of European gas markets liberalization and reforms has been particularly marked by the adoption of three regulatory packages, which have established the principles and modalities of implementation of these reforms. The last package "Third energy package" was adopted in 2009, after the first and second directives respectively adopted in 1998 and 2003.
- 18. 18 Basing on the frameworks and instruments defined in the various European directives, the European Commission notified in February 2015 [EC, 2015], a new strategy that aims to create an EU Energy Union. This new strategy has as main principle the strengthening of coordination between EU Member states and integration of European energy markets, in order to improve competitiveness, security of energy supply, and also to reduce CO2 emissions. The security of supply issue is at the heart of this strategy, particularly in a context marked by an increasing willingness to reduce EU dependence on Russian gas supply after the Ukrainian crisis. We can note that the recent EU strategy proposal supports the approach of establishment of a liberalized and integrated energy market started 15 years ago, thus confirming continuity with market liberalization vision promoted by the EU. However, it recognizes the difficulties in full implementation of European legislation and third energy package in particular22 . Many energy analysts and observers noticed the failures and dysfunctioning of European energy markets, resulting particularly from the predominance of national choices and by a fragmented energy markets in Europe. The effect of European liberalization policies on gas demand remains difficult to appreciate, but it is possible to note that these policies have led to high uncertainty, both on gas markets configuration, gas pricing mechanisms and on the level of gas prices. However, many concerns are expressed by gas producers in relation to this liberalization policies, and particularly those relating to pressures on traditional mechanisms based on long term indexed contracts, which have allowed in the past the significant growth and development of gas industry (see part III.2 constraints on gas demand growth related to European energy policies). => Environment protection and sustainability, through the decarbonization of the European economies and improving energy efficiency, are considered as important pillar of the European energy policy. The EU concern of environment protection and sustainability is clearly displayed in the ambitious targets set, and in measures identified in the various frameworks of the European energy policy, either the policy developed at the 2020 horizon (20-20-20 targets) 23 or in policies and visions developed for longer terms. These latter includes the 2030 Vision highlighted in the ("2030 Framework for Climate and Energy Policies"24 or the 2050 vision, highlighted in the 2050 Energy policy Roadmap [EC, 2011]. In addition, the recent Energy Union Strategy proposal confirms the commitment of European Union to decarbonize its economy and to improve energy efficiency25 . The pursuit of the EU energy policy objectives would have a significant effect on gas demand and on the penetration of this fuel in different economic sectors. In what follows, we give some elements of assessment of the impact of the policies and 22 The EC Communication indicates that full implementation and strict enforcement of existing EU legislation is a priority for the Energy Union strategy proposal. 23 20% reduction in greenhouse gas emissions compared to 1990 levels, 20% share of renewables in the energy mix, 20% energy saving compared to projections of the baseline scenario.. 24The vision developed in this report served as a basis for defining the committing framework presented ate the Conference of Parties on Climate Change in Paris (COP21), in Dec. 2015.. 25This strategy comprises five strategic areas that shape the priorities and levers envisaged by the Energy Union namely: i) energy security, solidarity and trust; ii) the integration of the European energy market; iii) energy efficiency; iv) decarbonizing economies (Ref: [ME, 2015 (2)]
- 19. 19 measures adopted, in relation with the 3 objectives for 2020 (20% reduction of greenhouse gas emissions over 1990, 20% share of renewables in the energy mix, 20% energy saving compared to a reference scenario). Note that periodic assessments are published by the European Commission on the progress made in achieving the 2020 objectives: • Reduction of greenhouse gas emissions: Two main mechanisms have been put in place by the EU in order to reduce the greenhouse gas emissions, namely the carbon market (EU Emission Trading System) which involve large CO2 emitting sectors, and ESD mechanism ("Effort Sharing Decision") setting emission targets for sectors not covered by the EU ETS. The last assessment of EU CO2 emissions made by the Commission [EEA, 2015] showed a significant reduction in these CO2 emissions (about 21% decrease compared to 1990 levels) and also gave positive signals that EU is on track to achieve the CO2 reduction objective set for 2020, both in the sectors covered by the EU ETS and by ESD26 . However, the decomposition of CO2 emissions dynamic between 2005 and 2012 according to its main determinants (namely economic growth, technology, change and economic structure) [EC, 2015 (2)] shows that the drop in CO2 emissions was particularly due to: i) the effect of technological change, with mainly the high penetration of renewables and ii) the economic downturn in in the context of crisis. The economic activity growth observed after 2009 has in fact led to an increase of CO2, emissions, contributing to attenuate the observed downward trend (see graph below). Graphe 14 : EU CO2 emissions decrease by main determinants factors ( %) Source : Rapport d’évaluation de la Commission européenne [EC, 2015(2)] On another side, the development of renewable energies largely supported by subsidies, allowed somewhere, to compensate the increase of emissions owing to more use of coal observed in several EU countries. 26ESD, "The Effort Sharing Decision" establishes engaging greenhouse gas emissions’ targets of for the period 2013-2020. These emissions relates to sectors not included in the ETS, such as transport.
- 20. 20 We can say in this regards, that the relatively low levels of CO2 prices on the European carbon markets, were not a sufficient incentivizing factor to reduce consumption of polluting energy sources such as coal. So, Europe decarbonization was largely driven by the penetration of renewables, which has induced significant costs on the energy supply. The persistence of low CO2 prices has largely favored the use of coal over natural gas. The current dysfunctioning of European carbon market is, therefore, a major constraint preventing natural gas to fully play its role in reducing emissions and in ensuring competitive decarbonization of the European economies. Energy efficiency improvement: The 2014 European Commission assessment on the progress made with regards to the energy efficiency improvement [EC 2014], showed difficulties for EU to reach the 2020 set target (20% reduction of energy consumption compared to the baseline scenario considered)27 . This evaluation also showed that the decrease in energy consumption observed recently, has been linked to the decrease of final energy consumption of economic sectors. Additionally, The EC evaluation highlighted that the EU economic activity recession has contributed significantly to this reduction in energy consumption, although progress has been made in terms of energy efficiency, particularly in the residential and transportation sectors. The decomposition of the European final energy consumption decrease, between 2008 and 2012, according to the main determinants (ie economic activity, structure of energy consumption and modal substitutions, human behaviors, climatic factors, and improving energy efficiency), shows that the economic activity recession has resulted in more than 30 Mtoe of energy consumption reduction, against 50 Mtoe for the actual energy efficiency effort. Graphique 14 : EU Final energy consumption decrease by main determinants factors, MTOE Source : [EC, 2014] (Part 2/3) 27 Reference scenario developed by the European Commission in 2007
- 21. 21 Following this assessment in 2014, the European Commission has recommended a strengthening of energy savings efforts, by accelerating the implementation of measures and standards identified in different directives dealing with energy efficiency (notably Energy Efficiency Directive (EED), Energy Performance of Buildings Directive (EPBD) 28 . As for the impact of energy efficiency on natural gas demand, improving energy efficiency would reduce energy consumption in general and gas consumption in particular. However, gas based appliances and equipments are well positioned to play a role as part of the energy efficiency improvement effort, given their good energy performance. In addition, CO2 prices could also be an important lever for improving energy efficiency, by favoring less energy and CO2 intensive processes and technologies, including gas based technologies. • Renewables penetration: The European Commission evaluation report on the renewables’ deployment progress in the EU, published in 2015 [EC, 2015 (4)], showed a significant development of renewable energy, with a share in energy consumed increasing from about 8% in 2005 to 15% in 2013. The estimate for 2014 is about 15.3%. However, it is worth to note that this increase in the share of renewable must be mitigated by the observed decrease in energy consumption in many European countries. Indeed, an energy consumption decrease tends to overestimate the rising share of renewables, comparing to the real progression of the energy consumed from renewable sources. Nevertheless, renewable energy has risen sharply in recent years in Europe, despite disparities in the pace of growth between countries and also between economic sectors: Source : [EC, 2015(5)] 28A recent report (November 2015) showed that energy efficiency efforts have been strengthened in several countries since 2014 and that these efforts put the EU on track to achieving its target of 20% energy savings (Ref: [EC, 2015 (3)]) Graph 15 : Renewable shares in EU countries (2005 Vs. 2013) Graph 16 : Renewable shares by sector (2005 Vs. 2013)
- 22. 22 For the renewable penetration by country, it should be noted that some European countries have more than doubled the renewable share since 2005, such as Italy, Spain, Denmark and also Germany. In these countries, Renewables are near to, or exceeds 15% of the energy consumed. Other countries remain at relatively low levels, around 5% on average such as UK, Netherlands and some countries in Eastern Europe. The Scandinavian countries have reached the highest renewable penetration levels, which is mainly related to hydropower energy, widely available and used in these countries. For the renewable penetration by sectors, electricity generation has seen the largest renewables’ penetration, with the increase in wind and solar. This is also the sector where the deployment of renewable is easier comparing to other sectors like transportation sector. The latter has observed a much more moderate penetration of renewables and the target set by the EU (10% renewables in transport by 2020) would be very difficult to achieve according to assessment made by the European Commission. The future development of renewables in the European Union remains uncertain, and a sharp slowdown in its progress can not to be excluded. Many constraints may indeed hinder this progression, which are mainly related to : i) The potential reduction of governments’ supports and subsidies to renewables, driven by budget constraints and the high costs induced on electrical systems. Indeed, some perturbations are observed in the functioning of government support mechanisms, and we have even seen a freeze of subsidies in countries like Spain, strongly affected by the economic crisis; ii) the European Commission recommendations to reduce subsidies for renewable energy, particularly for the renewable mature technologies, because of the large dysfunctioning observed in the electricity market [EC, 2014 (2)] 29 iii) Maturation of the renewable potential in some countries and increasing complexity for the deployment of renewable options; iii) the persistence of administrative barriers hampering investments in renewable energy projects; and iii) in some cases the population resistance regarding the implementation and deployment of renewable related infrastructure. The high penetration of renewable energies observed in Europe has had a significant negative impact on natural gas consumption, particularly in power generation, where renewable electricity has contributed to decrease gas power plants’ operating rates In the future, the continuity of this renewable penetration dynamic could significantly affect natural gas, although the interaction between renewable energy and gas remains difficult to appreciate. Indeed, renewables could encourage the development of natural gas power capacities, particularly to ensure “back up”, but introduce large uncertainties on the operating rates of the gas power plants. 29The European Commission Report ("the State Aid Guidelines", between 2014-2020), recommended the reduction of renewables’ subsidies to reduce the costs of environmental policies and the additional costs induced on the power supply..
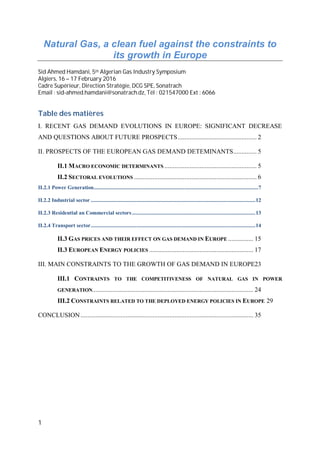
- 23. 23 III. Main constraints to the growth of gas demand in Europe Natural gas has undeniable environmental qualities. It is the cleanest fossil fuel, emitting less CO2 than coal and oil in most energy usages. This is due to a Carbon content (CO2 emission factor per unit of heat produced during combustion) much lower than the other fossil fuels and also to very interesting energy performances, either for the production of electricity, production of heat or in other uses such as gas based engines; In power generation sector, CO2 emissions per kWh produced in OECD countries, according to IEA estimates, averaged to 400 g CO2 / kWh produced, less than half the average emissions of coal based power plants and less than 40% the average emissions of fuel oil used in the production of electricity. Source : CO2 EMISSIONS FROM FUEL COMBUSTION, IEA STATISTICS HIGHLIGHTS, Ed. 2015 Natural gas also emits lower air pollutants such as NOx, dust or Methane, a potent greenhouse gas (Table below). Coal Petroleum Natural Gas Wood Methane NitrousOxi de Methane NitrousOxi de Methane NitrousOxi de Methane NitrousOx ide SECTORS (g /MMBtu) (g/MMBtu) (g /MMBtu) (g/MMBtu) (g /MMBtu) (g/MMBtu) (g /MMBtu) (g/MMBt u) Residential 301 1.5 10 0.6 5 0.1 253 3.2 Commercial 10 1.5 10 0.6 5 0.1 253 3.2 Industry 10 1.5 3 0.6 1 0.1 25 3.2 Electricity Generation 1 1.5 3 0.6 1 0.1 25 3.2 Source : Energy Information Administration statistics Despite the technical, economic and environmental benefits of gas, this source of energy undergoes a number of barriers and constraints impeding its growth in Europe. Two categories of constraints are identified in this regards: i) constraints on the competitiveness of gas, particularly in power generation and ii) the constraints related to energy policies. Graphique 17 : Carbon Content by fossil fuel (Kg/G. Joule) Graphique 18 : Power Genration CO2 emissions by fossil fuel (Gr. CO2/Kwh)
- 24. 24 III.1 Contraints to the competitiveness of natural gas in power generation It is often cited by some observers and actors of the energy scene, that the loss of competitiveness of gas-fired power plants in the European market, is linked to the high gas price levels, which have been observed during the last decade. Many actors said also that gas prices do not reflect the market value of this fuel in Europe. These arguments, taken in absolute terms are, in our view, a fundamental mistake that ignores important aspects related to the observed dysfunctioning of European electricity markets, whose main symptoms are cited below: • Significant drop in electricity wholesale reference prices, which led to a significant reduction of margins of the non-subsidized thermal power plants’, particularly gas power plants; • Competition of a polluting fuel, namely coal with the low CO2 prices’ levels which does not sufficiently reflect the coal environmental impact; • Significant drop in operating rates of natural gas power plants, owing to the competition of subsidized renewable electricity and coal, leading to lower gas power plants revenues. Many of these gas power plants have been mothballed or even decommissioned; • Disconnection between high electricity prices applied to end users and wholesale electricity prices, which are defined on the liberalized power markets and are affected by the application of subsidies and specific regimes to alternative source of power, especially renewables, A thorough analysis of gas power plants’ competitiveness and of European electricity markets functioning allow to learn two main lessons: Lesson 1: natural gas power plants remain an important source of competitiveness for electricity supply on the medium to long term, but this competitiveness is strongly affected by the observed decrease in operating rates: The cost evaluations’ methods, usually used to assess the competitiveness of different power generation technologies, are based on "levelised costs", which represent the discounted average cost of these technologies over the period of their economic exploitation. These costs can be considered as long-term competitiveness indicators, including the annualized capital costs, operating costs, fuel costs for thermal power plants; they often take into account the CO2 prices defined on the carbon markets to incorporate environmental externalities. If we refer to a recent report elaborated under the auspices of the European Commission30 , estimating the “levelised costs” for power generation technologies (Ecofys 2014], we can note two differentiated cost estimations: i) a first estimate based on a nominal power plants’ operating rates (Technically feasible full load hours) 31 and ii) another estimate based on the 2012 average operating rate, which has observed a significant decrease for natural gas plants. It should be noted, moreover, that the costs’ estimated in this report did not include CO2 prices32 , which would significantly affect the relative competitiveness of various power plants technologies if these external costs are properly reflected. 30 [Ecofys 2014]: "Subsidies and Costs of EU energy", Report prepared for the European Commission in October 2014 31 Number of hours of nominal functioning realized by a power generation technology taking into account the maintenance shutdowns 32 CO2 prices are considered as external costs and estimated separately (not included in levelised costs)
- 25. 25 0 50 100 150 200 250 Technically Feasible Full load hours Realised full load hours (2012 average) Graphique 19 : Levelised costs estimations for PG , Euro/Mwh Source : Ecofys 2014 According to the above estimates, the levelised cost of gas based power plants is very close to the coal power plants (around € 50 / MWh), for a technically feasible full load hours, despite lower fuel costs for coal.. However, the average estimated cost based on lower operating rates observed in 2012, is about 95 € 2012 / MWh for gas plants, which is higher than the cost of coal power plants (around 75 € 2012 / MWh). These estimates showed that the decrease in the number of gas plants’ operating hours observed in 2012, has led to almost a doubling of its levelised costs. For renewable technologies (solar and wind), estimated levelised costs are higher than gas and coal power plants’ costs. However, these costs, for certain mature renewable technologies (photovoltaic and wind energy onshore), are closer to thermal power plants’ costs, particularly when lower operating rates are considered for these thermal power plants. The large subsidies granted to renewable energy (often in the form of Feed in Tariffs) and application of privileged regimes in supplying electricity markets, contributed to the sharp decrease of the unsubsidized gas power plants’ operating rates, and thus resulted in significant and artificial lower price references for electricity on the liberalized wholesale markets. In addition, the costs of subsidies associated to the exorbitant costs of infrastructure development and renewable integration in power systems, are usually passed on to the final consumer, with the consequences of strong disconnection between electricity wholesale prices and end use prices applied to residential and industrial consumers as shown in the charts below:
- 26. 26 Source : Eurostat, Quartley EC electricity report In the charts above, we can notice that the decrease of wholesale electricity price indices observed from 2013 until the end of 2014, has not been associated with a decrease in end use electricity prices. These latter, have even observed an upward trend, particularly in Germany, France and the United Kingdom. Residential consumers in particular, have had to endure these increases in electricity prices. Also, the significant drop in gas power plants’ operating rates has led to a strong revenues decrease, and thereby to a mothballing or even decommissioning of many Power plants, sometimes recent and efficient gas plants (especially Gas Combined Cycles). The decommissioning of thermal power plants, and in particular the gas power plants, deprives European electrical systems of large “Back Up” capacities and could increase the vulnerability of these electrical systems, by exaggerating their dependence on fluctuating and intermittent renewable electricity. All this has led to major dysfunctioning of European electricity markets, which have heavily penalized natural gas in the power generation sector. Graph 20 : Electricity wholesale indexes, West Center power hubs in Europe, Euro/Mwh Graph 21 : Electricity wholesale indexes, UK and Ireland, Euro/Mwh Graph 22 : End use electricity prices for households Middle range consumption (Euro/Kwh) Graph 23 : End use electricity prices for industrials Middle range consumption (Euro/Kwh)
- 27. 27 The reduction of renewable energy subsidies, particularly for mature technologies, and the integration of their real costs in the electricity markets functioning, would allow to give more relevant price signals to markets and contribute to reduce the gap between wholesale and end use Electricity prices. Gas power plants could therefore increase their margins and consequently their operating rates and thus could provide a competitive electricity to European consumers. Lesson 2: The gas / coal competition is critical for gas demand with regards to the functioning of liberalized electricity markets, but this competition is not favorable to gas despite its economic technical and environmental advantages Previous "levelised costs" estimates, which include investment costs, gave us an indication of power generation technologies competitiveness in Europe. However, with respect to the functioning of liberalized electricity markets, power plants’ operators would be based mainly on their variable costs’ parameters and on the availability and flexibility of their plants, to define their Power bid and then their power plants’ electricity production. Variable costs, including particularly fuel costs and carbon costs, are therefore among the main determinants of short-term competition and consequently of the power plants’ merit order in the dispatching of different power generation technologies. It worth to note that the power generation dispatching process allows to define the production needed to meet the electricity demand, the optimal mix of power plants production and help to establish reference prices for competitive electricity markets (Basing on marginal cost of electricity supply). However, electricity from renewable sources (wind and solar) do not follow the same dispatching rules of the thermal and nuclear power plants. This is because of the unpredictability and the intermittency of this electricity, and also because renewable sources have very low variable costs and a privileged treatment in the supply of electricity, The dynamic of competition between thermal power plants, particularly between gas and coal plants emerges as one of the main factors determining the place of gas plants in the dispatching of electricity production. The latter production allows to meet the remaining electricity demand not met by "non dispatchable." renewable sources However, the evolution of margins, including CO2 prices, of gas power plants (clean spark spreads) and coal power plants (clean dark spreads), illustrated in chart below, shows the great advantage of coal plants.
- 28. 28 Graphique 24: Clean Spark spread Vs. Clean Dark spread in UK and Germany Source :Platts (reporté dans le rapport trimestriel (4 ème trimestre) de la Commission européenne sur le marché électrique) The gap observed between the gas and coal power plants’ margins is mainly explained by: • The relatively low levels of international coal prices, supported by excess supply on the coal market, which is largely fed by the availability of American coal after the boom of shale gas and also by the coal demand stagnation or even decrease observed worldwide; . • Subsidies to domestic coal in some European countries, such as Germany, supporting this fuel in electricity generation. • Low levels of CO2 prices which are established under the European emission trading scheme (EU ETS), which does not reflect the environmental externality of coal. For the future prospects of these gas and coal power generation margins, it is worth noting that persistent coal supply surplus could maintain relatively low levels of coal international prices and thereby the economic benefit of this fuel, and this even in low gas prices cases. The competitiveness of gas against coal in power generation would be largely determined by the integration in the costs of the environmental externalities.
- 29. 29 III.2 Constraints related to the deployed energy policies in Europe The review of national energy policies deployed by European countries and of the regional reference framework developed by the European Union allows to notice a number of constraints and obstacles which would impede the growth of natural gas consumption. Among the main obstacles we have identified there are: => The inconsistency between, on one side, European energy policy advocating decarbonization and competitiveness of energy systems, where gas should play an important role, and on the other side, national policies dominated by national choices: Many examples can illustrate this inconsistency: • Coal subsidies, especially in Germany and also in Spain, which support the consumption of this fuel at the expense of natural gas; this approach is not compatible with the objective of reducing greenhouse gas emissions promoted by the EU. • Maintaining subsidies and important supports to renewables despite the exorbitant extra costs they induce on electricity supply chains, and which strongly deteriorate the competitiveness of energy supply in European countries. The European Commission has issued recommendations to reduce these subsidies and supports33, especially for mature renewable technologies. But the subsidy schemes are mainly based on national choices; and their evolution remains uncertain. • Uncertainties and lack of visibility with regard to nuclear prospects and policies. It may be noted some reluctance and hesitations by some European governments to make decommissioning of nuclear power plants, and we even see a renewed nuclear interest shown by some European countries. Additionally; the European Commission has recently allowed state supports for the installation of a new nuclear plant in UK ("Hinkley Point"), this state support is incompatible with the energy markets liberalization approach advocated by the European Union. • Predominance of national choices in relation to: i) the configuration of the national energy markets, ii) the development of energy mix, and also iii) the subsidy regimes, which contribute to the fragmentation of European energy markets; this fragmentation is not consistent with the objective of integration set by the European Union. • Inconsistency between the liberalization of natural gas markets and the entry barriers observed in some European gas markets (such as those linked to the dominance of monopolies, distortions in the application of unbundling rules or also interventionism of some governments), hindering new entrants’ access to gas markets, particularly in the distribution of Gas, 33 EU report recommending the reduction of subsidies (EC, 2014 (3)]
- 30. 30 => The inconsistency between the different levers and instruments considered by the European energy policy: It may be noted in this regard: • The difficulties of reconciling on one hand, the process of liberalization of energy markets and on the other hand, interventionism observed in order to control energy mix and support the development of other than gas source of energy. This has caused difficulties to appreciate the European energy policy (liberalization vs. regulation) and a lack of visibility for the role of gas in Europe; • The significant electricity markets dysfunctioning, owing to the inconsistency between on the one hand, the current configuration of wholesale electricity market resulting from the liberalization process, and on the other hand, the need to secure large "Back Up" capacities to manage intermittent and random variations of increased renewable electricity. The liberalized market logic has shown, in fact, its limitations in securing the necessary “Back Up” for Renewables34 , and has induced a significant risk of power supply disturbance in Europe. • The difficulties of ensuring competitive decarbonization of energy systems, with the costly deployment of renewables and inefficient carbon markets, all in a context of economic crisis which favored the progress of coal, which is the cheapest and most polluting energy source. => The uncertainties related to liberalization policies and to the configuration of gas transactions and pricing mechanisms The EU gas market reform process has been slow and many concerns do exist today in relation to the efficiency of the liberalization policy and the reliability of some mechanisms put in place in the framework of this policy: • We can note in this regards the concerns raised by some gas suppliers of Europe [K. Yamfimava, 2013], in connection with the third energy package, such as the reliability of gas transport capacity allocation mechanism, the regulatory treatment of new pipelines and also the problem of mismatch between gas flows corresponding to gas supply contracts, and transmission capacity to be reserved throughout the supply routes; this problem could be caused by the separation between gas supply and gas transport activities (Unbundling rules), the division of the European market areas and the application, not in homogenous manner, of the Entry/Exit model for the capacity reservation and for transmission tariffs definition. Indeed, the gas suppliers of Europe are perceiving a lack of visibility with regards to the gas supply routes and gas transport tariffs applied in different European markets, especially when gas needs to transit in European countries, before reaching its final destination. • Fragmentation and the lack of harmonization in rules and functioning of European gas markets are important constraints to market integration. The final 34Il y a lieu de noter dans ce sens, que la production de l’électricité renouvelable solaire et éolienne, ayant un coût marginal nul, dépend plus des conditions climatiques que des conditions de marché, et contribue fortement à déprimer les prix de référence de gros, décourageant ainsi l’investissement dans les capacités de Back Up.
- 31. 31 configuration of the European gas market remains a major uncertainty for gas suppliers. The new strategy proposal launched by the European Commission recognizes, somewhere, that there are obstacles and constraints in the implementation of the integrated natural gas market, and proposes to strengthen the coordination between member countries as part of a Energy Union. Despite this willingness, the predominance of national choices at the expense of a regional strategy, as well as the difficulties of European gas markets’ integration, are likely to persist especially in the current context characterized by signals of rising sovereignties in Europe. On another side, the European gas market liberalization is challenging the traditional principles and mechanisms of gas transactions based on long-term oil indexed contracts, which have enabled the development of gas industry. Indeed, traditional mechanisms allow an equitable risk sharing between gas suppliers and consumers.. Long-term oil indexed contracts have been able to ensure gas demand security for suppliers, and better visibility on revenues, which is an important condition to secure the huge investment required for the development of capital intensive gas supply chains. Questioning these principles and seeking, in a process to promote gas competition, to introduce an indexation on short term references, which are defined on markets (gas hubs), strongly influenced by speculative behaviors35 and often lack liquidity and transparency36 , would increase significantly the uncertainty and put a great challenge for the developers of natural gas supply chains. All cited above concerns, could significantly constrain the investments required to ensure the security of gas supply to Europe, mainly in the context of declining European domestic gas production. => The differences between natural gas wholesale prices ("Wholesale prices") and End use charged to European consumers Among the constraints affecting natural gas demand growth, we can also mention the difference between the levels and evolution dynamics observed for wholesale prices of natural gas and those applied to end consumers. This difference is mainly driven by the characteristics and the structure of the gas distribution markets, and also by the levels of taxes and levies which are often used as energy policy levers in European countries. The graphs below show, for German and English cases, the difference between wholesale price indexes and end use prices charged to industrial and residential consumers (middle range consumers37 ) 35 Gas players often talk about disconnection between the gas Hubs’ references affected by the financial markets, and gas physical markets (see [S. Komlev, 2014] 36Even the NBP, the most developed hub in Europe, has shown in the past signs of non stability of these liquidity indicators 37 Consumption ranges: I3 for industrials (10000 GJoules <consumption <100000 GJoules) and D2 for households (20GJ <consumption <200GJ)
- 32. 32 0,0000 5,0000 10,0000 15,0000 20,0000 25,0000 30,0000 2008S1 2008S2 2009S1 2009S2 2010S1 2010S2 2011S1 2011S2 2012S1 2012S2 2013S1 Prix industriel (incl taxes et prélèvements) Prix résidentiel (incl taxes et prélèvements) Prix Import BAFA ($/mmbtu) 0,0000 5,0000 10,0000 15,0000 20,0000 25,0000 30,0000 2008S12008S22009S12009S22010S12010S22011S12011S22012S12012S22013S12013S22014S12014S22015S1 Indus Toutes taxes et prélèvementscompris ResToutes taxes et prélèvements compris NBP UK ($/mmbtu) Source : Eurostat, OFGEM, FSO Allemagne We can see in the charts that the downward trend in average wholesale prices observed in Germany since the second half of 2010, has been associated with an upward trend for end use prices, mainly prices applied to residential consumers. These final prices started however to decrease in the second half of 2012 with a significant delay comparing to wholesale prices. This has led to widen the gap between gas wholesale prices and end use prices for Germany. This disconnection between wholesale prices and end use prices can also be seen in the United Kingdom, where the wholesale price signals represented by NBP indices show decreases which are slow to be passed on to final prices. Indeed, the final prices maintain relatively high levels with a growing gap compared to wholesale price indices, especially for residential consumers. => The European carbon market dysfunctioning, with sustainable low CO2 prices which strongly disadvantage natural gas The European CO2 emissions market (EU ETS) is based on the principle ("Cap and Trade"); this principle consists to set tolerated CO2 emissions’ limits (Emissions' Cap) 38 , and to allocate, taking into account these limits, emissions permits ("Allowances”) which are exchangeable on the CO2 market. The supply and demand of these emission allowances define CO2 price references, which reflect the value of emitted carbon. A high reference prices should provide incentives and encourage operators to reduce their CO2 emissions, particularly by investing in clean technologies. The European carbon market has experienced several phases of development: i) the first phase between 2005 and 2007, which is a pilot phase involving large industrial consumers and power plants; ii) a second phase between 2008 and 2012 which saw the active implementation of this market and which coincided with the deadlines related to the commitments of the European countries under the Kyoto Protocol (Kyoto I) and iii) a 38Failure to comply with the limits can lead to penalties payments, according to the principle “Polluter / Payer” Graph 25 : Wholesale gas prices Vs End use gas prices for households and industrials in Germany ($/mmbtu) Graph 26 : Wholesale gas prices Vs End use gas prices for households and industrials in UK ($/mmbtu)
- 33. 33 third current phase, between 2013 and 2020, concurring with the Kyoto II European engagements. The evolution of European CO2 reference prices showed a price collapse after the economic recession occurred in 2008. This collapse was driven by the large surplus of emission permits’ supply, comparing to permits demand strongly affected by the impact of the economic recession. The imbalance observed in the European carbon market persists until today, with price levels around $ 8 / T. CO2 (5 Pounds / TCO2). These low prices do not provide adequate incentives to reduce CO2 emissions. Graph 27 : Average CO2 prices in Europe and UK, Pounds/T. CO2 Source : Bloomberg, DECC repris dans le rapport [Ofgem, 2015] In April 2013, UK has introduced a Carbon Price Floor (CPF Measure) in order to send a signal to the markets to reduce CO2 emissions. The UK CO2 price floor has led to significant disconnection between average European CO2 price references and UK CPF prices (See Graph. 27) It is worth noting that the persistent imbalance on the European carbon market, has greatly undermined the credibility of the CO2 trading scheme in Europe and feeds doubt on its effectiveness in decarbonizing European economies. Today there is a lack of visibility regarding the resorption of this imbalance and the recovery of CO2 prices. In addition, operators need to have a vision on CO2 price over the medium to long terms, in order to engage investments in cleaner processes and technologies, which are often capital intensive. The rise of coal in power generation and even some announcement of new investments in coal based generation capacities in Europe, are the direct results of this Carbon markets dysfunctioning. It witnesses the lack of confidence in this carbon market, particularly in a context where coal prices prospects are relatively moderate. Natural gas was strongly penalized by the carbon market failure, which has prevented this clean source of energy to fully play its role in ensuring competitive decarbonization for Europe.
- 34. 34 According to a recent projection produced by IHS (See [MATHEU M., 2015}), carbon market would have only a marginal role in reducing emissions of greenhouse gases by 2020, compared to other measures based on subsidies an markets’ interventionism. This illustrates that European Union has made the choice of very expensive instruments to reduce its CO2 emissions. Furthermore, the additional electricity costs generated by the decarbonization choices and applied to the end use customer in many European countries, has led to the loss of competitiveness and wealth for the energy consumers. This has encouraged the adoption of a very ineffective approach, consisting to keep CO2 prices low and to delay carbon markets reforms to support competitiveness in a context of persistent economic crisis. In this regard, European decarbonization approach seems to be both costly and inefficient, and justifies, in our view, a profound and accelerated reform of the carbon market, like for example the CPF measure in UK. The European Commission has proposed a measure (“auctionning backloading ")39 which consists to postpone a supply of 900 million emission allowances until 2019, initially planned to be released between 2014 and 2016, in order to reduce the surplus of allowances on the market. This measure, although started in 2014, failed to absorb the surplus, and CO2 prices have remained at very low levels in 2014 and 2015. Deeper measures are then expected to correct carbon markets’ dysfunctioning, and especially to improve the visibility on long-term CO2 price, in order to encourage investors to make the right choices, compatible with environmental concerns and economic competitiveness. In this context, the review of CO2 market functioning for Phase IV (from 2021 e 2030), proposed by the European Commission, is an important step conditioning the carbon market outlook. The European countries acceptance of these CO2 reforms and the removal of inconsistencies between national and European policies are key elements to enable real improvement in the effectiveness of carbon markets. 39Other measures are proposed on the long term, such as the establishment of a "Market stability reserve" in 2019, which aims to provide the carbon market with a reserve fund used to manage the allowances supply flexibility
- 35. 35 Conclusion This communication aims to provide some clarifications with regards to two questions, which are of main concerns of Europe gas suppliers, particularly with the decreasing gas demand observed recently in this region: i) What are the determinants that drive the role of gas in European energy mix? ii) What are the constraints and barriers that prevent natural gas, a clean fuel, to play its full role in the decarbonization of the European economies? The analysis of the various determinants of European gas demand, including macroeconomic, sectoral or European energy policy determinants, has shown that there are significant structural changes in the European energy markets, with transformations in economies’ structure, declining energy intensity, high penetration of renewables, especially in power generation and also a strong desire to move towards an energy transition. These developments reduce the predictability of European natural gas demand and increase the need of energy supply flexibility. Our analysis highlighted that natural gas, a clean fuel with great economic and environmental technical advantages, still has interesting growth potential in Europe, especially in power generation and also in transport sector, but the gas is facing distortions and constraints affecting significantly its future role in the European energy mix. Two main categories of constraints have been identified in this regard: i) constraints on the competitiveness of gas, particularly in power generation and ii) constraints related to the applied energy policies. => The competitiveness of natural gas in power generation is largely penalized in Europe because of : • The substantial decrease in wholesale electricity reference prices on the liberalized markets, which resulted in a significant margins’ reduction of the non-subsidized thermal power plants, and particularly gas power plans. This decrease is artificial because it is mainly driven by the competition of subsidized and privileged alternatives in supplying electricity markets. • The competition of a polluting coal fuel, with CO2 price levels not enough incorporating environmental externalities. Carbon market dysfunctioning have had a direct effect on the competitiveness of gas in the electricity sector. • The significant drop in gas power plants’ operating rates, owing to the competition of renewables and coal, resulting in lower revenues and leading to mothballing or even decommissioning of gas power plants, sometimes recent and efficient gas plants (especially Gas Combined Cycles). The gas power plants’ decommissioning would deprive European electrical systems of large “Back Up” Capacities and contribute to increase their vulnerability, with rising reliance on intermittent renewable electricity. • The disconnection between high electricity prices applied to end consumers and electricity wholesale prices affected by the application of subsidies and specific regimes. The final European consumer is indeed paying the high costs of renewable subsidies, at the expense of a competitive gas based electricity, the consumer also pays the exorbitant
- 36. 36 costs of infrastructure development and of renewable energy integration in power systems. All these factors exert significant pressure on the price of gas for power generation and contribute in an artificial loss of the gas value in this sector, a loss that allows somewhere to finance large subsidies granted to alternative electricity production, => Other identified constraints that affect the role of natural gas in the European energy mix are those related to the choice of energy policies and the observed inconsistencies, leading to difficult understanding of these policies, including: The inconsistency between, on one side, European energy policy advocating decarbonization and competitiveness of energy systems, where gas should play an important role, and on the other side, national policies dominated by national choices The inconsistency between the different levers and instruments considered by the European energy policy such as, the difficulties of reconciling on one hand, the process of liberalization of energy markets, and on the other hand, interventionism observed in order to control energy mix and to support the development of other than gas source of energy. This has caused difficulties to understand the European energy policy (liberalization vs. regulation) and a lack of visibility for the role of gas in Europe; The European choice of uncompetitive decarbonization approach, with significant and costly deployment of renewable and inefficient carbon markets, all in a context of economic crisis which favored the rise of coal, the cheapest and most polluting energy source; Uncertainties related to liberalization policies and to the undermining of traditional gas transaction and pricing mechanisms, based on long-term indexed contracts, which enabled in the past the development of gas industry. Questioning these principles and seeking to introduce an indexation on short term references, which are defined on markets (gas hubs), strongly influenced by speculative behaviors and often lack liquidity and transparency, would increase significantly the uncertainty and put a great challenge for the gas suppliers who develop capital intensive natural gas supply chains This communication has shown that technical, economic and environmental advantages of natural gas make this fuel compatible with sustainable development, but gas needs a support with regards to the multiple barriers and constraints hindering its growth perspectives in Europe. This could occur through a constructive dialogue between producers and consumers of natural gas
- 37. 37 BIBLIOGRAPHY [EC, 2015]: “A Framework Strategy for a Resilient Energy Union with a Forward-Looking Climate Change Policy”, ENERGY UNION PACKAGE, Feb. 2015 [EC, 2015(2)] : « Climate action progress report, including the report on the functioning of the European carbon market and the report on the review of Directive 2009/31/EC on the geological storage of carbon dioxide”, European Commission communication, Oct. 2015 EC, 2015(3)] : Assessment of the progress made towards the national energy efficiency targets for 2020 and towards the implementation of the Energy Efficiency Directive 2012/27/EU as required by Article 24 (3) of Energy Efficiency Directive 2012/27/EU », European Commission, Nov. 2015) [EC, 2015(4)]: “Renewable energy progress report”, European Commission, Juin 2015 [EC, 2015(5)]: “Monitoring progress towards the Energy Union objectives - Concept and first analysis of key indicators - Accompanying the document..State of Energy Union», European Commission, Nov. 2015 [EC, 2014]:”A policy framework for climate and energy in the period from 2020 to 2030”, European Commission communication, Janv. 2014 [EC, 2014(2)] : « Energy Efficiency and its contribution to energy security and the 2030 Framework for climate and energy policy », European Commission, Juillet 2014 [EC, 2014(3)] : « Guidelines on State aid for environmental protection and energy for 2014-2020 », COMMISSION STAFF WORKING DOCUMENT IMPACT ASSESSMENT, 2014 [EC, 2013]: “EU ENERGY, TRANSPORT AND GHG EMISSIONS TRENDS TO 2050- REFERENCE SCENARIO 2013”, European Commission, Dec. 2013 [EC, 2011] :« Energy Roadmap 2050: “Impact assessment and scenario analysis », European Commission, Dec. 2011 [DUKES, 2015]: « Digest of UK Energy Statistics - Electricity Chapter 5 & Renewables Chapter 6 », 2015 [EC, 2006]: “GREEN PAPER, A European Strategy for Sustainable, Competitive and Secure Energy”, European Commission communication, mars, 2006. [Ofgem, 2015] : « Wholesale Energy Markets in 2015”, Ofgem, Sept. 2015 [SA.Hamdani, 2012]: “Gas market globalization: Perspectives and Limits”, Sid Ahmed Hamdani, Papier communiqué dans la World Gas Conference 2012, , Kuala Lumpur, Juin 2015. [SA. Hamdani, 2015]:”Perspectives futures du rôle du gaz dans la génération électrique de la région MENA », Sid Ahmed Hamdani, JST 10, Papier communiqué dans les JST 10, Journées Scientifiques et Techniques de Sonatrach 10ème Edition, Septembre 2015 [IGU PGC C,2015], « Role of gas in power generation”, Juin 2015, WGC 2015 [Enerdata, 2015]: “EnerFuture Energy Scenarios to 2040 - Understanding our Energy Future”, Fev. 2015 [C. le Fevre, 2014] : “The prospects for natural gas as a transport fuel in Europe”, Oxford Energy Institute, Chris le Fevre, Mars, 2014 [EEA, 2015]: Annual European Union greenhouse gas inventory 1990–2013 and inventory report 2015, Submission to the UNFCCC, European Environment Agency, 2015 [ME, 2015(1)] : « La règlementation européenne ă l’épreuve du troisième paquet énergétique », Revue Energie, N 4, Ministère de l’énergie algérien, Edition Avril – Mai 2015. [ME, 2015(2)] : « La nouvelle stratégie de politique énergétique européenne : L’union de l’énergie, vers un nouveau cycle institutionnel », Revue Energie, N 5, Ministère de l’énergie, Edition Juin – juillet 2015) [K.Yamfimava, 2013] : « The EU third package for gas and the gas target model : major contentious issues inside and outside the EU », Oxford Energy Institute, Juillet 2013. [S. Komlev, 2014]: « Europe’s Oversupplied Gas Market », Blue Print, Vol.7, Issue 4 ? S. Komlev, Nov ; 2014 [Ofgem, 2015] : « Wholesale Energy Markets in 2015”, Ofgem, Sept. 2015 [M. MATHEU, 2015} : Quel cadre pour la politique énergie climat européenne à l’horizon 2030 ? », Michel MATHEU dans la Revue MEDENERGIE, N° Janvier 2015. [A. Honoré, 2014], « Outlook of gas demand in Europe », AnoukHonoré, Oxford Energy Institute, Juin 2014 [J. Stern & H. Rogers, 2014]: “The Dynamics of a Liberalised European Gas Market: Key determinants of hub prices, and roles and risks of major players”, Jonathan Stern & Howard V Rogers, Oxford Energy Institute, Décembre 2014.