1. Jefferson Elementary
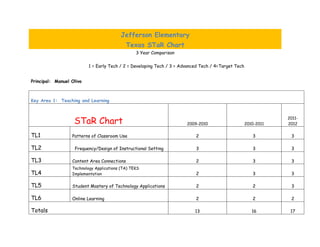
Texas STaR Chart
3 Year Comparison
1 = Early Tech / 2 = Developing Tech / 3 = Advanced Tech / 4=Target Tech
Principal: Manuel Olivo
Key Area 1: Teaching and Learning
STaR Chart 2009-2010 2010-2011
2011-
2012
TL1 Patterns of Classroom Use 2 3 3
TL2 Frequency/Design of Instructional Setting 3 3 3
TL3 Content Area Connections 2 3 3
Technology Applications (TA) TEKS
TL4 Implementation 2 3 3
TL5 Student Mastery of Technology Applications 2 2 3
TL6 Online Learning 2 2 2
Totals 13 16 17
2. Key Area 2: Educator Preparation & Development
STaR Chart 2009-2010 2010-2011
2011-
2012
EP1 Professional Development Experiences 2 3 3
EP2 Models of Professional Development 2 2 3
EP3 Capabilities of Educators 3 3 3
EP4 Access to Professional Development 2 2 2
EP5 Levels of Understanding and Patterns of Use 2 3 3
Professional Development for Online
EP6 Learning 2 2 2
Totals 13 15 16
3. Key Area 3: Leadership, Administration, & Instructional Support
STaR Chart 2009-2010 2010-2011
2011-
2012
L1 Leadership and Vision 3 3 3
L2 Planning 3 3 3
L3 Instructional Support 3 3 3
L4 Communication and Collaboration 3 3 3
L5 Budget 2 3 3
L6 Leadership and Support for Online Learning 3 3 3
Totals 17 18 18
4. Key Area 4: Infrastructure for Technology
STaR Chart 2009-2010 2010-2011
2011-
2012
INF1 Students per Computers 2 3 2
INF2 Internet Access Connectivity Speed 4 4 4
INF3 Other Classroom Technology 3 3 3
INF4 Technical Support 3 3 3
INF5 Local Area Network Wide Area Network 3 3 3
INF6 Distance Learning Capacity 3 3 3
Totals 18 19 18
5. Key Area Summary
Key Areas Key Area Totals Key Area STaR Classification
2009- 2010- 2011-
2010 2011 2012
Teaching and Learning 13 16 17 Advance Technology
Educator Preparation and Development 13 15 16 Developing Technology
Leadership, Admin., Instr. Support 17 18 18 Advance Technology
Infrastructure for Technology 18 19 18 Advance Technology