SlideShare a Scribd company logo
1 of 9
Download to read offline
News ReleaseFOR IMMEDIATE RELEASE:
Competition continues to drive Metro Vancouver’s housing market
VANCOUVER, B.C. – September 2, 2015 – Metro Vancouver* home buyers spent the
summer months searching for their next home. Between June and August, home sales were
between 25 and 30 per cent above the ten-year sales average.
The Real Estate Board of Greater Vancouver (REBGV) reports that residential property sales in
Metro Vancouver reached 3,362 on the Multiple Listing Service® (MLS®) in August 2015. This
represents a 21.3 per cent increase compared to the 2,771 sales recorded in August 2014, and a
decrease of 15.5 per cent compared to the 3,978 sales in July 2015.
Last month’s sales were 27.9 per cent above the 10-year sales average for the month.
“There was no summer lull in our market this year. Home buyers have been working with their
REALTORS® throughout the summer months,” Darcy McLeod, REBGV president said.
“They’re motivated, but they’re competing for a smaller supply of homes for sale than is typical
for this time of year — that’s the dynamic driving our market right now.”
New listings for detached, attached and apartment properties in Metro Vancouver totalled 4,281
in August. This represents an 8.7 per cent increase compared to the 3,940 new listings reported
in August 2014.
The total number of properties currently listed for sale on the region’s MLS® is 10,897, a 26.2
per cent decline compared to August 2014 and a 5.3 per cent decline compared to July 2015.
“Those who have a sound buying strategy and an understanding of current price trends are
having the most success in today’s market,” McLeod said.
The MLS® Home Price Index composite benchmark price for all residential properties in Metro
Vancouver is currently $708,500. This represents a 12 per cent increase compared to August
2014.
The sales-to-active-listings ratio in August was 30.9 per cent. This is the sixth consecutive month
that this ratio has been above 30 per cent in Metro Vancouver.
Sales of detached properties in August 2015 reached 1,290, an increase of 11.4 per cent from the
1,158 detached sales recorded in August 2014, and a 22.6 per cent increase from the 1,052 units
sold in August 2013. The benchmark price for a detached property in Metro Vancouver
increased 17.5 per cent from August 2014 to $1,159,600.
Sales of apartment properties reached 1,494 in August 2015, an increase of 32.7 per cent
compared to the 1,126 sales in August 2014, and an increase of 46.8 per cent compared to the
1,018 sales in August 2013. The benchmark price of an apartment property increased 6.3 per cent
from August 2014 to $405,400.
Attached property sales in August 2015 totalled 578, an increase of 18.7 per cent compared to
the 487 sales in August 2014, and a 30.2 per cent increase from the 444 attached properties sold
in August 2013. The benchmark price of an attached unit increased 7.3 per cent between August
2014 and 2015 to $511,500.
*Editor’s Note: Areas covered by Real Estate Board of Greater Vancouver include: Whistler, Sunshine Coast,
Squamish, West Vancouver, North Vancouver, Vancouver, Burnaby, New Westminster, Richmond, Port Moody,
Port Coquitlam, Coquitlam, New Westminster, Pitt Meadows, Maple Ridge, and South Delta.
-30-
The real estate industry is a key economic driver in British Columbia. In 2014, 33,116 homes changed ownership in
the Board’s area, generating $2.136 billion in economic spin-off activity and an estimated 16,227 jobs. The total
dollar value of residential sales transacted through the MLS® system in Metro Vancouver totalled $27.3 billion in
2014. The Real Estate Board of Greater Vancouver is an association representing nearly 12,000 REALTORS® and
their companies. The Board provides a variety of member services, including the Multiple Listing Service®. For
more information on real estate, statistics, and buying or selling a home, contact a local REALTOR® or visit
www.rebgv.org.
For more information please contact:
Craig Munn
Manager, Communication
Real Estate Board of Greater Vancouver
604.730.3146
cmunn@rebgv.org
Property Type Area
Benchmark
Price
Price
Index
1 Month
Change %
3 Month
Change %
6 Month
Change %
1 Year
Change %
3 Year
Change %
5 Year
Change %
10 Year
Change %
Residential / Composite Lower Mainland $624,600 176.1 1.1% 3.5% 8.4% 10.6% 14.1% 21.4% 64.4%
Greater Vancouver $708,500 185.4 1.1% 3.5% 9.1% 12.0% 16.5% 24.8% 72.5%
Bowen Island $630,100 136.6 2.6% 4.9% 7.2% 7.0% 5.7% 1.8% 23.2%
Burnaby East $671,700 185.4 1.5% 4.6% 11.5% 14.0% 19.6% 25.8% 72.0%
Burnaby North $601,300 180.7 1.0% 4.1% 9.7% 12.0% 18.3% 23.9% 68.4%
Burnaby South $654,100 184.9 0.5% 2.6% 7.2% 10.1% 14.7% 25.4% 72.5%
Coquitlam $595,600 176.2 1.2% 3.3% 9.4% 12.4% 17.9% 25.7% 66.5%
Ladner $641,300 178.4 1.3% 6.6% 14.3% 16.8% 16.9% 23.5% 69.4%
Maple Ridge $423,500 143.1 1.0% 3.2% 6.0% 7.9% 8.6% 8.5% 36.9%
New Westminster $413,000 175.9 1.1% 4.2% 7.8% 8.9% 11.8% 18.2% 62.4%
North Vancouver $755,300 170.4 0.5% 0.9% 7.2% 10.7% 15.2% 22.6% 59.4%
Pitt Meadows $428,500 156.8 1.5% 1.3% 6.2% 10.7% 14.7% 14.0% 49.8%
Port Coquitlam $456,000 161.6 0.7% 3.0% 9.5% 10.2% 14.9% 15.7% 52.3%
Port Moody $601,800 166.4 0.6% 3.7% 8.2% 10.9% 17.3% 21.0% 55.7%
Richmond $664,700 192.6 1.0% 3.8% 9.2% 11.7% 14.9% 21.7% 80.7%
Squamish $449,900 146.6 0.3% 0.2% 5.4% 8.3% 11.3% 11.4% 38.3%
Sunshine Coast $379,600 133.0 0.3% 3.3% 8.1% 5.6% 3.7% -0.7% 18.9%
Tsawwassen $738,500 185.0 2.0% 7.4% 17.5% 20.1% 20.7% 28.1% 72.6%
Vancouver East $739,800 216.7 1.0% 4.4% 10.3% 14.1% 20.7% 36.9% 99.5%
Vancouver West $966,100 203.6 1.8% 3.8% 9.3% 12.7% 20.3% 30.8% 86.6%
West Vancouver $1,990,400 213.6 1.8% 5.4% 13.3% 17.2% 24.4% 55.7% 97.2%
Whistler $516,900 120.1 -0.5% -1.2% 3.5% 7.1% 7.0% 3.0% 15.0%
Single Family Detached Lower Mainland $920,000 195.4 1.5% 4.7% 11.4% 15.1% 19.8% 34.0% 83.8%
Greater Vancouver $1,159,600 213.9 1.6% 5.0% 13.0% 17.5% 22.8% 40.7% 101.0%
Bowen Island $630,100 136.6 2.6% 4.9% 7.2% 7.0% 5.7% 1.8% 23.2%
Burnaby East $940,900 210.4 3.0% 7.7% 19.1% 21.4% 24.7% 42.9% 95.0%
Burnaby North $1,192,500 230.6 1.9% 6.5% 15.3% 21.9% 30.9% 48.9% 115.9%
Burnaby South $1,206,200 230.9 0.6% 3.8% 12.8% 17.9% 19.6% 52.0% 117.8%
Coquitlam $888,200 196.8 1.5% 5.1% 12.7% 17.0% 24.2% 38.3% 87.1%
Ladner $765,000 184.6 1.5% 7.3% 16.5% 20.0% 20.0% 28.1% 75.1%
Maple Ridge $518,400 147.7 1.6% 3.9% 7.9% 9.0% 12.2% 13.4% 42.3%
New Westminster $818,700 203.1 2.8% 6.6% 17.4% 19.9% 21.6% 36.7% 89.1%
North Vancouver $1,188,500 189.2 1.1% 1.8% 11.6% 16.3% 24.1% 36.4% 78.2%
Pitt Meadows $572,900 161.5 1.3% 3.4% 8.5% 10.6% 15.9% 15.7% 55.4%
Port Coquitlam $680,400 181.5 1.0% 5.2% 14.7% 16.5% 21.3% 29.2% 72.7%
Port Moody $1,027,800 189.8 0.2% 3.7% 10.7% 13.6% 20.7% 34.1% 80.4%
Richmond $1,186,100 237.9 1.8% 5.2% 12.9% 18.8% 21.1% 38.9% 122.8%
Squamish $607,300 161.4 1.4% 2.3% 8.0% 10.5% 18.7% 26.7% 47.5%
Sunshine Coast $377,600 132.3 0.4% 3.4% 8.2% 5.6% 3.5% -1.3% 18.2%
Tsawwassen $913,500 196.7 2.4% 7.7% 19.9% 22.8% 25.4% 37.1% 81.5%
Vancouver East $1,136,000 251.1 1.8% 6.1% 14.7% 21.4% 32.3% 61.1% 135.6%
Vancouver West $2,695,100 276.7 1.6% 5.5% 12.1% 17.9% 27.2% 52.4% 160.5%
West Vancouver $2,394,100 227.6 1.5% 4.5% 14.2% 18.2% 26.2% 64.7% 110.0%
Whistler $1,047,500 145.0 2.2% 2.3% 6.9% 9.1% 18.8% 16.7% 36.3%
HOW TO READ THE TABLE:
• Benchmark Price: Estimated sale price of a benchmark property. Benchmarks represent a typical property within each market.
• Price Index: Index numbers estimate the percentage change in price on typical and constant quality properties over time. All figures are based on past sales.
• x Month/Year Change %: Percentage change of index over a period of x month(s)/year(s) *
In January 2005, the indexes are set to 100.
Townhome properties are similar to Attached properties, a category that was used in the previous MLSLink HPI, but do not included duplexes.
The above info is deemed reliable, but is not guaranteed. All dollar amounts in CDN.
August 2015*
* MLS®, Multiple Listing Service®, and all related graphics are trademarks of The Canadian Real Estate Association 1 of 14
Property Type Area
Benchmark
Price
Price
Index
1 Month
Change %
3 Month
Change %
6 Month
Change %
1 Year
Change %
3 Year
Change %
5 Year
Change %
10 Year
Change %
August 2015*
Townhouse Lower Mainland $422,700 153.0 0.3% 1.7% 5.1% 5.6% 6.6% 8.3% 44.7%
Greater Vancouver $511,500 165.3 0.0% 2.1% 6.2% 7.3% 10.4% 13.5% 55.6%
Burnaby East $445,000 159.6 -2.1% 0.8% 2.8% 4.2% 6.0% 10.8% 50.9%
Burnaby North $435,200 162.3 -1.2% 0.9% 8.6% 6.7% 9.7% 8.2% 50.1%
Burnaby South $440,900 158.2 0.4% 1.7% 6.7% 4.3% 5.9% 8.9% 50.2%
Coquitlam $420,000 154.3 0.4% 1.7% 2.6% 7.8% 9.9% 11.6% 44.9%
Ladner $505,200 167.4 -0.1% 3.4% 9.6% 9.5% 12.4% 18.5% 57.8%
Maple Ridge $289,600 140.7 -0.8% 4.0% 3.3% 6.3% 5.7% 2.6% 32.6%
New Westminster $438,200 164.6 -2.0% 1.0% 5.2% 6.3% 12.5% 15.9% 54.8%
North Vancouver $655,500 156.9 0.9% 3.5% 7.0% 8.4% 11.1% 11.4% 47.3%
Pitt Meadows $367,700 159.1 1.7% 2.2% 11.8% 12.7% 14.4% 15.0% 50.9%
Port Coquitlam $403,500 153.0 0.5% 1.0% 6.6% 4.3% 10.4% 8.7% 43.1%
Port Moody $457,200 154.5 0.7% 3.2% 4.2% 8.4% 12.0% 11.9% 42.8%
Richmond $555,600 179.6 0.7% 2.9% 6.1% 8.6% 10.6% 16.0% 70.9%
Squamish $378,000 137.2 -1.1% -0.5% 5.9% 2.0% 6.6% 8.6% 35.8%
Tsawwassen $493,200 163.0 -1.3% 2.6% 8.7% 10.8% 9.5% 15.0% 53.6%
Vancouver East $566,300 186.7 -0.8% 1.0% 7.1% 4.2% 10.5% 18.4% 69.1%
Vancouver West $811,200 183.5 0.3% 2.3% 6.6% 9.0% 17.8% 23.7% 72.3%
Whistler $517,900 138.5 -1.6% -0.6% 4.8% 3.7% 7.9% 18.9% 37.0%
Apartment Lower Mainland $364,000 158.9 0.9% 1.9% 4.5% 5.2% 7.4% 9.0% 45.9%
Greater Vancouver $405,400 163.0 1.1% 2.1% 4.9% 6.3% 9.9% 11.3% 49.5%
Burnaby East $443,400 168.3 2.6% 1.4% 3.9% 8.1% 29.9% 9.2% 50.9%
Burnaby North $362,200 153.1 0.9% 2.6% 4.0% 3.9% 9.7% 10.0% 42.6%
Burnaby South $412,900 165.8 0.5% 1.4% 3.0% 5.5% 12.4% 13.5% 52.7%
Coquitlam $274,700 151.2 0.8% 0.5% 6.0% 5.8% 8.5% 9.6% 42.0%
Ladner $352,500 167.1 1.8% 7.2% 11.1% 12.8% 9.6% 11.9% 60.5%
Maple Ridge $169,300 122.3 0.2% -2.5% -1.2% 3.2% -7.6% -7.3% 15.8%
New Westminster $292,900 166.8 0.6% 3.4% 4.1% 4.6% 7.4% 11.3% 53.2%
North Vancouver $365,400 148.7 -0.9% -1.2% 0.8% 3.3% 3.1% 7.5% 38.1%
Pitt Meadows $252,600 149.3 1.2% -2.2% -0.3% 8.3% 14.2% 12.3% 41.4%
Port Coquitlam $238,900 141.6 0.6% 1.2% 3.6% 5.8% 8.6% 2.8% 32.2%
Port Moody $367,400 153.1 0.8% 3.7% 7.3% 8.0% 14.3% 14.1% 42.7%
Richmond $361,200 152.5 0.0% 1.0% 3.8% 1.5% 5.8% 2.0% 41.7%
Squamish $270,600 130.3 -0.6% -1.6% -0.8% 19.3% 2.8% -10.4% 25.0%
Tsawwassen $363,300 153.2 1.5% 6.9% 11.2% 13.1% 7.5% 3.9% 47.2%
Vancouver East $331,400 182.8 0.3% 2.8% 4.0% 5.7% 7.8% 12.2% 63.9%
Vancouver West $542,200 175.5 2.3% 3.1% 7.4% 9.3% 15.2% 18.9% 58.7%
West Vancouver $688,400 150.4 3.5% 11.2% 4.2% 8.6% 12.2% 13.3% 39.4%
Whistler $264,500 86.7 -1.0% -3.6% 0.5% 18.1% 10.2% -21.6% -18.2%
HOW TO READ THE TABLE:
• Benchmark Price: Estimated sale price of a benchmark property. Benchmarks represent a typical property within each market.
• Price Index: Index numbers estimate the percentage change in price on typical and constant quality properties over time. All figures are based on past sales.
• x Month/Year Change %: Percentage change of index over a period of x month(s)/year(s)
In January 2005, the indexes are set to 100. *
Townhome properties are similar to attached properties, a category that was used in the previous MLSLink HPI, but do not included duplexes.
Lower Mainland includes areas serviced by both Real Estate Board of Greater Vancouver & Fraser Valley Real Estate Board.
The above info is deemed reliable, but is not guaranteed. All dollar amounts in CDN.
* MLS®, Multiple Listing Service®, and all related graphics are trademarks of The Canadian Real Estate Association 2 of 14
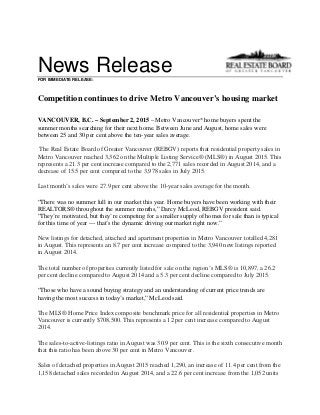
C:DATAMonthEndHpiexporthi_resgv-hpi2.tifGreaterVancouver
5YearTrend
60
80
100
120
140
160
180
200
220
240
Aug 2010
Oct 2010
Dec 2010
Feb 2011
Apr 2011
Jun 2011
Aug 2011
Oct 2011
Dec 2011
Feb 2012
Apr 2012
Jun 2012
Aug 2012
Oct 2012
Dec 2012
Feb 2013
Apr 2013
Jun 2013
Aug 2013
Oct 2013
Dec 2013
Feb 2014
Apr 2014
Jun 2014
Aug 2014
Oct 2014
Dec 2014
Feb 2015
Apr 2015
Jun 2015
Aug 2015
Price
Index
ResidentialDetachedTownhouseApartment
Jan2005HPI=100
8222015MLS®
SALESFacts
Burnaby
Coquitlam
Delta-South
Islands-Gulf
MapleRidge/PittMeadows
NewWestminster
NorthVancouver
PortCoquitlam
PortMoody/Belcarra
Richmond
Squamish
SunshineCoast
VancouverEast
VancouverWest
WestVancouver/HoweSound
Whistler/Pemberton
Detached12410443415132955329181246213814883191,290
Attached75581506311284216941643776439578
Apartment2159223025859641301789612752613281,494
Detached$1,261,090$920,000$885,000n/a$594,250$837,500$1,356,000$665,000$1,050,000$1,310,000$715,000$407,568$1,293,500$2,870,000$2,500,000n/a
Attached$520,000$547,450n/an/a$317,500n/a$749,250$459,500n/a$593,500n/an/a$740,000$940,000n/a$525,000n/a
Apartment$407,000$331,250$395,000n/a$220,000$323,000$432,950$267,400$408,500$352,000n/an/a$400,000$551,500n/a$233,750
Detached153198687159381166427218308114915580161,559
Attached116578074133942141321886376921690
Apartment2381032004395128563918815917557417291,729
Detached$1,327,500$893,000$915,000n/a$549,450$854,000$1,300,000$673,000$990,000$1,320,000$677,000$430,000$1,280,000$2,900,000$2,500,000n/a
Attached$537,500$493,000n/an/a$319,816n/a$698,000$414,950n/a$589,950n/an/a$730,000$920,500n/a$685,000n/a
Apartment$390,000$322,900$392,200n/a$192,500$307,000$384,500$233,450$389,000$348,000n/an/a$350,000$534,300n/a$294,500
Detached11011157810329994422132225415412672151,158
Attached6443604252132151101673258531487
Apartment16773170226977291812110910836913241,126
Detached$1,049,000$820,000$753,000n/a$504,000$721,500$1,080,000$585,000$862,750$1,155,000$530,000$344,000$954,800$2,400,000$1,928,750n/a
Attached$535,000$449,900n/an/a$312,900n/a$699,000$394,000n/a$551,000n/an/a$699,900$890,000n/a$620,000n/a
Apartment$366,600$300,000n/an/a$202,250$307,000$400,000$240,550n/a$349,000n/an/a$355,000$477,900n/a$260,250
Detached1,1641,142487361,2362681,0644242331,6252344881,3841,44573812712,095
Attached73441383047810838226613990516256390644791945,033
Apartment1,56077617502557228683672181,352109561,2853,77813520011,856
Detached$1,233,500$878,000$840,000$392,500$544,250$811,500$1,285,000$650,000$968,000$1,198,000$650,000$400,000$1,199,000$2,750,000$2,370,000$1,166,500
Attached$530,450$506,000$500,625n/a$318,450$454,400$680,000$418,750$424,800$565,000$418,950$279,500$718,000$921,500$1,085,000$567,500n/a
Apartment$390,000$322,000$359,500n/a$210,136$308,000$407,000$244,961$385,000$350,000$255,000$226,597$375,000$525,000$782,000$269,950
Detached796921421339162429143461861,1391883761,2241,2415611039,607
Attached5343545203326626823516872010531348449511903,903
Apartment1,20952412102405425992371941,00068509842,9451181648,995
Detached$1,000,000$768,000$700,000$370,000$495,000$703,500$1,074,500$568,500$880,000$1,015,000$536,750$374,087$957,000$2,336,500$2,080,000$1,134,500
Attached$517,500$478,800$448,500n/a$302,000$429,900$665,000$389,000$435,000$533,000$360,000$239,950$657,125$865,000$1,128,000$580,000n/a
Apartment$372,000$290,000$332,500n/a$217,000$307,500$380,000$242,000$355,875$350,000$219,700$249,985$346,000$488,000$763,000$247,500
Note:MedianSellingPricesarenotreportedforareaswithlessthan20salesorfortheGulfIslands
Median
Selling
Price
Number
of
Sales
Median
Selling
Price
July
2015
August
2014
Jan.-
Aug.2015
Jan.-
Aug.2014
Median
Selling
Price
Number
of
Sales
Median
Selling
Price
Number
of
Sales
August
2015
Number
of
Sales
Median
Selling
Price
Number
of
Sales
August
2015
Year-to-date
Year-to-date
8222015MLS®
LISTINGSFacts
Burnaby
Coquitlam
Delta-South
Islands-Gulf
MapleRidge/PittMeadows
NewWestminster
NorthVancouver
PortCoquitlam
PortMoody/Belcarra
Richmond
Squamish
SunshineCoast
VancouverEast
VancouverWest
WestVancouver/HoweSound
Whistler/Pemberton
Detached171135543174439747372632989241217122221,744
Attached89788054163038121152275986435653
Apartment242130280441241244429291161120053731331,884
Detached73%77%80%133%87%74%98%113%78%69%83%70%57%68%68%86%
Attached84%74%188%n/a117%69%93%111%133%82%73%57%63%88%100%111%n/a
Apartment89%71%82%n/a57%69%77%93%103%61%56%55%64%98%42%85%
Detached17719070151744510871432974098239280152402,039
Attached9259100992336521412923205887940751
Apartment38015528049131157734332921419268737362,322
Detached86%104%97%47%91%84%107%90%63%73%75%83%62%55%53%40%
Attached126%97%80%n/a75%57%108%81%100%102%78%40%109%87%100%53%n/a
Apartment63%66%71%n/a88%73%82%77%91%57%71%225%91%84%46%81%
Detached13613852141682010351362042382216210101321,586
Attached845660461028371113621836801133603
Apartment24688200401041164629266201016854029291,751
Detached81%80%110%57%61%145%96%86%61%65%96%66%71%60%71%47%
Attached76%77%100%n/a91%50%75%86%136%81%76%88%89%73%45%94%n/a
Apartment68%83%85%n/a55%66%66%63%62%45%50%90%64%68%45%83%
Detached1,6581,477578821,5983401,3825113422,3623038712,0072,3781,47624417,609
Attached9795399316421614513491591,128203925139121042686,594
Apartment2,5101,27022904941,2191,3456203222,536144721,8235,51126530118,661
Detached70%77%84%44%77%79%77%83%68%69%77%56%69%61%50%52%
Attached75%77%89%0%74%67%85%76%87%80%80%61%76%71%76%72%n/a
Apartment62%61%76%n/a52%59%65%59%68%53%76%78%70%69%51%66%
Detached1,5991,4696631211,6253671,3914563292,2623059501,9072,5021,29824217,486
Attached8805088225451194253542091,209158815398671042776,359
Apartment2,1721,06120004781,1411,3625453172,2961101131,7405,47326929417,571
Detached50%63%63%27%56%66%66%76%57%50%62%40%64%50%43%43%
Attached61%70%63%0%61%55%63%66%80%60%66%38%65%52%49%69%n/a
Apartment56%49%61%n/a50%48%44%43%61%44%62%44%57%54%44%56%
*Year-to-datelistingsrepresentacumulativetotaloflistingsratherthantotalactivelistings.
Number
of
Listings
August
2015
Number
of
Listings
%Salesto
Listings
Number
of
Listings
%Salesto
Listings
Number
of
Listings
%Salesto
Listings
July
2015
August
2014
Jan.-
Aug.2015
Jan.-
Aug.2014
%Salesto
Listings
Number
of
Listings
%Salesto
Listings
August
2015
Year-to-date*
Year-to-date*
Listing & Sales Activity Summary
Listings Sales
1 2 3 Col. 2 & 3 5 6 7 Col. 6 & 7 9 10 Col. 9 & 10
Aug Jul Aug Percentage Aug Jul Aug Percentage Jun 2014 - Jun 2015 - Percentage
2014 2015 2015 Variance 2014 2015 2015 Variance Aug 2014 Aug 2015 Variance
BURNABY % % %
DETACHED 136 177 171 -3.4 110 153 124 -19.0 335 454 35.5
ATTACHED 84 92 89 -3.3 64 116 75 -35.3 242 287 18.6
APARTMENTS 246 380 242 -36.3 167 238 215 -9.7 511 697 36.4
COQUITLAM
DETACHED 138 190 135 -28.9 111 198 104 -47.5 378 501 32.5
ATTACHED 56 59 78 32.2 43 57 58 1.8 149 171 14.8
APARTMENTS 88 155 130 -16.1 73 103 92 -10.7 214 325 51.9
DELTA
DETACHED 52 70 54 -22.9 57 68 43 -36.8 190 186 -2.1
ATTACHED 6 10 8 -20.0 6 8 15 87.5 16 32 100.0
APARTMENTS 20 28 28 0.0 17 20 23 15.0 45 69 53.3
MAPLE RIDGE/PITT MEADOWS
DETACHED 168 174 174 0.0 103 159 151 -5.0 395 497 25.8
ATTACHED 46 99 54 -45.5 42 74 63 -14.9 138 208 50.7
APARTMENTS 40 49 44 -10.2 22 43 25 -41.9 87 113 29.9
NORTH VANCOUVER
DETACHED 103 108 97 -10.2 99 116 95 -18.1 346 367 6.1
ATTACHED 28 36 30 -16.7 21 39 28 -28.2 105 128 21.9
APARTMENTS 116 157 124 -21.0 77 128 96 -25.0 246 344 39.8
NEW WESTMINSTER
DETACHED 20 45 43 -4.4 29 38 32 -15.8 109 116 6.4
ATTACHED 10 23 16 -30.4 5 13 11 -15.4 18 37 105.6
APARTMENTS 104 131 124 -5.3 69 95 85 -10.5 223 289 29.6
PORT MOODY/BELCARRA
DETACHED 36 43 37 -14.0 22 27 29 7.4 86 89 3.5
ATTACHED 11 14 12 -14.3 15 14 16 14.3 62 55 -11.3
APARTMENTS 29 43 29 -32.6 18 39 30 -23.1 68 106 55.9
PORT COQUITLAM
DETACHED 51 71 47 -33.8 44 64 53 -17.2 137 195 42.3
ATTACHED 37 52 38 -26.9 32 42 42 0.0 97 118 21.6
APARTMENTS 46 73 44 -39.7 29 56 41 -26.8 103 152 47.6
RICHMOND
DETACHED 204 297 263 -11.4 132 218 181 -17.0 457 637 39.4
ATTACHED 136 129 115 -10.9 110 132 94 -28.8 320 343 7.2
APARTMENTS 266 329 291 -11.6 121 188 178 -5.3 412 556 35.0
SUNSHINE COAST
DETACHED 82 98 89 -9.2 54 81 62 -23.5 176 249 41.5
ATTACHED 8 20 7 -65.0 7 8 4 -50.0 15 20 33.3
APARTMENTS 10 4 11 175.0 9 9 6 -33.3 20 24 20.0
SQUAMISH
DETACHED 23 40 29 -27.5 22 30 24 -20.0 83 96 15.7
ATTACHED 21 23 22 -4.3 16 18 16 -11.1 55 61 10.9
APARTMENTS 20 21 16 -23.8 10 15 9 -40.0 27 42 55.6
VANCOUVER EAST
DETACHED 216 239 241 0.8 154 149 138 -7.4 501 508 1.4
ATTACHED 36 58 59 1.7 32 63 37 -41.3 132 145 9.8
APARTMENTS 168 192 200 4.2 108 175 127 -27.4 390 501 28.5
VANCOUVER WEST
DETACHED 210 280 217 -22.5 126 155 148 -4.5 444 539 21.4
ATTACHED 80 87 86 -1.1 58 76 76 0.0 197 240 21.8
APARTMENTS 540 687 537 -21.8 369 574 526 -8.4 1194 1657 38.8
WHISTLER/PEMBERTON
DETACHED 32 40 22 -45.0 15 16 19 18.8 51 52 2.0
ATTACHED 33 40 35 -12.5 31 21 39 85.7 85 78 -8.2
APARTMENTS 29 36 33 -8.3 24 29 28 -3.4 55 76 38.2
WEST VANCOUVER/HOWE SOUND
DETACHED 101 152 122 -19.7 72 80 83 3.8 235 265 12.8
ATTACHED 11 9 4 -55.6 5 9 4 -55.6 19 26 36.8
APARTMENTS 29 37 31 -16.2 13 17 13 -23.5 51 46 -9.8
GRAND TOTALS
DETACHED 1572 2024 1741 -14.0 1150 1552 1286 -17.1 3923 4751 21.1
ATTACHED 603 751 653 -13.0 487 690 578 -16.2 1650 1949 18.1
APARTMENTS 1751 2322 1884 -18.9 1126 1729 1494 -13.6 3646 4997 37.1
ResidentialAverageSalePrices-January1977toAugust2015
0
200
400
600
800
1000
1200
1400
1600
197719781979198019811982198319841985198619871988198919901991199219931994199519961997199819992000200120022003200420052006200720082009201020112012201320142015
DETACHEDCONDOMINIUMATTACHEDAPARTMENTS
INTHOUSANDS($)
NOTE:From1977-1984condominiumaverageswerenotseparatedintoattached&apartment.
$615,557
$521,666
$1,474,475

More Related Content

Viewers also liked

October 2015 Vancouver Real Estate Board Statistics Package Mike Stewart Realtor
October 2015 Vancouver Real Estate Board Statistics Package Mike Stewart RealtorOctober 2015 Vancouver Real Estate Board Statistics Package Mike Stewart Realtor
October 2015 Vancouver Real Estate Board Statistics Package Mike Stewart RealtorMike Stewart
 
October 2016 REBGV Statistics Package Vancouver BC Mike Stewart Realtor
October 2016 REBGV Statistics Package Vancouver BC Mike Stewart RealtorOctober 2016 REBGV Statistics Package Vancouver BC Mike Stewart Realtor
October 2016 REBGV Statistics Package Vancouver BC Mike Stewart RealtorMike Stewart
 
January 2017 Rebgv Statistics Package Mike Stewart Vancouver Realtor
January 2017 Rebgv Statistics Package Mike Stewart Vancouver RealtorJanuary 2017 Rebgv Statistics Package Mike Stewart Vancouver Realtor
January 2017 Rebgv Statistics Package Mike Stewart Vancouver RealtorMike Stewart
 
REBGV Stats Package June 2016 Mike Stewart Vancouver Realtor
REBGV Stats Package June 2016 Mike Stewart Vancouver RealtorREBGV Stats Package June 2016 Mike Stewart Vancouver Realtor
REBGV Stats Package June 2016 Mike Stewart Vancouver RealtorMike Stewart
 
February 2017 REBGV Statistics Package Mike Stewart Realtor
February 2017 REBGV Statistics Package Mike Stewart RealtorFebruary 2017 REBGV Statistics Package Mike Stewart Realtor
February 2017 REBGV Statistics Package Mike Stewart RealtorMike Stewart
 
December 2016 rebgv statistics package mike stewart vancouver realtor
December 2016 rebgv statistics package mike stewart vancouver realtorDecember 2016 rebgv statistics package mike stewart vancouver realtor
December 2016 rebgv statistics package mike stewart vancouver realtorMike Stewart
 

Viewers also liked (6)

October 2015 Vancouver Real Estate Board Statistics Package Mike Stewart Realtor
October 2015 Vancouver Real Estate Board Statistics Package Mike Stewart RealtorOctober 2015 Vancouver Real Estate Board Statistics Package Mike Stewart Realtor
October 2015 Vancouver Real Estate Board Statistics Package Mike Stewart Realtor
 
October 2016 REBGV Statistics Package Vancouver BC Mike Stewart Realtor
October 2016 REBGV Statistics Package Vancouver BC Mike Stewart RealtorOctober 2016 REBGV Statistics Package Vancouver BC Mike Stewart Realtor
October 2016 REBGV Statistics Package Vancouver BC Mike Stewart Realtor
 
January 2017 Rebgv Statistics Package Mike Stewart Vancouver Realtor
January 2017 Rebgv Statistics Package Mike Stewart Vancouver RealtorJanuary 2017 Rebgv Statistics Package Mike Stewart Vancouver Realtor
January 2017 Rebgv Statistics Package Mike Stewart Vancouver Realtor
 
REBGV Stats Package June 2016 Mike Stewart Vancouver Realtor
REBGV Stats Package June 2016 Mike Stewart Vancouver RealtorREBGV Stats Package June 2016 Mike Stewart Vancouver Realtor
REBGV Stats Package June 2016 Mike Stewart Vancouver Realtor
 
February 2017 REBGV Statistics Package Mike Stewart Realtor
February 2017 REBGV Statistics Package Mike Stewart RealtorFebruary 2017 REBGV Statistics Package Mike Stewart Realtor
February 2017 REBGV Statistics Package Mike Stewart Realtor
 
December 2016 rebgv statistics package mike stewart vancouver realtor
December 2016 rebgv statistics package mike stewart vancouver realtorDecember 2016 rebgv statistics package mike stewart vancouver realtor
December 2016 rebgv statistics package mike stewart vancouver realtor
 

More from Mike Stewart

1_FINTRAC_clientinfo_2021.pdf
1_FINTRAC_clientinfo_2021.pdf1_FINTRAC_clientinfo_2021.pdf
1_FINTRAC_clientinfo_2021.pdfMike Stewart
 
Mike Stewart PREC Listing Contract
Mike Stewart PREC Listing ContractMike Stewart PREC Listing Contract
Mike Stewart PREC Listing ContractMike Stewart
 
November 2017 rebgv stats mike stewart real estate agent
November 2017 rebgv stats mike stewart real estate agentNovember 2017 rebgv stats mike stewart real estate agent
November 2017 rebgv stats mike stewart real estate agentMike Stewart
 
October 2017 REBGV Stats Mike Stewart Vancouver Realtor
October 2017 REBGV Stats Mike Stewart Vancouver RealtorOctober 2017 REBGV Stats Mike Stewart Vancouver Realtor
October 2017 REBGV Stats Mike Stewart Vancouver RealtorMike Stewart
 
September 2017 rebgv statistics package mike stewart realtor
September 2017 rebgv statistics package mike stewart realtorSeptember 2017 rebgv statistics package mike stewart realtor
September 2017 rebgv statistics package mike stewart realtorMike Stewart
 
August 2017 REBGV Stats Mike Stewart Realtor
August 2017 REBGV Stats Mike Stewart RealtorAugust 2017 REBGV Stats Mike Stewart Realtor
August 2017 REBGV Stats Mike Stewart RealtorMike Stewart
 
July 2017 Real Estate Board of Greater Vancouver Stats Package Mike Stewart r...
July 2017 Real Estate Board of Greater Vancouver Stats Package Mike Stewart r...July 2017 Real Estate Board of Greater Vancouver Stats Package Mike Stewart r...
July 2017 Real Estate Board of Greater Vancouver Stats Package Mike Stewart r...Mike Stewart
 
June 2017 REBGV Statistics Package
June 2017 REBGV Statistics PackageJune 2017 REBGV Statistics Package
June 2017 REBGV Statistics PackageMike Stewart
 
May 2017 REBGV Stats
May 2017 REBGV Stats May 2017 REBGV Stats
May 2017 REBGV Stats Mike Stewart
 
April 2017 Real Estate Board of Greater Vancouver Statistics Package with Charts
April 2017 Real Estate Board of Greater Vancouver Statistics Package with ChartsApril 2017 Real Estate Board of Greater Vancouver Statistics Package with Charts
April 2017 Real Estate Board of Greater Vancouver Statistics Package with ChartsMike Stewart
 
March 2017 Rebgv Stats Package Mike Stewart
March 2017 Rebgv Stats Package Mike StewartMarch 2017 Rebgv Stats Package Mike Stewart
March 2017 Rebgv Stats Package Mike StewartMike Stewart
 
15% tax on international buyers in vancouver
15% tax on international buyers in vancouver15% tax on international buyers in vancouver
15% tax on international buyers in vancouverMike Stewart
 
REBGV Stats for December 2011 Courtesy Mike Stewart Vancouver Realtor
REBGV Stats for December 2011 Courtesy Mike Stewart Vancouver RealtorREBGV Stats for December 2011 Courtesy Mike Stewart Vancouver Realtor
REBGV Stats for December 2011 Courtesy Mike Stewart Vancouver RealtorMike Stewart
 
October 2011 REBGV Stats Mike Stewart
October 2011 REBGV Stats Mike StewartOctober 2011 REBGV Stats Mike Stewart
October 2011 REBGV Stats Mike StewartMike Stewart
 
REBGV Stats for Sept 2011 Mike Stewart
REBGV Stats for Sept 2011 Mike StewartREBGV Stats for Sept 2011 Mike Stewart
REBGV Stats for Sept 2011 Mike StewartMike Stewart
 

More from Mike Stewart (15)

1_FINTRAC_clientinfo_2021.pdf
1_FINTRAC_clientinfo_2021.pdf1_FINTRAC_clientinfo_2021.pdf
1_FINTRAC_clientinfo_2021.pdf
 
Mike Stewart PREC Listing Contract
Mike Stewart PREC Listing ContractMike Stewart PREC Listing Contract
Mike Stewart PREC Listing Contract
 
November 2017 rebgv stats mike stewart real estate agent
November 2017 rebgv stats mike stewart real estate agentNovember 2017 rebgv stats mike stewart real estate agent
November 2017 rebgv stats mike stewart real estate agent
 
October 2017 REBGV Stats Mike Stewart Vancouver Realtor
October 2017 REBGV Stats Mike Stewart Vancouver RealtorOctober 2017 REBGV Stats Mike Stewart Vancouver Realtor
October 2017 REBGV Stats Mike Stewart Vancouver Realtor
 
September 2017 rebgv statistics package mike stewart realtor
September 2017 rebgv statistics package mike stewart realtorSeptember 2017 rebgv statistics package mike stewart realtor
September 2017 rebgv statistics package mike stewart realtor
 
August 2017 REBGV Stats Mike Stewart Realtor
August 2017 REBGV Stats Mike Stewart RealtorAugust 2017 REBGV Stats Mike Stewart Realtor
August 2017 REBGV Stats Mike Stewart Realtor
 
July 2017 Real Estate Board of Greater Vancouver Stats Package Mike Stewart r...
July 2017 Real Estate Board of Greater Vancouver Stats Package Mike Stewart r...July 2017 Real Estate Board of Greater Vancouver Stats Package Mike Stewart r...
July 2017 Real Estate Board of Greater Vancouver Stats Package Mike Stewart r...
 
June 2017 REBGV Statistics Package
June 2017 REBGV Statistics PackageJune 2017 REBGV Statistics Package
June 2017 REBGV Statistics Package
 
May 2017 REBGV Stats
May 2017 REBGV Stats May 2017 REBGV Stats
May 2017 REBGV Stats
 
April 2017 Real Estate Board of Greater Vancouver Statistics Package with Charts
April 2017 Real Estate Board of Greater Vancouver Statistics Package with ChartsApril 2017 Real Estate Board of Greater Vancouver Statistics Package with Charts
April 2017 Real Estate Board of Greater Vancouver Statistics Package with Charts
 
March 2017 Rebgv Stats Package Mike Stewart
March 2017 Rebgv Stats Package Mike StewartMarch 2017 Rebgv Stats Package Mike Stewart
March 2017 Rebgv Stats Package Mike Stewart
 
15% tax on international buyers in vancouver
15% tax on international buyers in vancouver15% tax on international buyers in vancouver
15% tax on international buyers in vancouver
 
REBGV Stats for December 2011 Courtesy Mike Stewart Vancouver Realtor
REBGV Stats for December 2011 Courtesy Mike Stewart Vancouver RealtorREBGV Stats for December 2011 Courtesy Mike Stewart Vancouver Realtor
REBGV Stats for December 2011 Courtesy Mike Stewart Vancouver Realtor
 
October 2011 REBGV Stats Mike Stewart
October 2011 REBGV Stats Mike StewartOctober 2011 REBGV Stats Mike Stewart
October 2011 REBGV Stats Mike Stewart
 
REBGV Stats for Sept 2011 Mike Stewart
REBGV Stats for Sept 2011 Mike StewartREBGV Stats for Sept 2011 Mike Stewart
REBGV Stats for Sept 2011 Mike Stewart
 

Recently uploaded

Anandtara Iris Residences Mundhwa Pune Brochure.pdf
Anandtara Iris Residences Mundhwa Pune Brochure.pdfAnandtara Iris Residences Mundhwa Pune Brochure.pdf
Anandtara Iris Residences Mundhwa Pune Brochure.pdfabbu831446
 
Prestige Rainbow Waters Raidurgam, Gachibowli Hyderabad E- Brochure.pdf
Prestige Rainbow Waters Raidurgam, Gachibowli Hyderabad E- Brochure.pdfPrestige Rainbow Waters Raidurgam, Gachibowli Hyderabad E- Brochure.pdf
Prestige Rainbow Waters Raidurgam, Gachibowli Hyderabad E- Brochure.pdffaheemali990101
 
Affordable and Quality Construction SVTN's Signature Blend of Cost-Efficiency...
Affordable and Quality Construction SVTN's Signature Blend of Cost-Efficiency...Affordable and Quality Construction SVTN's Signature Blend of Cost-Efficiency...
Affordable and Quality Construction SVTN's Signature Blend of Cost-Efficiency...AditiAlishetty
 
What Is Biophilic Design .pdf
What Is Biophilic Design            .pdfWhat Is Biophilic Design            .pdf
What Is Biophilic Design .pdfyamunaNMH
 
Listing Turkey - Viva Perla Maltepe Catalog
Listing Turkey - Viva Perla Maltepe CatalogListing Turkey - Viva Perla Maltepe Catalog
Listing Turkey - Viva Perla Maltepe CatalogListing Turkey
 
Experion Elements Sector 45 Noida_Brochure.pdf.pdf
Experion Elements Sector 45 Noida_Brochure.pdf.pdfExperion Elements Sector 45 Noida_Brochure.pdf.pdf
Experion Elements Sector 45 Noida_Brochure.pdf.pdfkratirudram
 
A Brief History of Intangibles in Ad Valorem Taxation.pdf
A Brief History of Intangibles in Ad Valorem Taxation.pdfA Brief History of Intangibles in Ad Valorem Taxation.pdf
A Brief History of Intangibles in Ad Valorem Taxation.pdfTim Wilmath
 
Kumar Fireworks Hadapsar Link Road Pune Brochure.pdf
Kumar Fireworks Hadapsar Link Road Pune Brochure.pdfKumar Fireworks Hadapsar Link Road Pune Brochure.pdf
Kumar Fireworks Hadapsar Link Road Pune Brochure.pdfBabyrudram
 
Dynamic Netsoft A leader In Property management Software
Dynamic Netsoft A leader In Property management SoftwareDynamic Netsoft A leader In Property management Software
Dynamic Netsoft A leader In Property management SoftwareDynamic Netsoft
 
Brigade Neopolis Kokapet, Hyderabad E- Brochure
Brigade Neopolis Kokapet, Hyderabad E- BrochureBrigade Neopolis Kokapet, Hyderabad E- Brochure
Brigade Neopolis Kokapet, Hyderabad E- Brochurefaheemali990101
 
Ajmera Prive at Juhu, Mumbai E-Brochure.pdf
Ajmera Prive at Juhu, Mumbai  E-Brochure.pdfAjmera Prive at Juhu, Mumbai  E-Brochure.pdf
Ajmera Prive at Juhu, Mumbai E-Brochure.pdfManishSaxena95
 
Provident Solitaire Park Square Kanakapura Road, Bangalore E- Brochure.pdf
Provident Solitaire Park Square Kanakapura Road, Bangalore E- Brochure.pdfProvident Solitaire Park Square Kanakapura Road, Bangalore E- Brochure.pdf
Provident Solitaire Park Square Kanakapura Road, Bangalore E- Brochure.pdffaheemali990101
 
Pride Wonderland Dhanori Pune Brochure.pdf
Pride Wonderland Dhanori Pune Brochure.pdfPride Wonderland Dhanori Pune Brochure.pdf
Pride Wonderland Dhanori Pune Brochure.pdfabbu831446
 
Ryan Mahoney - How Property Technology Is Altering the Real Estate Market
Ryan Mahoney - How Property Technology Is Altering the Real Estate MarketRyan Mahoney - How Property Technology Is Altering the Real Estate Market
Ryan Mahoney - How Property Technology Is Altering the Real Estate MarketRyan Mahoney
 
Prestige Somerville Whitefield Bangalore E- Brochure.pdf
Prestige Somerville Whitefield Bangalore E- Brochure.pdfPrestige Somerville Whitefield Bangalore E- Brochure.pdf
Prestige Somerville Whitefield Bangalore E- Brochure.pdffaheemali990101
 
Everything you ever Wanted to Know about Florida Property Tax Exemptions.pdf
Everything you ever Wanted to Know about Florida Property Tax Exemptions.pdfEverything you ever Wanted to Know about Florida Property Tax Exemptions.pdf
Everything you ever Wanted to Know about Florida Property Tax Exemptions.pdfTim Wilmath
 
Shapoorji Pallonji Vanaha GolfLand 2 | A Space For You To Find Your Space
Shapoorji Pallonji Vanaha GolfLand 2 | A Space For You To Find Your SpaceShapoorji Pallonji Vanaha GolfLand 2 | A Space For You To Find Your Space
Shapoorji Pallonji Vanaha GolfLand 2 | A Space For You To Find Your Spaceaidasheikh47
 
Maha Mauka Squarefeet Brochure |Maha Mauka Squarefeet PDF Brochure|
Maha Mauka Squarefeet Brochure |Maha Mauka Squarefeet PDF Brochure|Maha Mauka Squarefeet Brochure |Maha Mauka Squarefeet PDF Brochure|
Maha Mauka Squarefeet Brochure |Maha Mauka Squarefeet PDF Brochure|AkshayJoshi575980
 
LCAR Unit 22 - Leasing and Property Management - 14th Edition Revised.pptx
LCAR Unit 22 - Leasing and Property Management - 14th Edition Revised.pptxLCAR Unit 22 - Leasing and Property Management - 14th Edition Revised.pptx
LCAR Unit 22 - Leasing and Property Management - 14th Edition Revised.pptxTom Blefko
 
Namrata 7 Plumeria Drive Pimpri Chinchwad Pune Brochure.pdf
Namrata 7 Plumeria Drive Pimpri Chinchwad Pune Brochure.pdfNamrata 7 Plumeria Drive Pimpri Chinchwad Pune Brochure.pdf
Namrata 7 Plumeria Drive Pimpri Chinchwad Pune Brochure.pdfPrachiRudram
 

Recently uploaded (20)

Anandtara Iris Residences Mundhwa Pune Brochure.pdf
Anandtara Iris Residences Mundhwa Pune Brochure.pdfAnandtara Iris Residences Mundhwa Pune Brochure.pdf
Anandtara Iris Residences Mundhwa Pune Brochure.pdf
 
Prestige Rainbow Waters Raidurgam, Gachibowli Hyderabad E- Brochure.pdf
Prestige Rainbow Waters Raidurgam, Gachibowli Hyderabad E- Brochure.pdfPrestige Rainbow Waters Raidurgam, Gachibowli Hyderabad E- Brochure.pdf
Prestige Rainbow Waters Raidurgam, Gachibowli Hyderabad E- Brochure.pdf
 
Affordable and Quality Construction SVTN's Signature Blend of Cost-Efficiency...
Affordable and Quality Construction SVTN's Signature Blend of Cost-Efficiency...Affordable and Quality Construction SVTN's Signature Blend of Cost-Efficiency...
Affordable and Quality Construction SVTN's Signature Blend of Cost-Efficiency...
 
What Is Biophilic Design .pdf
What Is Biophilic Design            .pdfWhat Is Biophilic Design            .pdf
What Is Biophilic Design .pdf
 
Listing Turkey - Viva Perla Maltepe Catalog
Listing Turkey - Viva Perla Maltepe CatalogListing Turkey - Viva Perla Maltepe Catalog
Listing Turkey - Viva Perla Maltepe Catalog
 
Experion Elements Sector 45 Noida_Brochure.pdf.pdf
Experion Elements Sector 45 Noida_Brochure.pdf.pdfExperion Elements Sector 45 Noida_Brochure.pdf.pdf
Experion Elements Sector 45 Noida_Brochure.pdf.pdf
 
A Brief History of Intangibles in Ad Valorem Taxation.pdf
A Brief History of Intangibles in Ad Valorem Taxation.pdfA Brief History of Intangibles in Ad Valorem Taxation.pdf
A Brief History of Intangibles in Ad Valorem Taxation.pdf
 
Kumar Fireworks Hadapsar Link Road Pune Brochure.pdf
Kumar Fireworks Hadapsar Link Road Pune Brochure.pdfKumar Fireworks Hadapsar Link Road Pune Brochure.pdf
Kumar Fireworks Hadapsar Link Road Pune Brochure.pdf
 
Dynamic Netsoft A leader In Property management Software
Dynamic Netsoft A leader In Property management SoftwareDynamic Netsoft A leader In Property management Software
Dynamic Netsoft A leader In Property management Software
 
Brigade Neopolis Kokapet, Hyderabad E- Brochure
Brigade Neopolis Kokapet, Hyderabad E- BrochureBrigade Neopolis Kokapet, Hyderabad E- Brochure
Brigade Neopolis Kokapet, Hyderabad E- Brochure
 
Ajmera Prive at Juhu, Mumbai E-Brochure.pdf
Ajmera Prive at Juhu, Mumbai  E-Brochure.pdfAjmera Prive at Juhu, Mumbai  E-Brochure.pdf
Ajmera Prive at Juhu, Mumbai E-Brochure.pdf
 
Provident Solitaire Park Square Kanakapura Road, Bangalore E- Brochure.pdf
Provident Solitaire Park Square Kanakapura Road, Bangalore E- Brochure.pdfProvident Solitaire Park Square Kanakapura Road, Bangalore E- Brochure.pdf
Provident Solitaire Park Square Kanakapura Road, Bangalore E- Brochure.pdf
 
Pride Wonderland Dhanori Pune Brochure.pdf
Pride Wonderland Dhanori Pune Brochure.pdfPride Wonderland Dhanori Pune Brochure.pdf
Pride Wonderland Dhanori Pune Brochure.pdf
 
Ryan Mahoney - How Property Technology Is Altering the Real Estate Market
Ryan Mahoney - How Property Technology Is Altering the Real Estate MarketRyan Mahoney - How Property Technology Is Altering the Real Estate Market
Ryan Mahoney - How Property Technology Is Altering the Real Estate Market
 
Prestige Somerville Whitefield Bangalore E- Brochure.pdf
Prestige Somerville Whitefield Bangalore E- Brochure.pdfPrestige Somerville Whitefield Bangalore E- Brochure.pdf
Prestige Somerville Whitefield Bangalore E- Brochure.pdf
 
Everything you ever Wanted to Know about Florida Property Tax Exemptions.pdf
Everything you ever Wanted to Know about Florida Property Tax Exemptions.pdfEverything you ever Wanted to Know about Florida Property Tax Exemptions.pdf
Everything you ever Wanted to Know about Florida Property Tax Exemptions.pdf
 
Shapoorji Pallonji Vanaha GolfLand 2 | A Space For You To Find Your Space
Shapoorji Pallonji Vanaha GolfLand 2 | A Space For You To Find Your SpaceShapoorji Pallonji Vanaha GolfLand 2 | A Space For You To Find Your Space
Shapoorji Pallonji Vanaha GolfLand 2 | A Space For You To Find Your Space
 
Maha Mauka Squarefeet Brochure |Maha Mauka Squarefeet PDF Brochure|
Maha Mauka Squarefeet Brochure |Maha Mauka Squarefeet PDF Brochure|Maha Mauka Squarefeet Brochure |Maha Mauka Squarefeet PDF Brochure|
Maha Mauka Squarefeet Brochure |Maha Mauka Squarefeet PDF Brochure|
 
LCAR Unit 22 - Leasing and Property Management - 14th Edition Revised.pptx
LCAR Unit 22 - Leasing and Property Management - 14th Edition Revised.pptxLCAR Unit 22 - Leasing and Property Management - 14th Edition Revised.pptx
LCAR Unit 22 - Leasing and Property Management - 14th Edition Revised.pptx
 
Namrata 7 Plumeria Drive Pimpri Chinchwad Pune Brochure.pdf
Namrata 7 Plumeria Drive Pimpri Chinchwad Pune Brochure.pdfNamrata 7 Plumeria Drive Pimpri Chinchwad Pune Brochure.pdf
Namrata 7 Plumeria Drive Pimpri Chinchwad Pune Brochure.pdf
 

August 2015 rebgv statistics package mike stewart