
Recommended
More Related Content
Viewers also liked
Viewers also liked (8)
Recently uploaded
Recently uploaded (20)
Working Poor and Low Salaries in Spain
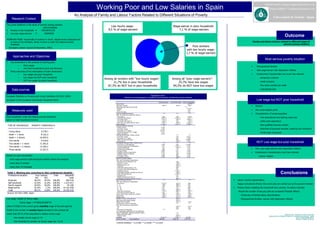
- 1. Isabel García-Espejo (igarcia@uniovi.es) Working Poor and Low Salaries in Spain Marta Ibáñez * (mibanez@uniovi.es) An Analysis of Family and Labour Factors Related to Different Situations of Poverty Research Context Universidad de Oviedo - Spain Two great traditions in the study of poverty among workers unit of analysis Low hourly wage: Wage-earner in poor household: • Poverty in the household HOUSEHOLDS 9,5 % of wage-earners 7,1 % of wage-earners • Low-pay wage-earners WORKERS Outcome WORKING POOR: households of workers in which, despite being employed one or some of its members, family income is under the relative poverty Family and labour factors related to different types of threshold poverty among workers: (European Laeken Council of December, 2001) Poor workers with low hourly wage: 1,7 % of wage-earners Approaches and Objectives Most serious poverty situation • Two dimensions in the analysis of working poor: – their wages • Monoparental families – and their household income and structure • Sole wage-earner with dependent children • Three outcomes of the interrelation of both dimensions: – low wages and poor household • Employment characteristics are much less relevant – low wages but NOT poor household –temporary contract Among all workers with “low hourly wages’: Among all “poor wage-earners”: – NOT low wages but poor household –small company 21,7% live in poor households 25,7% have low wages 87,3% do NOT live in poor households 84,3% do NOT have low wages –few hours worked per week Data sources –subordinate jobs European Statistics on Income and Living Conditions (EU-SILC-2004) Regression LOGIT. Relation of sociodemographic, occupational and household variables with poverty situations successor of the European Community Household Panel Low wage but NOT poor household Serious poverty Low hourly wa ge Poor by household Year of birth -, 027*** Man (Ref. woman) -,305*** -, 635*** , 146** • Women Nationality (Ref. Rest of the world) *** - Spanish -1, 114*** Measures used - EU24 , 253 • Non-emancipated youth - Rest of Europe , 516 Type of household structure *** *** *** • Characteristics of employees/jobs: (Ref. More than two adults with minor/s) Poor household: under the relative poverty threshold - Living alone - O ne a dult with minor/s ,369 1,991*** , 246 -2, 431*** , 616** 1, 337*** –Few educational and training resources (given as total household income) - Two a dults alone -,877*** , 556*** -1, 062*** - Two a dults with minor/s -,534*** , 154 , 375*** –Little work experience - More than two adults without minors -,987*** , 950*** -1, 220*** Work intensity -3,184*** 1, 017*** -5, 448*** TYPE OF HOUSEHOLD POVERTY THRESHOLD € Study ing (Ref Not study ing) *** –Non-qualified manual workers - Primary school 3,444 - Secondary school 3,345 –Branches of personal services, cleaning and commerce - Secondary of 2nd sta ge -15,437 - Living alone 6.278,7 - Technica l educa tion of 2nd stage 5,221 - Higher educa tion 2,018 –Small-scale companies - Adult + 1 minor 8.162,3 Educational level (Ref. Primary school) *** *** - Secondary school -, 124 3, 971 - Adult + 2 minors 10.045,9 - Secondary of 2nd sta ge -, 193 3, 584 - Higher technical education , 863 -14, 803 - Two adults 9.418,0 - Univ ersity etc. -, 748*** 3, 257 - Two adults + 1 minor 11.301,6 Occupational category (Ref. Armed Forces) *** *** ** NOT Low wage but poor household - Executives y businesspeople 1,260 -, 030 -15, 526 - Technica l experts and Professiona ls -,351 -1, 567*** 1, 222 - Two adults + 2 minors 13.185,2 - Technica l assistants ,611 -, 709*** 1, 571 - Administra tive employees ,388 -, 177 1, 791 • Men, sole wage-earners with dependent children - Three adults 12.557,4 - Service workers 2,066 , 217 1, 963 - Q ualified workers in agriculture 2,541 , 423 2, 233 • Employment characteristics much less relevant - Q ualified workers in industry 1,776 , 166 2, 208 Worker (in poor household): - O perators, fitters 1,989 -, 082 2, 119 –Labour rotation - Unqualified workers 2,398 , 598*** 2, 033 Branch of activity (NACE) *** –only wage-earners (self-employed workers distort the analysis) (Ref. don’t knows/non-respondents) - Agriculture and Fisheries (a +b) , 186 –more than 6 months - Industry (c+d+e) , 328** - Building industry (f) -, 635*** - Tra de (g) , 527*** –more than 14 hrs/week - Hotel a nd ca tering industry (h) -, 058 - Tra nsport and commun ications (i) , 251 - F inancial sector (j) -1, 216** Table 1. Working poor according to their professional situatión Professional situation Poor workers Total Weighted - Rea l-estate a ctivities; business services (k) - Public Administra tion (l) - Educa tion (m) , 386** -1, 032*** , 133 Conclusions - Hea lth and Social services (n) , 275 NO YES total - Personal a nd cleaning services (o+ p+ q) , 897*** Employer 69,5% 30,5% 100,0% 692.516 Size of the place of work *** *** *** • Labour market segmentation. (Ref. don’t knows/non-respondents) Self-employed 67,6% 32,4% 100,0% 1.673.917 - O ne person 1,101*** , 612*** , 046 Happy coincidence (Piore): the worst jobs are carried out by the poorest families Family support 64,0% 36,0% 100,0% 64.160 -2 -5 ,403** , 689*** , 055 - 6 - 10 ,188 , 295*** , 156 Wage-earner 92,9% 7,1% 100,0% 14.161.950 - 11 - 19 -,211 -, 135 -, 050 • Primary factor shielding the household from poverty: its labour intensity - 20 - 49 -,108 -, 686*** , 029 Total 89,2% 10,8% 100,0% 16.592.543 - more than 49 persons - don’t know but more tha n 10 -,741*** -,402 -, 640*** -, 310 -, 470*** , 345 Should the number of low-pay jobs be increased? Possible effects: Source: EU-SILC-2004. Spain Fixed contract (Ref. temporary contract) -,444*** -, 185*** -, 190*** Supervising -,338** -, 313*** -, 185** –Continuity of female labour discrimination Weekly hours ,056*** , 073*** -, 054*** Low wage: height of hourly wage Number of years with paid work -, 055*** –Monoparental families, women with dependent children Age when s/he started working -, 047*** Months NOT occupied , 153*** -, 131** hourly wage = PY200G/(PL060*4) Change jobs in year of reference *** *** (Ref. don’t knows/non-respondents) where PY200G is the current gross monthly wage of the principal job - Yes -, 502*** , 617** - No -, 078 , 150 Autonomous Commun ities *** *** *** PL060 is the number of weekly hours devoted to this pricipal job (corresponding coefficients a re not reflected) Size of habitat (Ref. Sparsely populated region) *** Lower than 60 % of the population’s median hourly wage - Highly populated region -, 119 Working Poor: employment and households - Medium region , 302*** National Plan on R&D&I, Ministry of Education and Science - Spain –the median hourly wage is 7 € Constant -8,411*** -5, 267*** 50, 658 (Ref. SEJ2005-6485/SOCI) TOTAL N=9482 -2 Log Likelihood -585,894 -1826, 745 -1451, 701 Director: Rodolfo Gutiérrez –the threshold to consider an hourly wage low: 4,2 € Contrast Deviation. * p<0,100; ** p<0,050; *** p<0,010