SlideShare a Scribd company logo
1 of 17
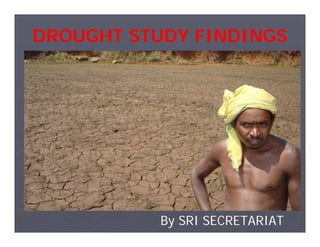
DROUGHT STUDY FINDINGS


           By SRI SECRETARIAT
Paddy Area of India
0
                                10
                                     20
                                               30
                                                              40
                                                                        50
                                                                                  60
 Jh
       a rk
              ha
                   nd


                                          21
Ma
       ha
            ra
                 str
                    a


                                               25
we
      st
           be
                ng
                     al
                                                                                       Respondents


                                           24
           Or
                 is s
                        a
                                                                   40


Ch
     ha
           ti s
                ga
                   r   h
                                                                             51


       Ma
              ni p
                     ur
                                                                             50


Ut
     ta r
         ak
              ha
                   nd
                                                         30
                                               Farmers
RAIN FALL PATTERN ( IN mm)
1400
                            1240                                                1290
1200           1167
               1164                                                1223
                                          1092         1136
1000                                                   973
                            882                                    864
 800                                      796                                   796
 600
 400                                                                                  Normal ( Kh)
 200                                                                                  Kharif-09
   0
        s sa


                                   an d
                       ur


                                                              nd
                                                 al


                                                                          rha
                      nip


                                                en g
       O ri


                                                          kha
                                  rkh


                                                                      hga
                 Ma


                                           st B


                                                        ara
                             Jh a


                                                                    a ti s
                                          We


                                                       U tt


                                                                   Chh
Stages of the crop affected


C
M   S
P   R
    I
INCIDENCE OF DISEASE PEST
Comparative study of plant height
                                 150.00
    P la n t H e ig h t in c m


                                 100.00


                                  50.00


                                   0.00
                                          Uttara Manip Chhati Oriss West- Mahar Jhark Avera
                                          khand ur sgarh a Benga astra hand ge

                                   SRI 104.27 117       62   104 131.3 88.3      92   97.89
                                   CMP 98.87 105        57   99.3 112.4 74.5     92   89.57
Comparative analysis of
                                   No of Tillers/Sq M
                       700.00

                       600.00

                       500.00
No. of tillers/Sq Mt


                       400.00

                       300.00

                       200.00

                       100.00

                         0.00
                                Uttarakhan           Chhatisgar            West-    Maharastr
                                           Manipur                Orissa                      Jharkhand Average
                                     d                   h                 Bengal      a

                         SRI     401.27      417        221        490      388       508       501     399.55
                         CMP     265.53      358        161       419.4     241       635       393     335.12
Comparative analysis of
No of Productive Tillers/Sq M
                                                 600.00
N o . o f p r o d u c tiv e tille r s /S q m t


                                                 500.00
                                                 400.00
                                                 300.00
                                                 200.00
                                                 100.00
                                                   0.00
                                                          Uttarakh         Chhatis        West- Mahara Jharkha Averag
                                                                   Manipur         Orissa
                                                            and             garh          Bengal stra    nd      e

                                                   SRI    350.43   376    195    435.6   327     371    430    343.71
                                                   CMP 229.00      369    141    401.4   208     545    311    305.87
Comparative study of panicle length
                              30.00

                              25.00
   Length of panicle in C M


                              20.00

                              15.00

                              10.00

                               5.00

                               0.00
                                      Uttarakh         Chhatis          West- Mahara Jharkha Averag
                                               Manipur         Orissa
                                        and             garh            Bengal stra    nd      e

                               SRI     23.73    22       20     22.9    25.6    19.6    26    22.40
                               CMP     19.90    20       18     20.3    21.8    16.7    21    19.54
No of Filled Grains in a panicle
                                 300.00
                                 250.00
N o o f fi l l e d g r a i n s


                                 200.00
                                 150.00
                                 100.00
                                  50.00
                                   0.00
                                                                                     West-
                                          Uttarakhand Manipur Chhatisgarh   Orissa            Maharastra Jharkhand   Average
                                                                                     Bengal

                                    SRI     146.00      220       209        176      266        107        198      192.10
                                    CMP     109.43      169       147        154      181        78         197      148.63
N o o f c h a ffy g r a i n


                             0
                            10
                            20
                            30
                            40
                            50
                            60
                            70
                            80
                            90
Utt
      a ra
             k ha
                    nd
        Ma
               n ip
                      ur
Ch
      hat
             isg
                    a rh

             O ri
                    s sa
We
     st -B
             eng
                     al
 Ma
       ha
             ra s
                     tr a
  J ha
         rk h
                an
                       d
        Av
              er a
                     ge
                                                          Comparative study of no of chaffy grain


                                           SRI
                                     CMP
Comparative study of grain yield
                                      100.00
   G ra in Y ie ld in Q n t ls /H a


                                       80.00

                                       60.00

                                       40.00

                                       20.00

                                        0.00
                                               Uttarakh         Chhatisg        West- Maharas Jharkha
                                                        Manipur          Orissa                       Average
                                                 and              arh           Bengal  tra     nd

                                        SRI     43.97    65      92     57.6    82     69.36   82.6    70.55
                                        CMP 26.10        47      41    45.48    54     58.56   59.5    45.86
Comparative study of straw yield
                                         120.00
 S tr a w y i e l d i n Q n tl s / H a


                                         100.00

                                          80.00

                                          60.00

                                          40.00

                                          20.00

                                           0.00
                                                                                              West-
                                                  Uttarakhand M anipur Chhatisgarh   Orissa            M aharastra Jharkhand   Average
                                                                                              Bengal
                                           SRI       67.17      83         57         105       113      82.72       0.00       82.05
                                           CM P     46.67        61        45         81.8     76.6      70.48       0.00       57.28
Inspite of Drought
Thank U

More Related Content

Viewers also liked

Viewers also liked (7)

презентация2антитеррор
презентация2антитеррорпрезентация2антитеррор
презентация2антитеррор
 
VINITA PINTO - RESUME
VINITA PINTO - RESUMEVINITA PINTO - RESUME
VINITA PINTO - RESUME
 
Annual Report
Annual ReportAnnual Report
Annual Report
 
Theoryoffun
TheoryoffunTheoryoffun
Theoryoffun
 
Pilingbargenew 130607235913-phpapp02
Pilingbargenew 130607235913-phpapp02Pilingbargenew 130607235913-phpapp02
Pilingbargenew 130607235913-phpapp02
 
SCI by Pradan bihar
SCI by Pradan biharSCI by Pradan bihar
SCI by Pradan bihar
 
GPSS
GPSSGPSS
GPSS
 

More from livolinkfoundation

More from livolinkfoundation (20)

Conservation agriculture and SRI
Conservation agriculture and SRIConservation agriculture and SRI
Conservation agriculture and SRI
 
SCI by PSI uttarakhand
SCI by PSI uttarakhandSCI by PSI uttarakhand
SCI by PSI uttarakhand
 
DOA government of bihar
DOA government of biharDOA government of bihar
DOA government of bihar
 
sri secretariat, livolink foundation
sri secretariat, livolink foundationsri secretariat, livolink foundation
sri secretariat, livolink foundation
 
Third national symposium on sri
Third national symposium on sriThird national symposium on sri
Third national symposium on sri
 
Second national symposium on sri
Second national symposium on sriSecond national symposium on sri
Second national symposium on sri
 
About sri
About sriAbout sri
About sri
 
Journey of sdtt in sri
Journey of sdtt in sriJourney of sdtt in sri
Journey of sdtt in sri
 
Sri timeline updated
Sri timeline updatedSri timeline updated
Sri timeline updated
 
Updated info for sdtt sri map
Updated info for sdtt sri mapUpdated info for sdtt sri map
Updated info for sdtt sri map
 
One step towards SRI -a document in hindi developed by SPWD
One step towards SRI -a document in hindi developed by SPWDOne step towards SRI -a document in hindi developed by SPWD
One step towards SRI -a document in hindi developed by SPWD
 
SDTT CSO collaboration in chhattisgarh for promotion of sri among small farmers
SDTT CSO collaboration in chhattisgarh for promotion of sri among small farmersSDTT CSO collaboration in chhattisgarh for promotion of sri among small farmers
SDTT CSO collaboration in chhattisgarh for promotion of sri among small farmers
 
Innovative technologies in agriculture and rural development
Innovative technologies in agriculture and rural developmentInnovative technologies in agriculture and rural development
Innovative technologies in agriculture and rural development
 
Idpm manual
Idpm manualIdpm manual
Idpm manual
 
DBI SUB GROUP II
DBI SUB GROUP IIDBI SUB GROUP II
DBI SUB GROUP II
 
GROUP 1
GROUP 1GROUP 1
GROUP 1
 
DBI MEET SUB GPRS
DBI MEET SUB GPRSDBI MEET SUB GPRS
DBI MEET SUB GPRS
 
Madhyam
MadhyamMadhyam
Madhyam
 
Yuva Mitra
Yuva MitraYuva Mitra
Yuva Mitra
 
MITRA BAIF
MITRA BAIFMITRA BAIF
MITRA BAIF
 

DROUGHT STUDY FINDS SRI METHOD INCREASES YIELD

  • 1. DROUGHT STUDY FINDINGS By SRI SECRETARIAT
  • 2.
  • 4. 0 10 20 30 40 50 60 Jh a rk ha nd 21 Ma ha ra str a 25 we st be ng al Respondents 24 Or is s a 40 Ch ha ti s ga r h 51 Ma ni p ur 50 Ut ta r ak ha nd 30 Farmers
  • 5. RAIN FALL PATTERN ( IN mm) 1400 1240 1290 1200 1167 1164 1223 1092 1136 1000 973 882 864 800 796 796 600 400 Normal ( Kh) 200 Kharif-09 0 s sa an d ur nd al rha nip en g O ri kha rkh hga Ma st B ara Jh a a ti s We U tt Chh
  • 6. Stages of the crop affected C M S P R I
  • 8. Comparative study of plant height 150.00 P la n t H e ig h t in c m 100.00 50.00 0.00 Uttara Manip Chhati Oriss West- Mahar Jhark Avera khand ur sgarh a Benga astra hand ge SRI 104.27 117 62 104 131.3 88.3 92 97.89 CMP 98.87 105 57 99.3 112.4 74.5 92 89.57
  • 9. Comparative analysis of No of Tillers/Sq M 700.00 600.00 500.00 No. of tillers/Sq Mt 400.00 300.00 200.00 100.00 0.00 Uttarakhan Chhatisgar West- Maharastr Manipur Orissa Jharkhand Average d h Bengal a SRI 401.27 417 221 490 388 508 501 399.55 CMP 265.53 358 161 419.4 241 635 393 335.12
  • 10. Comparative analysis of No of Productive Tillers/Sq M 600.00 N o . o f p r o d u c tiv e tille r s /S q m t 500.00 400.00 300.00 200.00 100.00 0.00 Uttarakh Chhatis West- Mahara Jharkha Averag Manipur Orissa and garh Bengal stra nd e SRI 350.43 376 195 435.6 327 371 430 343.71 CMP 229.00 369 141 401.4 208 545 311 305.87
  • 11. Comparative study of panicle length 30.00 25.00 Length of panicle in C M 20.00 15.00 10.00 5.00 0.00 Uttarakh Chhatis West- Mahara Jharkha Averag Manipur Orissa and garh Bengal stra nd e SRI 23.73 22 20 22.9 25.6 19.6 26 22.40 CMP 19.90 20 18 20.3 21.8 16.7 21 19.54
  • 12. No of Filled Grains in a panicle 300.00 250.00 N o o f fi l l e d g r a i n s 200.00 150.00 100.00 50.00 0.00 West- Uttarakhand Manipur Chhatisgarh Orissa Maharastra Jharkhand Average Bengal SRI 146.00 220 209 176 266 107 198 192.10 CMP 109.43 169 147 154 181 78 197 148.63
  • 13. N o o f c h a ffy g r a i n 0 10 20 30 40 50 60 70 80 90 Utt a ra k ha nd Ma n ip ur Ch hat isg a rh O ri s sa We st -B eng al Ma ha ra s tr a J ha rk h an d Av er a ge Comparative study of no of chaffy grain SRI CMP
  • 14. Comparative study of grain yield 100.00 G ra in Y ie ld in Q n t ls /H a 80.00 60.00 40.00 20.00 0.00 Uttarakh Chhatisg West- Maharas Jharkha Manipur Orissa Average and arh Bengal tra nd SRI 43.97 65 92 57.6 82 69.36 82.6 70.55 CMP 26.10 47 41 45.48 54 58.56 59.5 45.86
  • 15. Comparative study of straw yield 120.00 S tr a w y i e l d i n Q n tl s / H a 100.00 80.00 60.00 40.00 20.00 0.00 West- Uttarakhand M anipur Chhatisgarh Orissa M aharastra Jharkhand Average Bengal SRI 67.17 83 57 105 113 82.72 0.00 82.05 CM P 46.67 61 45 81.8 76.6 70.48 0.00 57.28