1. The current issue and full text archive of this journal is available at
www.emeraldinsight.com/1463-5771.htm
Using ISM
Analysis of interaction among approach
the barriers to total quality
management implementation
563
using interpretive structural
modeling approach
Faisal Talib
Mechanical Engineering Section, Faculty of Engineering and Technology,
University Polytechnic, Aligarh Muslim University, Aligarh, India
Zillur Rahman
Department of Management Studies,
Indian Institute of Technology, Roorkee, India, and
M.N. Qureshi
Department of Mechanical Engineering, Faculty of Engineering and Technology,
M S University of Baroda, Vadodara, India
Abstract
Purpose – Previous research showed that there are some barriers which hinder the implementation
of total quality management (TQM) in organizations. But no study has been undertaken to understand
the interaction among these barriers and to develop a hierarchy of TQM barriers model. There is an
urgent need to analyze the behavior of these barriers so that TQM may be successfully implemented.
This paper therefore, aims to understand the mutual interaction of these barriers and identify the
“driving barriers” (i.e. which influence the other barriers) and the “dependent barriers” (i.e. which are
influenced by others).
Design/methodology/approach – In this paper, an interpretive structural modeling (ISM) based
approach has been utilized to understand the mutual influences among the barriers of TQM.
Findings – In the present research work, 12 TQM barriers are identified through the literature review
and expert opinion. The research shows that there exist two groups of barriers, one having high
driving power and low dependency requiring maximum attention and of strategic importance
(such as lack of top-management commitment, lack of coordination between departments) and the
other having high dependence and low driving power and are resultant effects (such as high turnover
at management level, lack of continuous improvement culture, employees’ resistance to change).
Practical implications – The adoption of such an ISM-based model on TQM barriers in service
organizations would help managers, decision makers, and practitioners of TQM in better
understanding of these barriers and to focus on major barriers while implementing TQM in their
organizations.
Originality/value – Presentation of TQM barriers in the form of an ISM-based model and the
categorization into driver and dependent clusters is a new effort in the area of TQM.
Keywords Total quality management, Interpretive structural modeling, Barriers, Service organization, Benchmarking: An International
Managers, Modeling Journal
Vol. 18 No. 4, 2011
Paper type Research paper pp. 563-587
q Emerald Group Publishing Limited
1463-5771
DOI 10.1108/14635771111147641
2. BIJ Introduction
18,4 In the era of economic liberalization and increased competition with the emergence of
new products and improved services as well as fast growth in customer needs and
expectations for quality service, the service organization face tremendous competition
and are under immense pressure to become more responsive to customer needs and gain
an upper edge. There are demands for improvement in the quality of products and
564 services, transparency in policies and procedures, increased emphasis on pre and post
product and service delivery procedures, and cost of quality. Service organizations must
improve the quality of their services, achieve competitive advantage, and move on a path
of growth and excellence. A customer centric philosophy of management needs to be all
encompassing throughout the organization with an ultimate objective being customer
satisfaction.
In order to achieve and accomplish the above aspects of customer, service
organizations are making use of well-known quality approaches like ISO 9000, total
quality management (TQM), Six Sigma, 5S, quality function deployment, and continuous
quality improvement (CQI) programs which have helped them in achieving their goals.
One of the important quality improvement techniques, which many organizations are
using to achieve excellence in business, is TQM. TQM has been widely accepted as a
disciplined management process in different sector in order to cope with the changes in
marketplace and focus on quality in both their products as well as services (Venkatraman,
2007). Though TQM was considered and used mainly by manufacturing industry, there
has been a strong push for adopting TQM in service organizations (Kureshi et al., 2010;
Kaluarachchi, 2010; Eraqi, 2006; Telford and Masson, 2005; Srikanthan and Dalrymple,
2004). Implementation of TQM has given them positive results, particularly towards
achieving enhanced organization performance and customer satisfaction. It is understood
that the goals of TQM are to satisfy customers, prevent poor quality rather than
correcting problems, develop an attitude of continuous improvement, understand the
value of measuring performance to identify opportunities and maintain improvements,
and to eliminate chronic sources of inefficiencies and costs (Evans and Lindsay, 1996;
Burr, 1993; Mosadegh Rad, 2005). These goals could be achieved if there is a total
commitment by entire organization (including top-management and employees) as well
as principles of TQM are fully understood by them.
Moreover, TQM is the culture of an organization committed to total customer
satisfaction through continuous improvement (Mosadegh Rad, 2005; Gunasekaran
and McGaughey, 2003). TQM demands change in organization culture for improved
performance (Kaluarachchi, 2010). TQM also demands constancy of purpose throughout
the organization, and persistence in accordance with a clear and widely understood
vision. It is an environment that requires and nurtures total commitment at all levels of
the organization by providing potential benefits such as customer satisfaction, increased
productivity and profit, enhanced business competitiveness, and increased market share
(Gunasekaran, 1999; Mosadegh Rad, 2004). TQM has enjoyed great popularity in all
sectors since its evaluation and is adopted into their regular management activities
(Hansson and Eriksson, 2002; Gunasekaran, 1999). Recently, Ho (2010) has proposed an
“integrated lean TQM model for global sustainability and competitiveness” to help
organizations to reduce global resource wasting and improve the damages caused by the
financial tsunami. Study by Leonard (2010) suggested that quality management
systems and quality award criteria are also making an impact in homebuilding industry.
3. Further, the application of world class manufacturing techniques like TQM, JIT, lean Using ISM
manufacturing in small and medium enterprises (SMEs) enhance the productivity and
quality of these industries (Gunasekaran, 2000).
approach
Further, studies showed that TQM was positively associated with performance
outcome such as financial performance, business performance, and profitability
(Brah et al., 2000; Yusuf et al., 2007; Hendricks and Singhal, 1997; Salaheldin, 2009;
Reed et al., 1996; Rust et al., 1999; Prajogo and McDermott, 2005; Hafeez et al., 2006; 565
Bou-Llusar and Beltran-Martin, 2005) as well as with human outcome, such as employee
satisfaction, supplier relationship, and customer satisfaction (Mehra and Ranganathan,
2008; Yang, 2006; Sila and Ebrahimpour, 2005; Gunasekaran and McGaughey, 2003;
Arumugam et al., 2008; Salaheldin, 2009). However, in practice, these TQM benefits
are not easy to achieve. There are quite a number of evidences that suggests TQM
implementation is often unsuccessful due to different focus of organizations in its
implementation (Venkatraman, 2007; Kendrick, 1993; Eskildson, 1995; Griffin, 1988; Koch
and Fisher, 1998; Fuchsberg, 1993). Organizations found some barriers which hinder the
implementation of TQM. Owing to these barriers, they have not achieved the desired
benefits, which they have expected after implementation of TQM. As a result, many of the
TQM initiatives have been abandoned or are in the process of being abandoned. Some
studies even have asserted that approximately two-third of organizations have failed to
their attempt to implement TQM (Hubiak and O’Donnell, 1996; Guangming et al., 2000).
Furthermore, the literature review suggest that no study has been taken that
investigate explicitly the interactions among the barriers of TQM and proposes an
interpretive structural modeling (ISM) based model for the TQM barriers. Hence, this is
perhaps the first study in this direction. To help address this gap, the present study
attempts to identify the barriers of TQM through extent literature review and expert
opinions and further develops the contextual relationships among these identified
barriers using ISM approach. It also proposes a hierarchy of TQM barriers model that
would help the managers and practitioners of service organizations to understand and
pay attention to the identified barriers for successful implementation of TQM program.
For this purpose the following objectives have been designed:
.
to identify and rank the barriers of TQM in service organizations;
.
to find out the interaction among identified barriers of TQM using ISM
approach; and
.
to discuss the managerial implications of this research study and suggest
directions for future research.
The remainder of this paper has been organized as follows. The next section provides a
review of the literature and discusses the identification of TQM barriers. This is
followed by discussion of ISM methodology and development of the relationships
´ ´ ´
model using ISM. Matrice d’Impacts Croises Multiplication Appliquee a un Classement
(MICMAC) analysis of developed ISM model is carried out subsequently. Finally, the
discussion and conclusion of this research study are presented, which is followed by
managerial implications and scope for future work.
Literature review
Despite the fact that practices related to successful implementation of TQM have
helped in achieving the desired outcomes namely increased organization performance,
4. BIJ profitability, and improved customer satisfaction, practicing and implementing TQM
18,4 practices is still not free from barriers. This literature review aims to identify the
barriers that need to be addressed during the implementation of TQM in service
organizations, which influence organizational performance and customer satisfaction.
Based on the extent literature review and discussion with the experts in the service
organizations, keeping the service sector in focus, 12 barriers were identified, which
566 can serve as invaluable lesson to those organizations that are planning to implement
TQM or are in the process of its implementation, and are presented in Table I.
The above listed barriers are often cited in the TQM literature and are found to be
frequently used by different researchers in their studies which suggest that these
barriers hinder the successful implementation of TQM. Beside this, some barriers
like inadequate understanding of customer needs, lack of customer focus, lack of
measurement, lack of awareness of quality at management level, lack of vision, lack of
accounting systems, lack of access to data and result, lack of suppliers/contractors
participation and other similar barriers are found to be insignificant in the present era of
digital technology and mass customization. Utmost importance to such barriers are
nowadays given due consideration by management by closely monitoring them through
company-wide information network. Therefore, such barriers are closely controlled and
monitored by management and hence, considered to be controllable with varying efforts.
Moreover, the barriers like incompatible organization structure, isolated individuals
and departments, inability to change organizational culture, insufficient resources,
short-term focus, and inappropriate rewards and recognition system which are often
cited with different names and headings are covered in this study under a common
barrier name like lack of coordination between departments, lack of continuous
improvement culture, human resource barriers, no benchmarking, poor planning and
inadequate use of empowerment and teamwork. Hence, these12 barriers are assumed
to be the major TQM barriers that hinder the successful implementation of TQM.
Identification of TQM barriers
Lack of top-management commitment. A TQM program will succeed only if
top-management is fully committed beyond public announcements (Whalen and
Rahim, 1994). Ellram (1991) emphasized top-management commitment as an enabler,
while lack of top-management commitment as a barrier too. According to Brigham
(1993), lack of proper leadership is a common barrier to both manufacturing and service
industry in implementing TQM. Kanji (1996) identified management’s failure to lead as
the primary obstacle to successful TQM. Van der Wiele and Brown (2002) found
management-related factors as the core factors that affect the long-term sustainability of
quality management. Lack of top-management commitment may stem from various
reasons like lack of experience and training, resistance to change, and hesitation in
initiating improvement programs.
High turnover at management level. High turnover and absenteeism at management
level have plagued many organizations and inhibited their efforts to implement TQM
initiatives effectively (Dowlatshahi, 1998; McDermott, 1994). Employees and managers
in most of the organization encounter difficulties in adopting themselves to modern
work environments with new rules and organization hierarchies. Structural problems
like organization culture and performance appraisal problems like lack of reward
system and training program were the most often cited explanation for failing to return
5. Barrier
no. Barriers References
1 Lack of top-management Tamimi and Sebastianelli (1998), Bhat and Rajashekhar (2009), Jun et al. (2004), Whalen and Rahim
commitment ¨ ¨
(1994), Venkatraman (2007), Ljungstrom and Klefsjo (2002), Soltani et al. (2005), Mosadegh Rad (2005),
Salegna and Fazel (2000), Brigham (1993), Kanji (1996), Newall and Dale (1990)
2 High turnover at management level Amar and Zain (2002), Jun et al. (2004), Tamimi and Sebastianelli (1998), Soltani et al. (2005), Mosadegh
Rad (2005), Teagarden et al. (1992), Dowlatshahi (1998), McDermott (1994), Jun et al. (2006), Knotts and
Tomlin (1994), Lawrence and Yeh (1994), Wentling and Palma-Rivas (1998), Lawrence and Lewis (1993)
3 Attitude of employees towards Amar and Zain (2002), Helms and Mayo (2008), Mosadegh Rad (2005), Salegna and Fazel (2000), Tamimi
quality and Sebastianelli (1998)
4 Lack of proper training and Tamimi and Sebastianelli (1998), Bhat and Rajashekhar (2009), Jun et al. (2004), Rajashekhar (1999),
education ¨ ¨
Whalen and Rahim (1994), Huq (2005), Ljungstrom and Klefsjo (2002), Soltani et al. (2005), Mosadegh
Rad (2005), Tatikonda and Tatikonda (1996), Adebanjo and Kehoe (1998), Newall and Dale (1990)
5 Lack of coordination between Amar and Zain (2002), Gunasekaran (1999), Salegna and Fazel (2000), Tamimi and Sebastianelli (1998),
department Al-Zamany et al. (2002)
6 Human resource barrier Tamimi and Sebastianelli (1998), Bhat and Rajashekhar (2009), Amar and Zain (2002), Jun et al. (2004),
¨ ¨
Whalen and Rahim (1994), Venkatraman (2007), Ljungstrom and Klefsjo (2002), Mosadegh Rad (2005),
Newall and Dale (1990)
7 No benchmarking Al-Zamany et al. (2002), Rajashekhar (1999), Tamimi and Sebastianelli (1998), Bhat and Rajashekhar
(2009), Jun et al. (2004)
8 Poor planning Tamimi and Sebastianelli (1998), Bhat and Rajashekhar (2009), Jun et al. (2004), Whalen and Rahim
(1994), Mosadegh Rad (2005), Salegna and Fazel (2000), Newall and Dale (1990)
9 Employee’s resistance to change Tamimi and Sebastianelli (1998), Bhat and Rajashekhar (2009), Jun et al. (2004), Whalen and Rahim
(1994), Venkatraman (2007), Soltani et al. (2005), Newall and Dale (1990)
10 Inadequate use of empowerment and Tamimi and Sebastianelli (1998), Bhat and Rajashekhar (2009), Jun et al. (2004), Gunasekaran (1999),
teamwork ¨ ¨
Whalen and Rahim (1994), Ljungstrom and Klefsjo (2002), Mosadegh Rad (2005), Salegna and Fazel
(2000),Adebanjo and Kehoe (1998), Newall and Dale (1990)
11 Lack of continuous improvement Al-Zamany et al. (2002), Amar and Zain (2002), Whalen and Rahim (1994), Huq (2005), Mosadegh Rad
culture (2005)
12 Lack of communication Al-Zamany et al. (2002), Helms and Mayo (2008), Huq (2005), Mosadegh Rad (2005), Salegna and Fazel
(2000), Tamimi and Sebastianelli (1998)
approach
the TQM literature
Using ISM
references as reported in
Barriers and their
567
Table I.
6. BIJ to work as scheduled and for absenteeism (Mosadegh Rad, 2005; Jun et al., 2004). High
18,4 turnover and absenteeism may also stem from ineffective employee selection practice
( Jun et al., 2004). Other explanations such as cultural differences (Lawrence and Yeh,
1994), employees family issues (Teagarden et al., 1992), and switching the jobs for a
minimal increase in salary (Lawrence and Lewis, 1993), have been offered to explain
the high turnover at management level. Ineffective employee compensation ( Jun et al.,
568 2006) and promotion (Wentling and Palma-Rivas, 1998) are also significant factors that
influence turnover and absenteeism in the organization. Appraisal schemes such as
family finances, basic healthcare facilities, quality and punctuality bonuses, and
on-site healthcare clinic for employees and their families could dramatically reduce
turnover and absenteeism (Teagarden et al., 1992; Jun et al., 2004).
Attitude of employee towards quality. Employee’s attitude towards quality is another
important hindrance in effective implementation of any quality program. Difficulty in
changing the mindset of employee with regard to quality and urgency among them are
reasons which generally obstructs the movement of quality program. Studies showed
that it is important for top-management to take a leadership role and show a strong
commitment at the time of implementing TQM to encourage employee towards quality
(Rivers and Bae, 1999; Lee and Asllani, 1997). Change of employee attitude towards
quality requires training and education as well as sense of CQI culture, which can be
built through committed leadership efforts. Employees have to be made to feel that
quality adds improvement in productivity, services, and reduce costs and they are
directly or indirectly responsible for customer satisfaction (Mosadegh Rad, 2004).
Lack of proper training and education. There are evidences that lack of proper training
and education exists at all levels of an organization, and that it is a large contributor to
worker resistance (Whalen and Rahim, 1994). A successful TQM environment requires a
committed, well-trained, and educated work force that participates fully in quality
improvement activities. Insufficient training on quality as well as training in problem
identification and problem solving techniques leads to failure in TQM implementation
program. However, it should be noted that training programs that are effectively
designed can be incorrectly implemented. For example, Tatikonda and Tatikonda
(1996) analyzed such a failure where employees learned statistical process control
(SPC) technique, but were not informed as to where to use it. Newall and Dale (1990) and
¨ ¨
Ljungstrom and Klefsjo (2002) have also reported in their studies that poor education
and training acts as a major barrier in the development and implementation of quality
program.
Lack of coordination between departments. Poor coordination between departments
is one of the critical barriers that an organization inhibits. Employee relations and
coordination between departments influence the performance of the organizational
system and consequently determine the nature and extent of TQM implementation
(Sureshchandar et al., 2001). Amar and Zain (2002) found that the culture and
interdepartmental relations are critical to TQM initiatives. Additionally, lack of
coordination between departments is seen to be detrimental to successful TQM
implementation. For example, it was observed that there are very wide differences of
opinion between the quality and production departments on many organization-related
matters (Amar and Zain, 2002). Weak internal communication within the departments
can also cause lack of coordination between departments and thus, leads to major
barrier to TQM implementation.
7. Human resource barrier. Human resource problem is an important barrier to Using ISM
successful TQM implementation. Newall and Dale (1990) found that many quality approach
departments were overworked and understaffed leading to TQM failure. Juran (1986)
reported that although the return on investment for a quality improvement project is
very high, many organizations fail to provide the adequate human resource necessary
to achieve significant results. Some studies have predicted human resource barriers
such as non-participation of employees, low knowledge and experience about TQM, 569
lack of culture and geographic homogeneity, lack of non-monetary motivation
mechanisms, the tedious aspect of writing procedures, and low wages and salaries, as
major obstacles to successful TQM implementation (Francois et al., 2003; Mosadegh
Rad, 2004; Huang et al., 1999).
No benchmarking. Benchmarking is a continuous systematic process of measuring
the products, services, and practices against those of competitive organization leaders
(Saravanan and Rao, 2006). Absence of benchmarking in the organization leads to lack of
CQI culture and competitiveness. Organization cannot achieve global standards without
benchmarking the critical business processes. Al-Zamany et al. (2002) examined that
regular meetings to review and improve the strategic plans will help in achieving the
well defined goals and targets, and results to removal of no-benchmarking barrier in
the organization. A recent study showed that despite the benefits of benchmarking,
it is seldom applied within the organization due to lack of feasible tools organizations
develop internally which are often unstructured, to compare their business practice with
¨
the practice of others (Bjorklund, 2010). Further, Presley and Meade (2010) present a
framework for performance measurement and benchmarking as two tools which can
assist organizations to realize the benefits and sustainability in construction industry.
Overall, the organization can be transformed to world class status when benchmarking
is directed at the key business processes.
Poor planning. The absence of a sound strategic planning by the top-management
has often contributed to ineffective quality improvement (Whalen and Rahim, 1994).
Juran (1986) reported that some managers even gave quality planning a low priority.
Though, the pre-planning stage of developing the right attitude and level of awareness is
considered crucial in achieving success in a quality improvement program (Oakland,
1989). Newall and Dale (1990) observed that a large number of organizations are either
unable or not willing to plan effectively for quality improvement. Therefore, careful and
detailed planning is needed prior to the implementation of any quality program and
organizations should identify beforehand the stages that their processes undergo.
Employees’ resistance to change. Employees’ resistance to adopt the change is a
common barrier that every organization experiences while implementing any quality
improvement program. Employees may perceive TQM as controlling rather than
empowering. They feel that TQM ask them to work harder for fewer rewards
(Mosadegh Rad, 2005). Newall and Dale (1990) found that aging workers as well as
workers, who suffer from illiteracy or language barrier, may resist the implementation of
new ideas and new concepts. On the other hand, Blankstein (1996) reported that
professionals and educated employees also resist to change as they expect autonomy
and academic freedom, as in case of higher education. To resolve these problems,
management should clarify organization’s quality strategies and polices, motivate
employees in order to participate actively in quality planning, decision making,
8. BIJ processes improvement, and use of employee ideas and suggestions in quality
18,4 management (Mosadegh Rad, 2005).
Inadequate use of empowerment and teamwork. Employee empowerment and
teamwork are critical factors in TQM. Most TQM programs place substantial emphasis
on teamwork and problem-solving groups. Newall and Dale (1990) found that teams are
seldom-fully used and their individual members are often contended. They suggested
570 that these problems are caused by lack of feedback. Likewise, Adebanjo and Kehoe
(1998), studied TQM implementation in UK manufacturing organizations, investigated
the reason for inadequate use of empowerment and teamwork among the organization.
They found insufficient teamwork facilitators and absence of team building techniques
in the organization. Oakland (1989) pointed out that it is important for the teams to focus
on issues and use time as efficiently as possible.
Lack of continuous improvement culture. Continuous improvement is increasingly
becoming the life-line for a TQM organization. Absence of continuous improvement
culture in the organization leads to total failure of TQM program. Deming (1986) and
Schneider et al. (1996) emphasized the importance of continuous improvement culture
with the goal of zero defects. Al-Zamany et al. (2002) reported that lack of continuous
improvement culture in the organization may be due to the following reasons:
.
unhealthy habits of the managers and executives;
.
weak sense of responsibility of the managers;
.
absence of assessment activities in the organizations;
.
appointment of unqualified managers; and
. lack of effective action to force improvement.
Lack of communication. Poor communication is one of the major barriers found to hinder
TQM efforts in an organization. Gunasekaran (1999) identified the enablers of TQM
implementation in one of the British manufacturing company through interview of
employees from different departments of the organization. He reported that among
people oriented factors, communication between managers, supervisor, and staff, was
the major enabler of TQM implementation, and poor communication between
departments was a real barrier to implementation of TQM. Lack of communication
across the organization often results to unsatisfied customers, unfulfilled customer
requirements, and environment of distrust. Al-Zamany et al. (2002) argued that in most
of the cases the management resists in sharing important information with the
employees for several reasons. This would create the environment of distrust and
conflict among management and employees.
ISM methodology and development of the relationship model
ISM methodology is an interactive learning process and helps to improve order and
direction on the complex relationships among variables of a system (Sage, 1977). In
this, a set of different and directly related variables affecting the system under
consideration is structured into a comprehensive systemic model. The model so formed
portrays the structure of a complex issue, a system of a field of study, in a carefully
designed pattern employing graphics as well as words (Singh et al., 2003; Ravi and
Shankar, 2005; Faisal et al., 2006).
9. ISM is a powerful qualitative tool which can be applied in various fields. Saxena et al. Using ISM
(1990) have identified the key variables using direct as well as indirect interrelationships approach
amongst the variables and presented the results of the application of ISM methodology
to the case of energy conservation in Indian cement industry. Mandal and Deshmukh
(1994) used the ISM methodology to analyze some of the important vendor selection
criteria and have shown the interrelationships of criteria and their levels. Singh et al.
(2003) have utilized this technique for the implementation of knowledge management in 571
engineering industries. Bolanos et al. (2005) applied ISM methodology in improving
decision making process among executives working in different functional areas while
Qureshi et al. (2007) developed a model for the logistics outsourcing relationship
variables to enhance shipper’s productivity and competitiveness in logistical supply
chain using ISM based approach. Faisal et al. (2006) found ISM application in supply
chain risk mitigation in Indian manufacturing SMEs. Hasan et al. (2007) explored
various barriers in adopting agile manufacturing and established a relationship among
these barriers through the ISM methodology. Beside this, Raj et al. (2008) conducted a
case a study and applied ISM approach for modeling the enablers of flexible
manufacturing system. Finally, a recent study conducted by Sahney et al. (2010)
proposed a quality framework for Indian higher education system particularly for
administrative staff. The framework was developed through the application of ISM.
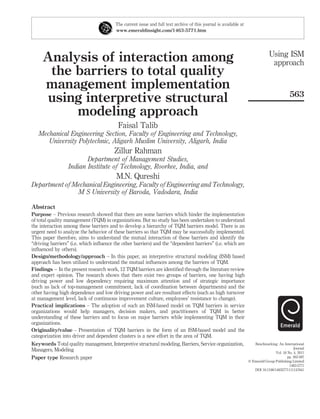
A number of barriers exist in the implementation of TQM in service
organizations. An examination of the direct and indirect relationship between these
barriers of TQM can give a clear picture of the situation than considering individual
factors alone in isolation. The ISM can be judiciously employed for getting better
insights into the system under consideration. The process of ISM begins with
the identification of variables that could be related to each other in a system. Direct and
indirect relationships are identified between these variables, which are then converted
into a matrix that is finally structured into a digraph model through a hierarchical
configuration (Figure 1).
3 5 9
1
10
6
4
11
7
Figure 1.
Digraph depicting the
8
2 relationship among
12 the TQM barriers
10. BIJ The ISM technique follows a systematic methodology. The various steps involved in
18,4 ISM technique when applied to the 12 identified barriers (or variables) as explained in
the previous section are as follows:
(1) The 12 barriers are listed and numbered as barriers 1-12 (Table I). These
barriers are identified through literature review and discussion with the experts
of the relevant area.
572 (2) Barriers identified in the first step are arranged in rows and columns, a matrix
is developed for the barriers, by relating each of the barriers with the other
barrier, one by one, pair-wise, through rows and columns. A contextual
relationship is thus, established among barriers in terms of “V”, “A”, “X”, and
“O” which are explained in the next section.
(3) On the basis of pair-wise relationship between barriers of the system as
obtained from step-2, a structural self-interaction matrix (SSIM) is developed for
barriers (Table II).
(4) A reachability matrix is then developed from the SSIM by converting the
information in each cell entry of the SSIM obtained from step-3 into binary numbers
“1” and “0” and thus, an initial reachability matrix is constructed (Table III).
(5) The initial matrix, obtained from step-4, is checked for transitivity and
modifications (if any) are made. The transitivity of the contextual relation
is a basic assumption made in ISM. It states that if a barrier (or variable) “i” is
related to “j” and “j” is related to “k”, then “i” is necessarily related to “k”. Thus,
a final reachability matrix is obtained (Table IV).
(6) The final reachability matrix obtained in step-5 is partitioned into different
levels on the basis of the reachability and antecedents sets for each of the
barriers and through a series of iterations (Tables V-XII).
(7) On the basis of the levels partitions obtained from step-6 and a final
reachability matrix (step-5), a conical matrix (lower triangular matrix) is
constructed (Table XIII). A directed graph or digraph is drawn and transitive links
are removed.
Barrier no. Barrier 12 11 10 9 8 7 6 5 4 3 2 1
1 Lack of top-management commitment V V V V V V V V V V V –
2 High turnover at management level A A A O A A O A A A –
3 Attitude of employees towards quality V V V V V O V A X –
4 Lack of proper training and education X V V V V V O A –
5 Lack of coordination between department V V V V V V V –
6 Human resource barrier O V A V A O –
7 No benchmarking A V A O A –
8 Poor planning A V V V –
9 Employee’s resistance to change O A A –
10 Inadequate use of empowerment and A V –
Table II. teamwork
Structural self-interaction 11 Lack of continuous improvement culture A –
matrix 12 Lack of communication –
11. Using ISM
Barrier no. Barriers 1 2 3 4 5 6 7 8 9 10 11 12
approach
1 Lack of top-management commitment 1 1 1 1 1 1 1 1 1 1 1 1
2 High turnover at management level 0 1 0 0 0 0 0 0 0 0 0 0
3 Attitude of employees towards quality 0 1 1 1 0 1 0 1 1 1 1 1
4 Lack of proper training and education 0 1 1 1 0 0 1 1 1 1 1 1
5 Lack of coordination between department 0 1 1 1 1 1 1 1 1 1 1 1 573
6 Human resource barrier 0 0 0 0 0 1 0 0 1 0 1 0
7 No benchmarking 0 1 0 0 0 0 1 0 0 0 1 0
8 Poor planning 0 1 0 0 0 1 1 1 1 1 1 0
9 Employee’s resistance to change 0 0 0 0 0 0 0 0 1 0 0 0
10 Inadequate use of empowerment and teamwork 0 1 0 0 0 1 1 0 1 1 1 0
11 Lack of continuous improvement culture 0 1 0 0 0 0 0 0 1 0 1 0 Table III.
12 Lack of communication 0 1 0 1 0 0 1 1 0 1 1 1 Initial reachability matrix
Barrier Driving
no. Barriers 1 2 3 4 5 6 7 8 9 10 11 12 power Rank
1 Lack of top-
management
commitment 1 1 1 1 1 1 1 1 1 1 1 1 12 I
2 High turnover at
management level 0 1 0 0 0 0 0 0 0 0 0 0 1 VIII
3 Attitude of employees
towards quality 0 1 1 1 0 1 1† 1 1 1 1 1 10 III
4 Lack of proper training
and education 0 1 1 1 0 1† 1 1 1 1 1 1 10 III
5 Lack of coordination
between department 0 1 1 1 1 1 1 1 1 1 1 1 11 II
6 Human resource barrier 0 1† 0 0 0 1 0 0 1 0 1 0 4 VI
7 No benchmarking 0 1 0 0 0 0 1 0 1† 0 1 0 4 VI
8 Poor planning 0 1 0 0 0 1 1 1 1 1 1 0 7 IV
9 Employee’s resistance to
change 0 0 0 0 0 0 0 0 1 0 0 0 1 VIII
10 Inadequate use of V
empowerment and
teamwork 0 1 0 0 0 1 1 0 1 1 1 0 6
11 Lack of continuous
improvement culture 0 1 0 0 0 0 0 0 1 0 1 0 3 VII
12 Lack of communication 0 1 1† 1 0 1† 1 1 1† 1 1 1 10 III
Dependence Power 1 11 5 5 2 8 8 6 11 7 10 5
Rank VIII I VI VI VII III III V I IV II VI
Table IV.
Note: 1† entries are included to incorporate transitivity Final reachability matrix
(8) The resultant digraph obtained from step-7 is converted into an ISM, by
replacing barriers nodes with statements (Figure 2).
(9) Finally, the ISM model developed in step-8 is reviewed to check for conceptual
inconsistency and necessary modifications are incorporated through expert
opinions.
12. BIJ
Barriers (Bi) Reachability set R(Bi) Antecedent set A (Bi) Intersection set R(Bi) > A(Bi) Level
18,4
1 1,2,3,4,5,6,7,8,9,10,11,12 1 1
2 2 1,2,3,4,5,6,7,8,10,11,12 2 I
3 2,3,4,6,7,8,9,10,11,12 1,3,4,5,12 3,4,12
4 2,3,4,6,7,8,9,10,11,12 1,3,4,5,12 3,4,12
574 5 2,3,4,5,6,7,8,9,10,11,12 1,5 5
6 2,6,9,11 1,3,4,5,6,8,10,12 6
7 2,7,9,11 1,3,4,5,7,8,10,12 7
8 2,6,7,8,9,10,11 1,3,4,5,8,12 8
9 9 1,3,4,5,6,7,8,9,10,11,12 9 I
10 2,6,7,9,10,11 1,3,4,5,8,10,12 10
Table V. 11 2,9,11 1,3,4,5,6,7,8,10,11,12 11
Barrier level iteration i 12 2,3,4,6,7,8,9,10,11,12 1,3,4,5,12 3,4,12
Barriers (Bi) Reachability set R(Bi) Antecedent set A (Bi) Intersection set R(Bi) > A(Bi) Level
1 1,3,4,5,6,7,8,10,11,12 1 1
3 3,4,6,7,8,10,11,12 1,3,4,5,12 3,4,12
4 3,4,6,7,8,10,11,12 1,3,4,5,12 3,4,12
5 3,4,5,6,7,8,10,11,12 1,5 5
6 6,11 1,3,4,5,6,8,10,12 6
7 7,11 1,3,4,5,7,8,10,12 7
8 6,7,8,10,11 1,3,4,5,8,12 8
10 6,7,10,11 1,3,4,5,8,10,12 10
Table VI. 11 11 1,3,4,5,6,7,8,10,11,12 11 II
Barrier level iteration ii 12 3,4,6,7,8,10,11,12 1,3,4,5,12 3,4,12
Barriers (Bi) Reachability set R(Bi) Antecedent set A (Bi) Intersection set R(Bi) > A(Bi) Level
1 1,3,4,5,6,7,8,10,12 1 1
3 3,4,6,7,8,10,12 1,3,4,5,12 3,4,12
4 3,4,6,7,8,10,12 1,3,4,5,12 3,4,12
5 3,4,5,6,7,8,10,12 1,5 5
6 6 1,3,4,5,6,8,10,12 6 III
7 7 1,3,4,5,7,8,10,12 7 III
8 6,7,8,10 1,3,4,5,8,12 8
Table VII. 10 6,7,10 1,3,4,5,8,10,12 10
Barrier level iteration iii 12 3,4,6,7,8,10,12 1,3,4,5,12 3,4,12
Structural self-interaction matrix
After identifying and enlisting 12 barriers through literature review and experts opinion,
there analysis is carried out. A contextual relationship of “leads to” type is chosen. This
means that one variable leads to another variable. Based on this principle, a contextual
relationship is developed. Some experts, both from service organizations and academia,
have been consulted in developing the contextual relationship among the barriers. In this
study a team of 12 members participated which comprises of three core members,
13. two quality experts, three from service organizations, and four from academia, having vast Using ISM
experience in field of service quality, product quality, TQM, quality implementation, and approach
service marketing. Expert group is hailed from service organizations namely:
. Banks.
.
Hospitals.
.
Information and communication technology organizations. 575
Barriers (Bi) Reachability set R(Bi) Antecedent set A (Bi) Intersection set R(Bi) > A(Bi) Level
1 1,3,4,5,8,10,12 1 1
3 3,4,8,10,12 1,3,4,5,12 3,4,12
4 3,4,8,10,12 1,3,4,5,12 3,4,12
5 3,4,5,8,10,12 1,5 5
8 8,10, 1,3,4,5,8,12 8
10 10 1,3,4,5,8,10,12 10 IV Table VIII.
12 3,4,8,10,12 1,3,4,5,12 3,4,12 Barrier level iteration iv
Barriers (Bi) Reachability set R(Bi) Antecedent set A (Bi) Intersection set R(Bi) > A(Bi) Level
1 1,3,4,5,8,12 1 1
3 3,4,8,12 1,3,4,5,12 3,4,12
4 3,4,8,12 1,3,4,5,12 3,4,12
5 3,4,5,8,12 1,5 5
8 8 1,3,4,5,8,12 8 V Table IX.
12 3,4,8,12 1,3,4,5,12 3,4,12 Barrier level iteration v
Barriers (Bi) Reachability set R(Bi) Antecedent set A (Bi) Intersection set R(Bi) > A(Bi) Level
1 1,3,4,5,12 1 1
3 3,4,12 1,3,4,5,12 3,4,12 VI
4 3,4,12 1,3,4,5,12 3,4,12 VI
5 3,4,5,12 1,5 5 Table X.
12 3,4,12 1,3,4,5,12 3,4,12 VI Barrier level iteration vi
Barriers (Bi) Reachability set R(Bi) Antecedent set A (Bi) Intersection set R(Bi) > A(Bi) Level
1 1,5 1 1 Table XI.
5 5 1,5 5 VII Barrier level iteration vii
Barriers (Bi) Reachability set R(Bi) Antecedent set A (Bi) Intersection set R(Bi) > A(Bi) Level
Table XII.
1 1 1 1 VIII Barrier level iteration viii
14. BIJ
Barrier no. Barriers 2 9 11 6 7 10 8 3 4 12 5 1
18,4
2 High turnover at management level 1 0 0 0 0 0 0 0 0 0 0 0
9 Employee’s resistance to change 0 1 0 0 0 0 0 0 0 0 0 0
11 Lack of continuous improvement culture 1 1 1 0 0 0 0 0 0 0 0 0
6 Human resource barrier 1 1 1 1 0 0 0 0 0 0 0 0
576 7 No benchmarking 1 1 1 0 1 0 0 0 0 0 0 0
10 Inadequate use of empowerment and teamwork 1 1 1 1 1 1 0 0 0 0 0 0
8 Poor planning 1 1 1 1 1 1 1 0 0 0 0 0
3 Attitude of employees towards quality 1 1 1 1 1 1 1 1 1 1 0 0
4 Lack of proper training and education 1 1 1 1 1 1 1 1 1 1 0 0
12 Lack of communication 1 1 1 1 1 1 1 1 1 1 0 0
Table XIII. 5 Lack of coordination between department 1 1 1 1 1 1 1 1 1 1 1 0
Conical matrix 1 Lack of top-management commitment 1 1 1 1 1 1 1 1 1 1 1 1
High turnover at Employee’s resistance
management level (2) to change (9)
Lack of continuous
improvement culture (11)
No benchmarking (7) Human resource barrier (6)
Inadequate use of empowerment
and teamwork (10)
Poor planning (8)
Lack of proper Attitude of
Lack of
training and employees towards
communication (12)
education (4) quality (3)
Lack of coordination between departments (5)
Figure 2.
ISM-based model of TQM
barriers for service
industries Lack of top-management commitment (1)
15. Keeping in mind the contextual relationship for each barrier, the existence of a relation Using ISM
between any two barriers (i and j) and the associated direction of this relation has been approach
decided as depicted in Figure 1. The following four symbols have been used to denote
the direction of the relationship between the two barriers (i and j):
(1) V ¼ is used for the relation from barrier i to barrier j (i.e. if barrier i “will help
achieve” or “will help alleviate” barrier j).
577
(2) A ¼ is used for the relation from barrier j to barrier i (i.e. if barrier j “will be
achieved by” or “will be alleviated by barrier i).
(3) X ¼ is used for both direction relations (i.e. if barriers i and j “help achieve each
other”).
(4) O ¼ is used for no relation between two barriers (i.e. if barriers i and j are not
related).
Based on the contextual relationship between barriers, the SSIM has been developed.
The SSIM is discussed with the experts. Based on their responses, SSIM has been
finalized and is presented in Table II. The following statements explain the use of
symbols in SSIM:
.
Symbol “V” is assigned to cell (1,5) because barrier “1” (i.e. lack of
top-management commitment) influences or leads to barrier “5” (i.e. lack of
coordination between department).
.
Symbol “A” is assigned to cell (2,11) because removal of barrier 11 (i.e. “lack of
continuous improvement culture”) would help alleviate Barrier 2 (i.e. high
turnover at management level).
.
Symbol “X” is assigned to cell (3,4) because barriers 3 (i.e. “attitude of employee
towards quality”) and 4 (i.e. “lack of proper training and education”) influences
each other.
.
Symbol “O” is assigned to cell (6,7) because barriers 6 (i.e. “human resource
barrier”) and 7 (i.e. “no benchmarking”) are not related.
Reachability matrix (initial and final)
To develop the reachability matrix from SSIM, two sub-steps were followed. In the first
sub-step, the SSIM table is converted into the initial reachability matrix by transforming
the information of each cell of SSIM into binary digits “0s” and “1s” in the initial
reachability matrix.
The rules for the substitution are as follows:
.
If the cell (i,j) is assigned with symbol “V” in the SSIM, then this cell (i,j) entry
becomes “1” and the cell ( j,i) entry becomes “0” in the initial reachability matrix.
.
If the cell (i,j) is assigned with symbol “A” in the SSIM, then, this cell (i,j) entry
becomes “0” and the cell ( j,i) entry becomes “1” in the initial reachability matrix.
. If the cell (i,j) is assigned with symbol “X” in the SSIM, then, this cell (i,j) entry
becomes “1” and the cell (j,i) entry also becomes “1” in the initial reachability matrix.
.
If the cell (i,j) is assigned with symbol “O” in the SSIM, then, this cell (i,j) entry
becomes “0” and the cell (j,i) entry also becomes “0” in the initial reachability matrix.
16. BIJ Following these rules, initial reachability matrix for the barriers is developed and is
18,4 shown in Table III.
In the second sub-step, final reachability matrix is obtained by incorporating the
transitivity as explained in step 5 of the ISM methodology. The final reachability matrix
will then consist of some entries from the pair-wise comparison and some inferred
entries. After incorporating the transitivity concept as described earlier, the final
578 reachability matrix is obtained and is presented in Table IV where in transitivity is
marked as 1†. In this table, the driving power and dependence of each barrier are also
shown along with the ranking of the barriers is also done. The driving power of a
particular barrier is the total number of barriers (including itself) which it may help
achieve. The dependence is the total number of barriers which may help achieving it.
These driving power and dependencies will be used in the MICMAC analysis, where the
barriers will be categorized into four clusters: autonomous (cluster I), dependent
(cluster II), linkage (cluster III), and independent also called driver barriers (cluster IV).
Level partitions
Based on the suggestions of Warfield (1974) and Farris and Sage (1975), the reachability
and antecedent set for each barrier is found out from final reachability matrix. The
reachability set for a particular barrier consists of the barrier itself and the other barriers,
which it may help achieve. Similarly, the antecedent set consists of the barrier itself and
the other barriers which may help in achieving them. After finding the reachability set
and antecedent set for each barrier, the intersection for these sets is derived for all the
barriers. The barriers for which the reachability and the intersection sets are the same is
given the top-level barrier in the ISM hierarchy, which would not help achieve any other
barrier above their own level. After the identification of the top-level barrier, it is removed
from the other remaining barriers. From Table V, it is seen that “high turnover at
management level” (Barrier 2) and “employee’s resistance to change” (Barrier 9) are found
at level I. Thus, it would be positioned at the top of the ISM model. This iteration is
continued till the levels of each barrier are determined. The levels so determined help in
building the digraph and the final model of ISM. The barriers along with their reachability
set, antecedent set, intersection set, and the different levels, are shown in Tables V-XII.
Further, level identification process of these barriers is completed in eight iterations.
Developing conical matrix
Conical matrix is achieved from partitioned reachability matrix by rearranging the
barriers according to their level, which means all the barriers having same levels are
clubbed together. Barriers 2 (high turnover at management level) and 9 (employee’s
resistance to change) are found at level I, while Barrier 11 (lack of continuous
improvement culture) is having level II, whereas barriers 7 (no benchmarking) and
6 (human resource barrier) are having level III. Similarly, all the barriers are clubbed as
per their level partition shown in Tables V-XII. After rearranging, the conical matrix is
obtained, which is depicted in Table XIII. The conical matrix helps in the generation of
the digraph and later on structural model.
Building the ISM-based model (Digraph)
Based on the conical matrix, an initial digraph including transitivity links is obtained.
This is generated by nodes and lines of edges. After removing the indirect links,
17. a final digraph is developed and is than finally converted into the ISM model by Using ISM
replacing nodes of the barriers with statements as shown in Figure 2. In this approach
development, the top level barriers are positioned at the top of the digraph and second
level barrier is placed at second position and so on, until the bottom level is placed at the
lowest position in the digraph (Figure 2).
The ISM model developed in this research depicts that “lack of top-management
commitment” (Barrier 1) is very significant barrier to TQM implementation especially in 579
service organization as it comes at the base of the ISM hierarchy. “High turnover at
management level” (Barrier 2) and “employee’s resistance to change” (Barrier 9) are the
TQM barriers on which the effectiveness of the TQM program overall depends. These
barriers have appeared at the top of the hierarchy (Level I).
“Lack of top-management commitment” (Barrier 1) leads to “lack of coordination
between departments” (Barrier 5), which results in “lack of communication” (Barrier 12),
“lack of proper training and education” (Barrier 4), and “attitude of employees towards
quality” (Barrier 3). A healthy relationship between department and employees should be
maintained as it influence the performance of the organization and consequently
determine the nature and extent of TQM implementation (Sureshchandar et al., 2001) as
otherwise it may lead to “lack of communication” (Barrier 12) which would effect the
implementation of effective training and education program (Barrier 4) as both are
interrelated. Beside this “lack of communication” (Barrier 12) also propagate the “attitude
of employee’s towards quality” (Barrier 3) which will hinder the implementation of TQM
program in the organization. Therefore, “lack of communication” (Barrier 12), “lack of
proper training and education” (Barrier 4), and “attitude of employee’s towards quality”
(Barrier 3) should be addressed at the same level.
“Poor planning” (Barrier 8) propagates through Barriers 12, 4 and 3, if there is flow of
communication in the organization, proper training and education is imparted and
employee’s attitude towards quality is developed than barrier of poor planning will be
removed and a an effective planning will emerged out. Further, a good strategic planning
should be in place that could benchmark organization’s activities and practices against
those of competitive organization leaders (Saravanan and Rao, 2006) as well as make
use of available human resources effectively as otherwise it may lead to problems like
“inadequate use of empowerment and teamwork” (Barrier 10), “no benchmarking”
(Barrier 7), and “human resource barrier” (Barrier 6) which would counter to the
objective of providing quality products and services to the customers. Also, absence of
benchmarking in the organization leads to “lack of continuous quality improvement
culture” (Barrier 11). Organization cannot achieve global standards without
benchmarking critical business processes (Saravanan and Rao, 2006). “Human resource
barrier” (Barrier 6) enhance the “lack of continuous improvement culture” (Barrier 11), as
insufficient work force as well as incompetent and untrained employees will result in lack
of continuous improvement culture. Without development of continuous improvement
culture, it would be difficult to improve the “high turnover at management level” (Barrier 2)
and barrier of “employee’s resistance to change” (Barrier 9).
MICMAC analysis
The MICMAC principle, also called as cross-impact matrix multiplication applied to
classification, is based on multiplication properties of matrices (Sharma et al., 1995).
The purpose of MICMAC analysis is to analyze the driver power and dependence power
18. BIJ of variables (Mandal and Deshmukh, 1994). The barriers (or variables) are categorized
18,4 into four clusters (Figure 3). The first cluster (I) contains “autonomous barriers” that
have weak driver power and weak dependence. These barriers are relatively
disconnected from the system, with which they have only few links, which may
be strong. Second cluster (II) contains “dependent barriers” that have weak driver power
but strong dependence. Third cluster (III) has the linkage barriers that have strong
580 driving power and also strong dependence. These barriers are unstable in the fact that
any action on these barriers will have an effect on others and also a feedback on
themselves. Fourth cluster (IV) includes the independent barriers having strong driving
power but weak dependence. Driving power and dependence is the summation of binary
digit “1s” in their respective row and column for each barrier, respectively, in the final
reachability matrix shown in Table IV. Subsequently, the driver power-dependence
diagram is constructed which is shown in Figure 3. As an illustration, it is observed from
Table IV that Barrier 1 is having a driver power of “12” and a dependence of “1”.
Therefore, in this figure, it is positioned at a place corresponding to a driver power of
“12” and a dependence of “1”.
Discussion and conclusion
The main objective of this research is to analyze the interaction among the various
barriers of TQM which hinder in the successful implementation of TQM and to develop
a hierarchy of TQM barriers that would help in understanding these barriers in service
organizations. Therefore, an ISM-based model on TQM barriers has been developed.
These barriers assumes importance because they hinder the TQM implementation
program and pose considerable challenges both for managers and practitioners of TQM
in service organizations. Some of the major barriers have been discussed here and placed
into an ISM model, to analyze the interaction between these barriers. The present
Strong 12 1
11 5
10 3,4,12
4
IV III
9
8
Driving power
7 8
6 10
5
4 6,7
3 11
I II
2
Weak
1 2,9
9
0
0 1 2 3 4 5 6 7 8 9 10 11 12
Weak Dependence Strong
Figure 3.
Driving power and Notes: I autonomous barrier; II dependent barrier; III linkage barrier;
dependence diagram
IV independent (driver) barrier
19. research emphasize that there is need to overcome these barriers for the success of TQM Using ISM
in the service organizations in order to improve organization performance and gain approach
customer satisfaction. This study can serve an eye opener for those service organizations
that lacks top-management commitment and coordination among departments which
are found to be major barriers of TQM implementation program in an organization.
The driver power-dependence matrix diagram (Figure 3) gives some valuable
insights about the relative importance and the interdependencies among the TQM 581
barriers. This can give better insights to the top-management so that they can
proactively deal with these barriers. Some of the observations from the ISM model,
which give important managerial implications, are discussed below:
.
Figure 3 shows that there are no autonomous barriers seen in the
driver-dependence diagram. The absence of these barriers in the present study
indicates that all the considered barriers play a significant role in hindering the
implementation of TQM program. The management therefore, should pay
attention to all the considered barriers for a successful implementation of TQM
program.
.
Barriers such as “high turn over at management level”, “employee’s resistance to
change”, “lack of continuous improvement culture”, “no benchmarking”, “human
resource barrier”, and “inadequate use of empowerment and teamwork” are
possessing weak driving powers but strong dependency on other barriers. They
are seen at the top of the ISM hierarchy (Figure 2). These barriers represent the
unfavorable outcome to the managers and practitioners of service organizations.
Hence, managers should take special care to handle these barriers.
.
No barriers are seen as a linkage barrier that has a strong driving power as well
as strong dependence. Thus, it can be deduced that all the barriers of TQM
identified are stable.
.
Finally, the driver power-dependence diagram indicates that independent
barriers such as “lack of top-management commitment”, “lack of coordination
between departments”, “lack of communication”, “lack of proper training and
education”, “attitude of employees towards quality”, and “poor planning” are at
the bottom of ISM hierarchy, having strong driving power and weak dependence.
Thus, management should place a high priority in tackling these barriers which
have capability of influencing other barriers. They may be treated as the “major
barrier” to TQM implementation.
The main contribution of this research includes the following:
.
In the present research paper, an attempt has been made to identify the major
barriers to TQM implementation in service organizations and is brought at one
platform. Though, few research papers are available on TQM barriers, but no
study is taken to understand the interaction among these major barriers. Also,
there is no study on the development of model on barriers of TQM which could help
to develop the relationship between them so that these barriers may be omitted
or minimized. The present ISM based model will help managers and practitioners
of TQM to understand the relationship crux. Hence, this research assumes
importance in this context.
20. BIJ .
A key finding of this research is that “lack of top-management commitment” and
18,4 “lack of coordination between departments” are significant barriers. From the
ISM model, it is observed that “lack of top-management commitment” and “lack
of coordination between various departments” are at the bottom level of the
hierarchy implying higher driving power. Therefore, management should focus
on developing commitment and leadership within the organization and develop
582 coordinal environment for healthy relationship between different departments to
create quality culture and awareness about the benefits of TQM program so the
same can be reaped.
.
In this research, there are number of barriers responsible for high turnover at
management level and employee’s resistance to change. These barriers of TQM
are modeled in terms of their driving and dependence powers which have been
carried out. Those barriers possessing higher driving power in the ISM need to
be dealt with care on priority basis because they influence high turnover at
management level and employee’s resistance to change.
.
In the present research, the proposed ISM-based model for identification and
ranking of TQM barriers can provide the decision makers and practitioners a more
realistic representation of the problem in the course of implementing TQM in their
organization. A major contribution of this research paper lies in the development of
contextual relationship among various identified barriers of TQM through a single
systemic framework. The utility of the proposed ISM methodology lies in imposing
order and direction on the complexity of relationships among these barriers which
would help the decision makers and practitioners of TQM to better utilize their
available resources for minimizing the barriers in the service organizations.
Finally, it would be useful to suggest the direction of future research in this area. The
present model has not been statistically tested and validated. Thus, the model is required
to be statistically tested and validated using different approaches one of them is the
“Structural Equation Modeling” (SEM) approach, also referred to as linear structural
relationship approach. Statistical software like Amos 16.0, Lisrel 8.8 can be used in
future to build correlation matrix, confirmatory factor analysis (CFA), and diagramming
to validate the relationships. Comparing ISM and SEM, SEM has the capability of
statistically testing an already developed theoretical model whereas ISM on the other
hand has the capability to develop an initial model through managerial techniques such
as brainstorming, nominal group techniques and idea engineering. In this way, ISM is a
supportive analytic tool for this situation. However, it may be suggested that due to
complimentary nature of both of these techniques, the future research may be directed in
first developing an initial model using ISM and then testing it using SEM. ISM also helps
in classifying variable into dependent, independent, autonomous, and link categories.
Management may use their resources over identified factors thus, optimization of the
resources may be accomplished. Further, the systemic framework proposed in this study
has wide application and can be used to improve performance, administrative abilities,
and effectiveness of the organization.
References
Adebanjo, D. and Kehoe, D. (1998), “An evaluation of quality culture problems in UK companies”,
International Journal of Quality Science, Vol. 3 No. 3, pp. 275-86.
21. Al-Zamany, Y., Hoddell, E.J. and Savage, B.M. (2002), “Understanding the difficulties of Using ISM
implementing quality management in Yemen”, The TQM Magazine, Vol. 14 No. 4, pp. 240-7.
approach
Amar, K. and Zain, M.Z. (2002), “Barriers to implementing TQM in Indonesian manufacturing
organizations”, The TQM Magazine, Vol. 14 No. 6, pp. 367-72.
Arumugam, V., Ooi, K-B. and Fong, T-C. (2008), “TQM practices and quality management
performance – an investigation of their relationship using data from ISO 9001:2000 firms
in Malaysia”, The TQM Magazine, Vol. 206, pp. 636-50. 583
Bhat, K.S. and Rajashekhar, J. (2009), “An empirical study of barriers to TQM implementation in
Indian industries”, The TQM Magazine, Vol. 21 No. 3, pp. 261-72.
¨
Bjorklund, M. (2010), “Benchmarking tool for improved corporate social responsibility in
purchasing”, Benchmarking: An International Journal, Vol. 17 No. 3, pp. 340-62.
Blankstein, A.M. (1996), “Why TQM can’t work-and a school where it did”, Education Digest,
Vol. 62 No. 1, pp. 27-30.
Bolanos, R., Fontela, E., Nenclares, A. and Paster, P. (2005), “Using interpretive structural modeling
in strategic decision making groups”, Management Decision, Vol. 43 No. 6, pp. 877-95.
Bou-Llusar, J.C. and Beltran-Martin, I. (2005), “TQM, high-commitment human resource strategy
and firm performance: as empirical study”, Total Quality Management, Vol. 16 No. 1, pp. 71-86.
Brah, S.A., Wong, J.L. and Rao, B.M. (2000), “TQM and business performance in the service
sector: a Singapore study”, International Journal of Operations & Production Management,
Vol. 20 No. 11, pp. 1293-312.
Brigham, S.E. (1993), “Lessons we can learn from industry”, Change, Vol. 25 No. 3, pp. 42-7.
Burr, J.T. (1993), “A new name for a not-so-new concept”, Quality Progress, pp. 87-8.
Deming, W.E. (1986), Out of the Crisis, MIT, Centre for Advanced Engineering, Cambridge, MA.
Dowlatshahi, S. (1998), “The role of purchasing and TQM in the Maquiladora industry”,
Production & Inventory Management Journal, Vol. 39, pp. 32-49.
Ellram, L. (1991), “Key success factors and barriers in international purchasing partnerships”,
Management Decision, Vol. 29 No. 7, pp. 38-44.
Eraqi, M.I. (2006), “Tourism services quality (TourServQual) in Egypt – the viewpoints of external
and internal customers”, Benchmarking: An International Journal, Vol. 13 No. 4, pp. 469-92.
Eskildson, I. (1995), “TQM’s role in corporate success: analyzing the evidence”, National
Productivity Review, Vol. 14 No. 4, pp. 25-38.
Evans, J.R. and Lindsay, W.M. (1996), The Management and Control of Quality, 3rd ed.,
West Publishing Company, St Paul, MN.
Faisal, M.N., Banwet, D.K. and Shankar, R. (2006), “Supply chain risk mitigation: modeling the
enablers”, Business Process Management Journal, Vol. 12 No. 4, pp. 535-52.
Farris, D.R. and Sage, A.P. (1975), “On the use of interpretive structural modeling for worth
assessment”, Computers and Electrical Engineering, Vol. 2 Nos 2/3, pp. 149-74.
Francois, P., Peyrin, J.C., Touboul, M., Labarere, J., Reverdy, T. and Vinck, D. (2003), “Evaluating
implementation of quality management systems in a teaching hospital’s clinical
departments”, International Journal of Quality Health Care, Vol. 15 No. 1, pp. 47-55.
Fuchsberg, G. (1993), “Total quality is termed only partial success”, The Wall Street Journal,
Vol. 1, October, p. B1.
Griffin, R. (1988), “Consequences of quality circles in an industrial setting: a longitudinal
assessment”, Academy of Management Journal, Vol. 31 No. 2, pp. 338-58.
22. BIJ Guangming, C., Clarke, S. and Lehaney, B. (2000), “A systemic view of organizational change and
TQM”, The TQM Magazine, Vol. 12 No. 3, pp. 186-93.
18,4
Gunasekaran, A. (1999), “Enablers of total quality management implementation on
manufacturing: a case study”, Total Quality Management, Vol. 10 No. 7, pp. 987-96.
Gunasekaran, A. (2000), “World class manufacturing in small and medium enterprises”, International
Journal of Manufacturing Technology and Management, Vol. 2 Nos 1-7, pp. 777-89.
584 Gunasekaran, A. and McGaughey, R.E. (2003), “TQM in supply chain management”, The TQM
Magazine, Vol. 15 No. 6, pp. 361-3.
Hafeez, K., Malak, N. and Abdelmeguid, H. (2006), “A framework for TQM to achieve business
excellence”, Total Quality Management, Vol. 17 No. 9, pp. 1213-29.
Hansson, J. and Eriksson, H. (2002), “The impact of TQM on financial performance”, Measuring
Business Excellence, Vol. 6 No. 4, pp. 44-54.
Hasan, M.A., Shankar, R. and Sarkis, J. (2007), “A study of barriers to agile manufacturing”,
International Journal of Agile Systems and Management, Vol. 2 No. 1, pp. 1-22.
Helms, M.M. and Mayo, D.T. (2008), “Assessing poor quality service: perceptions of customer
service representative”, Managing Service Quality, Vol. 18 No. 6, pp. 610-22.
Hendricks, K.B. and Singhal, V.R. (1997), “Does implementing an effective TQM program
actually improve operating performance? Empirical evidence from firms that have won
quality awards”, Management Science, Vol. 43 No. 9, pp. 1258-74.
Ho, S.K.M. (2010), “Integrated lean TQM model for global sustainability and competitiveness”,
The TQM Journal, Vol. 22 No. 2, pp. 143-58.
Huang, J., Lee, Y.W. and Wang, R.Y. (1999), Quality Information and Knowledge, Prentice-Hall,
Upper Saddle River, NJ.
Hubiak, W.A. and O’Donnell, S.J. (1996), “Do Americans have their minds set against TQM?”,
National Productivity Review, Vol. 15, pp. 19-20.
Huq, Z. (2005), “Managing change: a barrier to TQM in implementation in service industry”,
Managing Service Quality, Vol. 15 No. 5, pp. 452-69.
Jun, M., Cai, S. and Peterson, R.T. (2004), “Obstacles to TQM implementation in Mexico’s
Maquiladora industry”, Total Quality Management, Vol. 15 No. 1, pp. 59-72.
Jun, M., Cai, S. and Shin, H. (2006), “Total quality management practice in Maquiladora:
antecedents of employee satisfaction and loyalty”, Journal of Operations Management,
Vol. 24, pp. 791-812.
Juran, J.M. (1986), “The quality trilogy”, Quality Progress, August, pp. 19-24.
Kaluarachchi, K.A.S.P. (2010), “Organizational culture and TQM practices: a Sri Lankan case”,
The TQM Journal, Vol. 22 No. 1, pp. 41-55.
Kanji, G.K. (1996), “Implementation and pitfalls of total quality management”, Total Quality
Management, Vol. 7, pp. 331-43.
Kendrick, J.J. (1993), “TQM: is it forging ahead or falling behind quality?”, Quality, Vol. 32
No. 5, p. 13.
Knotts, R. and Tomlin, S. (1994), “A comparison of TQM practices in US and Mexico companies”,
Journal of Production and Inventory Management, Vol. 35 No. 1, pp. 53-8.
Koch, J.V. and Fisher, J.L. (1998), “Higher education and total quality management”, Total Quality
Management, Vol. 9 No. 8, pp. 659-68.
Kureshi, N., Qureshi, F. and Sajid, A. (2010), “Current health of quality management practices in
service sector SME – a case study of Pakistan”, The TQM Journal, Vol. 22 No. 3, pp. 317-29.
23. Lawrence, J.J. and Lewis, H.S. (1993), “JIT manufacturing in Mexico: obstacles to Using ISM
implementation”, Journal of Production and Inventory Management, Vol. 34 No. 3, pp. 31-5.
approach
Lawrence, J.J. and Yeh, R. (1994), “The influence of Mexican culture on the use of Japanese
manufacturing techniques in Mexico”, Management International Review, Vol. 34 No. 1,
pp. 49-66.
Lee, S.M. and Asllani, A. (1997), “TQM and BPR: symbiosis and a new approach for integration”,
Management Decision, Vol. 35 No. 6, pp. 409-16. 585
Leonard, D. (2010), “Quality management practices in the US homebuilding industry”, The TQM
Journal, Vol. 22 No. 1, pp. 101-10.
¨ ¨
Ljungstrom, M. and Klefsjo, B. (2002), “Implementation obstacles for a work-development-oriented
TQM strategy”, Total Quality Management, Vol. 13, pp. 621-34.
McDermott, T. (1994), “TQM: the total quality Maquiladora”, Business Mexico, November, pp. 42-5.
Mandal, A. and Deshmukh, S.G. (1994), “Vendor selection using interpretive structural modeling
(ISM)”, International Journal of Operations & Production Management, Vol. 14 No. 6, pp. 52-9.
Mehra, S. and Ranganathan, S. (2008), “Implementing TQM with a focus on enhancing customer
satisfaction”, International Journal of Quality & Reliability Management, Vol. 25 No. 9,
pp. 913-27.
Mosadegh Rad, A.M. (2004), “A step to total quality management”, Management and
Development Process Quarterly, Vol. 55, pp. 32-41.
Mosadegh Rad, A.M. (2005), “A survey of total quality management in Iran-barriers to successful
implementation in health care organizations”, Leadership in Health Services, Vol. 18 No. 3,
pp. 12-34.
Newall, D. and Dale, B. (1990), “The introduction and development of a quality improvement
process: a study”, International Journal of Production Research, Vol. 29 No. 9, pp. 1747-60.
Oakland, J.S. (1989), Total Quality Management, Heinemann, London.
Prajogo, I. and McDermott, C.M. (2005), “The relationship between TQM practices and
organizational culture”, International Journal of Operations & Production Management,
Vol. 25 No. 11, pp. 1101-22.
Presley, A. and Meade, L. (2010), “Benchmarking for sustainability: an application to the
sustainable construction industry”, Benchmarking: An International Journal, Vol. 17 No. 3,
pp. 435-51.
Qureshi, M.N., Kumar, D. and Kumar, P. (2007), “Modeling the logistics outsourcing relationship
variables to enhance shippers’ productivity and competitiveness in logistical supply
chain”, International Journal of Productivity and Performance Management, Vol. 56 No. 8,
pp. 689-714.
Raj, T., Shankar, R. and Suhaib, M. (2008), “An ISM approach for modeling the enablers of
flexible manufacturing system: the case for India”, International Journal of Production
Research, Vol. 46 No. 24, pp. 6883-912.
Rajashekhar, J. (1999), “Total quality management in India-perspective and analysis”, The TQM
Magazine, Vol. 11 No. 5, pp. 321-7.
Ravi, V. and Shankar, R. (2005), “Analysis of interactions among the barriers of reverse
logistics”, Technological Forecasting and Social Change, Vol. 72 No. 8, pp. 1011-29.
Reed, R., Lemak, D.J. and Montgomery, J.C. (1996), “Beyond process: TQM content and firm
performance”, Academy of Management Review, Vol. 21 No. 1, pp. 172-202.
Rivers, P.A. and Bae, S. (1999), “TQM implementation in health care organizations”, Total Quality
Management, Vol. 10 No. 2, pp. 281-90.
24. BIJ Rust, R.T., Keiningham, T.L., Clemens, S. and Zahorik, A.J. (1999), “Return on quality at Chase
Manhattan Bank”, Interfaces, March-April, pp. 62-72.
18,4
Sage, A.P. (1977), Interpretive Structural Modeling: Methodology for Large-scale Systems,
McGraw-Hill, New York, NY, pp. 91-164.
Sahney, S., Banwet, D.K. and Karunes, S. (2010), “Quality framework in education through
application of interpretive structural modeling: an administrative staff perspective in the
586 Indian context”, The TQM Journal, Vol. 22 No. 1, pp. 56-71.
Salaheldin, S.I. (2009), “Critical success factors for TQM implementation and their impact on
performance of SMEs”, International Journal of Productivity and Performance
Management, Vol. 58 No. 3, pp. 215-37.
Salegna, G. and Fazel, F. (2000), “Obstacles to implementing TQM”, Quality Progress, Vol. 33
No. 7, pp. 53-64.
Saravanan, R. and Rao, K.S.P. (2006), “Development and validation of an instrument for
measuring total quality service”, Total Quality Management, Vol. 17 No. 6, pp. 733-49.
Saxena, J.P., Sushil and Vrat, P. (1990), “Impact of indirect relationships in classification of
variables – a MICMAC analysis for energy conservation system”, System Research, Vol. 7
No. 4, pp. 245-53.
Schneider, B., Brief, A.P. and Guzzo, R.A. (1996), “Creating a climate and culture for sustainable
organizational change”, Organizational Dynamics, Vol. 24, pp. 7-19.
Sharma, H.D., Gupta, A.D. and Sushil (1995), “The objectives of waste management in India:
a future inquiry”, Technological Forecasting and Social Change, Vol. 48 No. 3, pp. 285-309.
Sila, I. and Ebrahimpour, M. (2005), “Critical linkages among TQM factors and business results”,
International Journal of Operations & Production Management, Vol. 25 No. 11, pp. 1123-55.
Singh, M.D., Shankar, R., Narain, R. and Agarwal, A. (2003), “An interpretive structural modeling
of knowledge management in engineering industries”, Journal of Advances in
Management Research, Vol. 1 No. 1, pp. 28-40.
Soltani, E., Lai, P-C. and Gharneh, N.S. (2005), “Breaking through barrier to TQM effectiveness:
lack of commitment of upper-level management”, Total Quality Management, Vol. 16
Nos 8/9, pp. 1009-21.
Srikanthan, G. and Dalrymple, J. (2004), “A synthesis of a quality management model for
education in universities”, The International Journal of Educational Management, Vol. 18
No. 4, pp. 266-79.
Sureshchandar, G.S., Rajendran, C. and Anantharaman, R.N. (2001), “A holistic model for total
quality service”, International Journal of Service Industry Management, Vol. 12,
pp. 378-412.
Tamimi, N. and Sebastianelli, R. (1998), “The barriers to total quality management”, Quality
Progress, Vol. 31 No. 6, pp. 57-60.
Tatikonda, L.U. and Tatikonda, R.J. (1996), “Top ten reasons your TQM effort is failing to
improve profit”, Production & Inventory Management Journal, Vol. 37, pp. 5-9.
Teagarden, M.B., Butler, M.C. and Von Glinow, M.A. (1992), “Mexico’s Maquiladora industry:
where strategic human resource management makes a difference”, Organizational
Dynamics, Vol. 20, pp. 34-42.
Telford, R. and Masson, R. (2005), “The congruence of quality values in higher education”,
Quality Assurance in Education, Vol. 13 No. 2, pp. 107-19.
Van der Wiele, T. and Brown, A. (2002), “Quality management over a decade (a longitudinal
study)”, International Journal of Quality & Reliability Management, Vol. 19, pp. 508-23.
25. Venkatraman, S. (2007), “A framework for implementing TQM in higher education programs”, Using ISM
Quality Assurance in Education, Vol. 15 No. 1, pp. 89-112.
Warfield, J.W. (1974), “Developing interconnected matrices in structural modelling”,
approach
IEEE Transcript on Systems, Men and Cybernetics, Vol. 4 No. 1, pp. 81-7.
Wentling, R.M. and Palma-Rivas, N. (1998), “Current status and future trends of diversity
initiatives in the workplace: Diversity experts’ perspective”, Human Resource
Development Quarterly, Vol. 9 No. 3, pp. 235-53. 587
Whalen, M.J. and Rahim, M.A. (1994), “Common barriers to implementation and development of
a TQM process”, Industrial Management, Vol. 36 No. 2, pp. 19-24.
Yang, C.C. (2006), “The impact of human resource management practices on the implementation
of total quality management”, The TQM Magazine, Vol. 18 No. 2, pp. 162-73.
Yusuf, Y., Gunasekaran, A. and Dan, G. (2007), “Implementation of TQM in China and
organizational performance: an empirical investigation”, Total Quality Management,
Vol. 18 No. 5, pp. 509-30.
Further reading
Mosadegh Rad, A.M. (2003), The Principles of Health Care Administration, Dibagran Tehran,
Tehran.
About the authors
Faisal Talib is an Assistant Professor at Mechanical Engineering Section, University
Polytechnic, Aligarh Muslim University, Aligarh, India. He holds Masters in Industrial and
Production Engineering and is currently pursuing a PhD in Total Quality Management in
Service Sector from Indian Institute of Technology, Roorkee, India. He has more than 12 years of
teaching experience. He has more than 30 publications to his credit in national/international
journals and conferences. His special interests include quality engineering, TQM, service quality,
Quality Concepts Taguchi Methods, and quality management in service industries. Faisal Talib
is the corresponding author and can be contacted at: ftalib77@yahoo.co.in
Zillur Rahman is an Associate Professor at Department of Management Studies, IIT, Roorkee.
He is a recipient of the Emerald Literati Club Highly Commended Award and one of his papers
was The Science Direct Top 25 Hottest Article. His work has been published and cited in various
journals including Management Decision, Managing Service Quality, International Journal of
Information Management, Industrial Management and Data Systems, The TQM Magazine,
Business Process Management Journal, International Journal of Service Industry Management,
Information Systems Journal, Decision Support Systems, Journal of Business and Industrial
Marketing, and International Journal of Computer Integrated Manufacturing, to name a few.
M.N. Qureshi is an Associate Professor at Mechanical Engineering Department, Faculty of
Engineering and Technology, M S University of Baroda. He earned his graduation and post
graduation degrees in Mechanical Engineering from M S University of Baroda and later on a
PhD from IIT Roorkee, Roorkee. He has more than 50 publications to his credit in
national/international journals and in conference proceedings. His areas of interest include
logistics and supply chain management, industrial management, quality management, etc.
To purchase reprints of this article please e-mail: reprints@emeraldinsight.com
Or visit our web site for further details: www.emeraldinsight.com/reprints