SlideShare a Scribd company logo
1 of 2
Download to read offline
ASU Lodestar Center for Philanthropy & Nonprofit Innovation
Arizona State University
College of Public Programs
411 N. Central Ave., Suite 500
Phoenix, AZ 85004-0691
602.496.0500 | nonprofit@asu.edu
The mission of the ASU Lodestar Center is
to build the capacity of the social sector by
enhancing the effectiveness of those who lead,
manage, and support nonprofit organizations.
lodestar.asu.edu
ASU Lodestar Center for Philanthropy & Nonprofit Innovation | Arizona State University
411 North Central Avenue, Suite 500 | Phoenix, Arizona 85004-0691
lodestar.asu.edu nonprofit@asu.edu
ASU Lodestar Center for Philanthropy & Nonprofit Innovation
highlight
nonprofit
compensation &
benefits2013 reportMaricopa and Pima County Organizations
Chief Executive Officers
The top executive of a nonprofit organization is often titled Chief Executive Officer; other titles used for this position include
Executive Director and President. Of the 237 organizations that responded to the Nonprofit Compensation and Benefits
Survey, 231 reported having a full-time CEO and 226 of those reported the CEO’s annual salary.
As expected, CEOs are paid higher salaries in organizations with higher annual expenditures (organization budget). In a
statistical regression model, organization budget size and CEO years of experience are the only significant predictors of
CEO salary. The table below depicts increasing levels of median CEO compensation across organization budget category.
The 2013 Nonprofit Compensation and Benefits Report, published by the ASU Lodestar Center for Philanthropy and Nonprofit Innovation, contains compensation
data on over 50 nonprofit job categories as well as on findings on employee retirement, insurance, paid time off, and other benefits. It also includes detailed salary
and demographic information on nonprofit CEOs. The full report is available for purchase, organizations that completed the survey will receive a complimentary copy.
To order the full report, please visit lodestar.asu.edu or call 602.496.0500.
Chief Executive Officers:
Compensation, Gender Representation, and Experience
CEO Salary by Budget Category
Copyright © 2013 Arizona Board of Regents for and on behalf of the ASU Lodestar Center for Philanthropy and Nonprofit Innovation,
College of Public Programs, Arizona State University. All rights reserved. No part of this publication may be reproduced, stored in a
retrieval system, or transmitted in any form or by any means, electronic, mechanical, photocopying, recording, or otherwise without the
express written permission of the ASU Lodestar Center, except for brief quotations in critical reviews.
19 Nonprofit Compensation & Benefits Report 2013
Chief Executive Officers
The survey included several additional questions about the chief executive officer (CEO), identified as the organization’s top executive
and usually titled CEO or executive director. Of the 237 responding organizations, 231 reported having a full-time CEO and 226 of
those reported the CEO’s annual salary.
As expected, CEOs are paid higher salaries in organizations with higher annual expenditures (organization budget). In a statistical
regression model, organization budget size and CEO years of experience are the only significant predictors of CEO salary. Figure 10
depicts increasing levels of median CEO compensation across organization budget category. Table 23 provides more detail on the
median, average, and median base (starting) salaries of CEOs across organization budget size.
$164,000
$104,015
$75,000
$55,000
$0 $20,000 $40,000 $60,000 $80,000 $100,000 $120,000 $140,000 $160,000 $180,000
Figure 10. Median CEO Salary by Organization Budget Category
Table 23. CEO Salary by Budget Category
Salary
Average
Salary* Salary
$164,000 $140,458 $205,528 $122,500
$137,850 $161,250 $103,000
$104,015 $107,888 $128,000
$80,000 $118,781 $80,000
$75,000 $76,844 $66,500 $60,000
$55,000 $57,706 $47,250 $67,000 $50,000
CEOCompensation:MaricopaandPimaCounties
The average CEO salary in Maricopa County was $108,067, compared with $97,867 in Pima
County. The tables below provide more CEO compensation data within each county.
2013 Nonprofit Compensation and Benefits Highlight Publication 2013 Nonprofit Compensation and Benefits Highlight Publication
Male/Female Differences
in CEO Representation
Sixty-one percent of reporting organizations are
headed by female CEOs (137 organizations),
compared with 39 percent headed by male
CEOs (89 organizations). The graph to the
left shows the percentage of male and female
CEOs across organization budget size. Very
large organizations (above $10 million) are
significantlymorelikelytohaveamaleCEO,while
organizations with budgets under $5 million are
significantly more likely to have a female CEO.
The figure to the right shows
the median salaries of male
and female CEOs across
organization budget category.
Within organizations of
similar budget sizes, there is
not a statistically significant
difference between female
and male executive CEO
salaries. However, the overall
median salary for male CEOs
is $110,000, compared to
$85,000 for female CEOs,
a difference driven by the
disproportionate number of
male CEOs in the largest
organizations (more than $10
million). CEO pay rises directly
with organization size, and
the average budget size of
a nonprofit lead by a female
CEO is $4 million, compared
with $11 million for one led by
a male CEO.
CEO Years of Experience
CEOs of responding organizations reported an average
18 years’ experience in the nonprofit sector. CEOs have
been in their current positions an average of nearly eight
years. Over two-thirds of CEOs were recruited from
outside their organizations (69 percent), the other 31
percent were promoted from within their organization.
Most CEOs (81 percent) were working in the nonprofit
sector prior to taking on their current CEO position, and
19 percent were recruited from outside of the nonprofit
sector.
CEOyearsofexperienceisthesecondvariable(besides
organization budget category) that significantly predicts
CEO pay. More experienced CEOs are paid more,
even in organizations of similar budget sizes. CEOs
are paid an average $1,659 for each additional year of
experience beyond the average 18 years.
female male
Median Salaries of Male and Female CEOs by Organization or Budget Category*
Percent recruited from
within the nonprofit sector
Percent recruited from
outside the nonprofit sector
Percent recruited from
outside their organization
Percent promoted from
within their organization
81%
19%
69%
31%
By Organization Budget
Number of
Responses (n)
Median
Salary
Average
Salary
75% earn
more than
25% earn
more than
Median
Base Salary
More than $10,000,000 22 $165,058 $195,983 $146,000 $222,875 $127,500
$5,000,001 - $10,000,000 20 $152,450 $154,924 $116,648 $181,783 $110,500
$2,500,001 - $5,000,000 24 $103,500 $112,731 $84,000 $140,813 $87,041
$1,000,001 - $2,500,000 36 $90,000 $96,644 $79,861 $113,750 $79,641
$500,001 - $1,000,000 22 $78,300 $81,327 $69,390 $97,113 $67,500
Under $500,000 40 $55,000 $58,475 $45,000 $73,750 $49,000
All Reported Executive
Directors
164 $91,366 $108,067 $68,463 $136,200 $80,000
Maricopa County
By Organization Budget
Number of
Responses (n)
Median
Salary
Average
Salary
75% earn
more than
25% earn
more than
Median
Base Salary
More than $10,000,000 9 $159,500 $163,799 $125,000 $178,681 $100,000
$5,000,001 - $10,000,000 10 $105,500 $109,318 $91,805 $120,250 $92,500
$2,500,001 - $5,000,000 13 $105,000 $109,773 $98,494 $124,000 $100,000
$1,000,001 - $2,500,000 10 $100,000 $104,114 $78,750 $131,857 $82,500
$500,001 - $1,000,000 8 $70,500 $65,701 $52,475 $74,250 $50,000
Under $500,000 16 $54,023 $56,128 $50,000 $60,000 $50,000
All Reported Executive
Directors
66 $95,183 $97,867 $61,500 $122,750 $80,000
Pima County
21 Nonprofit Compensation & Benefits Report 2013
Figure 12. Median Salaries of Male and Female CEOs by Organization Budget Category*
$180,000
$160,000
$140,000
$120,000
$100,000
$80,000
$60,000
$40,000
$20,000
$0
$55,000
$500,000 and
$73,000
$53,000
$75,000
$108,000
$135,620
$165,000
$110,000
$100,000
$124,300
$163,000
$85,000
$500,001 - $1,000,001 - $2,500,001 - $5,000,001 - More than
*Based on the 226 organizations that reported the gender of the CEO and his/her salary.
Note: The number of reported CEOs within each budget category is in parentheses.
21 Nonprofit Compensation & Benefits Report 2013
$180,000
$160,000
$140,000
$120,000
$100,000
$80,000
$60,000
$40,000
$20,000
$0
$55,000
$500,000 and
$73,000
$53,000
$75,000
$108,000
$135,620
$165,000
$110,000
$100,000
$124,300
$163,000
$85,000
$500,001 - $1,000,001 - $2,500,001 - $5,000,001 - More than
female male
CEO Male/Female Representation by Organization Budget Category*
CEO Years of Experience
Os of responding organizations reported an average 18 years’ experience in the nonprofit sector. CEOs have been in their current
sitions an average of nearly eight years. Over two-thirds of CEOs were recruited from outside their organizations (69 percent), the
er 31 percent were promoted from within their organization. Most CEOs (81 percent) were working in the nonprofit sector prior to
ing on their current CEO position, and 19 percent were recruited from outside of the nonprofit sector.
mentioned, CEO years of experience is the second variable (besides organization budget category) that significantly predicts CEO
y. More experienced CEOs are paid more, even in organizations of similar budget sizes. CEOs are paid an average $1,659 for each
ditional year of experience beyond the average 18 years.
Male/Female Differences in CEO Representation
ty-one percent of reporting organizations are headed by female CEOs (137 organizations), compared with 39 percent headed by
le CEOs (89 organizations). Figure 11 shows the percentage of male and female CEOs across organization budget size. Very large
anizations (above $10 million) are significantly more likely to have a male CEO; 72 percent are led by men. Organizations in the $5 to
0 million budget range have a roughly equal number of male and female CEOs, and organizations with budgets under $5 million are
nificantly more likely to have a female CEO, with 70 percent being led by women.
gure 11. CEO Male/Female Representation by Organization Budget Category*
Male

More Related Content

What's hot

Reif Honors Thesis Revised
Reif Honors Thesis RevisedReif Honors Thesis Revised
Reif Honors Thesis RevisedJessica Reif
 
Sp globoforce employee recognition
Sp globoforce employee recognitionSp globoforce employee recognition
Sp globoforce employee recognitionshrm
 
Nonprofits & Fraud: Protecting the People You Serve
Nonprofits & Fraud: Protecting the People You ServeNonprofits & Fraud: Protecting the People You Serve
Nonprofits & Fraud: Protecting the People You ServeMcKonly & Asbury, LLP
 
Girls, Who Run the World? Not yet: Board Gender Diversity in Canada
Girls, Who Run the World? Not yet: Board Gender Diversity in CanadaGirls, Who Run the World? Not yet: Board Gender Diversity in Canada
Girls, Who Run the World? Not yet: Board Gender Diversity in CanadaSkyLaw Professional Corporation
 
14-0765 Executive Briefing Aging Workforce v4
14-0765 Executive Briefing Aging Workforce v414-0765 Executive Briefing Aging Workforce v4
14-0765 Executive Briefing Aging Workforce v4Tam Nguyen
 
Microfinance In Our Backyard
Microfinance In Our BackyardMicrofinance In Our Backyard
Microfinance In Our BackyardACCION East
 
Too big CEO compensation = too little social responsibility
Too big CEO compensation = too little social responsibilityToo big CEO compensation = too little social responsibility
Too big CEO compensation = too little social responsibilityEconomic Policy Dialogue
 
What If Danville Gets a Casino? Risks, Rewards, Uncertainties
What If Danville Gets a Casino? Risks, Rewards, UncertaintiesWhat If Danville Gets a Casino? Risks, Rewards, Uncertainties
What If Danville Gets a Casino? Risks, Rewards, UncertaintiesDanville Regional Foundation
 
Do you want to be a billionaire by @EricPesik
Do you want to be a billionaire by @EricPesikDo you want to be a billionaire by @EricPesik
Do you want to be a billionaire by @EricPesikEric Pesik
 
Bovington - Charity Seminar 2019
Bovington - Charity Seminar 2019Bovington - Charity Seminar 2019
Bovington - Charity Seminar 2019PKF Francis Clark
 
Shrm economic-conditions-financial-health-hiring-ca
Shrm economic-conditions-financial-health-hiring-caShrm economic-conditions-financial-health-hiring-ca
Shrm economic-conditions-financial-health-hiring-caSHRMRESEARCH
 

What's hot (20)

The Trust Agenda
The Trust AgendaThe Trust Agenda
The Trust Agenda
 
Internal vs. External CEOs
Internal vs. External CEOsInternal vs. External CEOs
Internal vs. External CEOs
 
Reif Honors Thesis Revised
Reif Honors Thesis RevisedReif Honors Thesis Revised
Reif Honors Thesis Revised
 
Are CEOs Less Ethical Than in the Past?
Are CEOs Less Ethical Than in the Past?Are CEOs Less Ethical Than in the Past?
Are CEOs Less Ethical Than in the Past?
 
Sp globoforce employee recognition
Sp globoforce employee recognitionSp globoforce employee recognition
Sp globoforce employee recognition
 
Nonprofits & Fraud: Protecting the People You Serve
Nonprofits & Fraud: Protecting the People You ServeNonprofits & Fraud: Protecting the People You Serve
Nonprofits & Fraud: Protecting the People You Serve
 
Girls, Who Run the World? Not yet: Board Gender Diversity in Canada
Girls, Who Run the World? Not yet: Board Gender Diversity in CanadaGirls, Who Run the World? Not yet: Board Gender Diversity in Canada
Girls, Who Run the World? Not yet: Board Gender Diversity in Canada
 
Brochure about Stanford Corporate Governance Research Initiative
Brochure about Stanford Corporate Governance Research InitiativeBrochure about Stanford Corporate Governance Research Initiative
Brochure about Stanford Corporate Governance Research Initiative
 
14-0765 Executive Briefing Aging Workforce v4
14-0765 Executive Briefing Aging Workforce v414-0765 Executive Briefing Aging Workforce v4
14-0765 Executive Briefing Aging Workforce v4
 
Microfinance In Our Backyard
Microfinance In Our BackyardMicrofinance In Our Backyard
Microfinance In Our Backyard
 
At the Crossroads
At the CrossroadsAt the Crossroads
At the Crossroads
 
Too big CEO compensation = too little social responsibility
Too big CEO compensation = too little social responsibilityToo big CEO compensation = too little social responsibility
Too big CEO compensation = too little social responsibility
 
Key Corporate Governance Insights from Stanford Graduate School of Business
Key Corporate Governance Insights from Stanford Graduate School of BusinessKey Corporate Governance Insights from Stanford Graduate School of Business
Key Corporate Governance Insights from Stanford Graduate School of Business
 
What If Danville Gets a Casino? Risks, Rewards, Uncertainties
What If Danville Gets a Casino? Risks, Rewards, UncertaintiesWhat If Danville Gets a Casino? Risks, Rewards, Uncertainties
What If Danville Gets a Casino? Risks, Rewards, Uncertainties
 
CEO Pay Levels Research Spotlight
CEO Pay Levels Research SpotlightCEO Pay Levels Research Spotlight
CEO Pay Levels Research Spotlight
 
Do you want to be a billionaire by @EricPesik
Do you want to be a billionaire by @EricPesikDo you want to be a billionaire by @EricPesik
Do you want to be a billionaire by @EricPesik
 
CEO Attributes and Firm Performance
CEO Attributes and Firm PerformanceCEO Attributes and Firm Performance
CEO Attributes and Firm Performance
 
Bovington - Charity Seminar 2019
Bovington - Charity Seminar 2019Bovington - Charity Seminar 2019
Bovington - Charity Seminar 2019
 
Shrm economic-conditions-financial-health-hiring-ca
Shrm economic-conditions-financial-health-hiring-caShrm economic-conditions-financial-health-hiring-ca
Shrm economic-conditions-financial-health-hiring-ca
 
CEO Succession - Data Spotlight
CEO Succession - Data SpotlightCEO Succession - Data Spotlight
CEO Succession - Data Spotlight
 

Viewers also liked

Maria y inma juegos de portugal
Maria y inma juegos de portugalMaria y inma juegos de portugal
Maria y inma juegos de portugallsanchezs01
 
Rabindranath Tagore Jayanti
Rabindranath Tagore JayantiRabindranath Tagore Jayanti
Rabindranath Tagore Jayantitotalbhakti .com
 
Multi step power point
Multi step power pointMulti step power point
Multi step power point41096322
 
Information Sharing: Sharing information across health and social care. North...
Information Sharing: Sharing information across health and social care. North...Information Sharing: Sharing information across health and social care. North...
Information Sharing: Sharing information across health and social care. North...gillianDH
 
A new universal formula for atoms, planets, and galaxies
A new universal formula for atoms, planets, and galaxiesA new universal formula for atoms, planets, and galaxies
A new universal formula for atoms, planets, and galaxiesIOSR Journals
 
Разрушенная Ценность Брендов
Разрушенная Ценность БрендовРазрушенная Ценность Брендов
Разрушенная Ценность БрендовHieroglifs International
 
Reseña sex-relaciones-de-genero-y-generacion (1)
Reseña sex-relaciones-de-genero-y-generacion (1)Reseña sex-relaciones-de-genero-y-generacion (1)
Reseña sex-relaciones-de-genero-y-generacion (1)puntodocente
 
1POWER Team presentation
1POWER Team presentation1POWER Team presentation
1POWER Team presentationJoseph Jaison
 

Viewers also liked (14)

Presentation3
Presentation3Presentation3
Presentation3
 
Maria y inma juegos de portugal
Maria y inma juegos de portugalMaria y inma juegos de portugal
Maria y inma juegos de portugal
 
Rabindranath Tagore Jayanti
Rabindranath Tagore JayantiRabindranath Tagore Jayanti
Rabindranath Tagore Jayanti
 
Funerals
FuneralsFunerals
Funerals
 
Multi step power point
Multi step power pointMulti step power point
Multi step power point
 
Information Sharing: Sharing information across health and social care. North...
Information Sharing: Sharing information across health and social care. North...Information Sharing: Sharing information across health and social care. North...
Information Sharing: Sharing information across health and social care. North...
 
A new universal formula for atoms, planets, and galaxies
A new universal formula for atoms, planets, and galaxiesA new universal formula for atoms, planets, and galaxies
A new universal formula for atoms, planets, and galaxies
 
Korus Alloys, Mumbai, Metal Profiles
Korus Alloys, Mumbai, Metal Profiles Korus Alloys, Mumbai, Metal Profiles
Korus Alloys, Mumbai, Metal Profiles
 
Midnight rollers 23 - 30.
Midnight rollers 23 - 30.Midnight rollers 23 - 30.
Midnight rollers 23 - 30.
 
CCI Hearts HR: Retaining talent through traineeships
CCI Hearts HR: Retaining talent through traineeshipsCCI Hearts HR: Retaining talent through traineeships
CCI Hearts HR: Retaining talent through traineeships
 
Разрушенная Ценность Брендов
Разрушенная Ценность БрендовРазрушенная Ценность Брендов
Разрушенная Ценность Брендов
 
Reseña sex-relaciones-de-genero-y-generacion (1)
Reseña sex-relaciones-de-genero-y-generacion (1)Reseña sex-relaciones-de-genero-y-generacion (1)
Reseña sex-relaciones-de-genero-y-generacion (1)
 
1POWER Team presentation
1POWER Team presentation1POWER Team presentation
1POWER Team presentation
 
Noticias caso Magistrado Pretelt
Noticias caso Magistrado PreteltNoticias caso Magistrado Pretelt
Noticias caso Magistrado Pretelt
 

Similar to Comp and Bene Highlight Publication 2013-1flipping

Nonprofit compensation & benefits survey shows modest growth in 2015
Nonprofit compensation & benefits survey shows modest growth in 2015Nonprofit compensation & benefits survey shows modest growth in 2015
Nonprofit compensation & benefits survey shows modest growth in 2015Grant Thornton LLP
 
2015 CEO Pay Strategies
2015 CEO Pay Strategies2015 CEO Pay Strategies
2015 CEO Pay StrategiesEric Wang
 
2015 CEO Pay Strategies
2015 CEO Pay Strategies2015 CEO Pay Strategies
2015 CEO Pay StrategiesXiao Bi
 
The Retention Ripple Effect: Nonprofit Staff and Donor Dynamics
The Retention Ripple Effect: Nonprofit Staff and Donor DynamicsThe Retention Ripple Effect: Nonprofit Staff and Donor Dynamics
The Retention Ripple Effect: Nonprofit Staff and Donor DynamicsAggregage
 
Fei 2013 compensation survey
Fei 2013 compensation surveyFei 2013 compensation survey
Fei 2013 compensation surveyBill Velasco
 
Salary survey c level-2018
Salary survey c level-2018Salary survey c level-2018
Salary survey c level-2018Olga Novykova
 
Compensation survey
Compensation surveyCompensation survey
Compensation surveySGA Talent
 
Wait, They Pay People?: Compensation in the Nonprofit Sector (Rutgers)
Wait, They Pay People?:  Compensation in the Nonprofit Sector (Rutgers)Wait, They Pay People?:  Compensation in the Nonprofit Sector (Rutgers)
Wait, They Pay People?: Compensation in the Nonprofit Sector (Rutgers)Church Pension Group
 
Corporate Responsibility 2018 Aura Solution Company Limited
Corporate Responsibility 2018 Aura Solution Company LimitedCorporate Responsibility 2018 Aura Solution Company Limited
Corporate Responsibility 2018 Aura Solution Company Limitedgannuu999
 
Edison International Diversity, Equity and Inclusion report
Edison International Diversity, Equity and Inclusion reportEdison International Diversity, Equity and Inclusion report
Edison International Diversity, Equity and Inclusion reportEdisonInternational
 
Accenture Getting To Equal 2020 Research Presentation
Accenture Getting To Equal 2020 Research Presentation Accenture Getting To Equal 2020 Research Presentation
Accenture Getting To Equal 2020 Research Presentation accenture
 
The Giving Business - CAF Australi payroll giving promo information
The Giving Business - CAF Australi payroll giving promo informationThe Giving Business - CAF Australi payroll giving promo information
The Giving Business - CAF Australi payroll giving promo informationWWF-Australia
 
Salary survey c level-2021
Salary survey c level-2021Salary survey c level-2021
Salary survey c level-2021Kristina Florya
 
13-0245 2013_empbenefits_fnl
13-0245 2013_empbenefits_fnl13-0245 2013_empbenefits_fnl
13-0245 2013_empbenefits_fnlTam Nguyen
 
2013 SHRM Employee Benefits
 2013 SHRM Employee Benefits 2013 SHRM Employee Benefits
2013 SHRM Employee BenefitsSteven Reta
 

Similar to Comp and Bene Highlight Publication 2013-1flipping (20)

Pay for Performance… But Not Too Much Pay: The American Public’s View of CEO Pay
Pay for Performance… But Not Too Much Pay: The American Public’s View of CEO PayPay for Performance… But Not Too Much Pay: The American Public’s View of CEO Pay
Pay for Performance… But Not Too Much Pay: The American Public’s View of CEO Pay
 
Nonprofit compensation & benefits survey shows modest growth in 2015
Nonprofit compensation & benefits survey shows modest growth in 2015Nonprofit compensation & benefits survey shows modest growth in 2015
Nonprofit compensation & benefits survey shows modest growth in 2015
 
2015 CEO Pay Strategies
2015 CEO Pay Strategies2015 CEO Pay Strategies
2015 CEO Pay Strategies
 
2015 CEO Pay Strategies
2015 CEO Pay Strategies2015 CEO Pay Strategies
2015 CEO Pay Strategies
 
The Retention Ripple Effect: Nonprofit Staff and Donor Dynamics
The Retention Ripple Effect: Nonprofit Staff and Donor DynamicsThe Retention Ripple Effect: Nonprofit Staff and Donor Dynamics
The Retention Ripple Effect: Nonprofit Staff and Donor Dynamics
 
FINAL PPT Version.pdf
FINAL PPT Version.pdfFINAL PPT Version.pdf
FINAL PPT Version.pdf
 
2017 compreport non profit
2017 compreport non  profit2017 compreport non  profit
2017 compreport non profit
 
Fei 2013 compensation survey
Fei 2013 compensation surveyFei 2013 compensation survey
Fei 2013 compensation survey
 
Salary survey c level-2018
Salary survey c level-2018Salary survey c level-2018
Salary survey c level-2018
 
Compensation survey
Compensation surveyCompensation survey
Compensation survey
 
Wait, They Pay People?: Compensation in the Nonprofit Sector (Rutgers)
Wait, They Pay People?:  Compensation in the Nonprofit Sector (Rutgers)Wait, They Pay People?:  Compensation in the Nonprofit Sector (Rutgers)
Wait, They Pay People?: Compensation in the Nonprofit Sector (Rutgers)
 
Corporate Responsibility 2018 Aura Solution Company Limited
Corporate Responsibility 2018 Aura Solution Company LimitedCorporate Responsibility 2018 Aura Solution Company Limited
Corporate Responsibility 2018 Aura Solution Company Limited
 
SHRM HR Trend Book (2013)
SHRM HR Trend Book (2013)SHRM HR Trend Book (2013)
SHRM HR Trend Book (2013)
 
Edison International Diversity, Equity and Inclusion report
Edison International Diversity, Equity and Inclusion reportEdison International Diversity, Equity and Inclusion report
Edison International Diversity, Equity and Inclusion report
 
WP EnablingEmployeeEngagement 160607
WP EnablingEmployeeEngagement 160607WP EnablingEmployeeEngagement 160607
WP EnablingEmployeeEngagement 160607
 
Accenture Getting To Equal 2020 Research Presentation
Accenture Getting To Equal 2020 Research Presentation Accenture Getting To Equal 2020 Research Presentation
Accenture Getting To Equal 2020 Research Presentation
 
The Giving Business - CAF Australi payroll giving promo information
The Giving Business - CAF Australi payroll giving promo informationThe Giving Business - CAF Australi payroll giving promo information
The Giving Business - CAF Australi payroll giving promo information
 
Salary survey c level-2021
Salary survey c level-2021Salary survey c level-2021
Salary survey c level-2021
 
13-0245 2013_empbenefits_fnl
13-0245 2013_empbenefits_fnl13-0245 2013_empbenefits_fnl
13-0245 2013_empbenefits_fnl
 
2013 SHRM Employee Benefits
 2013 SHRM Employee Benefits 2013 SHRM Employee Benefits
2013 SHRM Employee Benefits
 

Comp and Bene Highlight Publication 2013-1flipping

  • 1. ASU Lodestar Center for Philanthropy & Nonprofit Innovation Arizona State University College of Public Programs 411 N. Central Ave., Suite 500 Phoenix, AZ 85004-0691 602.496.0500 | nonprofit@asu.edu The mission of the ASU Lodestar Center is to build the capacity of the social sector by enhancing the effectiveness of those who lead, manage, and support nonprofit organizations. lodestar.asu.edu ASU Lodestar Center for Philanthropy & Nonprofit Innovation | Arizona State University 411 North Central Avenue, Suite 500 | Phoenix, Arizona 85004-0691 lodestar.asu.edu nonprofit@asu.edu ASU Lodestar Center for Philanthropy & Nonprofit Innovation highlight nonprofit compensation & benefits2013 reportMaricopa and Pima County Organizations Chief Executive Officers The top executive of a nonprofit organization is often titled Chief Executive Officer; other titles used for this position include Executive Director and President. Of the 237 organizations that responded to the Nonprofit Compensation and Benefits Survey, 231 reported having a full-time CEO and 226 of those reported the CEO’s annual salary. As expected, CEOs are paid higher salaries in organizations with higher annual expenditures (organization budget). In a statistical regression model, organization budget size and CEO years of experience are the only significant predictors of CEO salary. The table below depicts increasing levels of median CEO compensation across organization budget category. The 2013 Nonprofit Compensation and Benefits Report, published by the ASU Lodestar Center for Philanthropy and Nonprofit Innovation, contains compensation data on over 50 nonprofit job categories as well as on findings on employee retirement, insurance, paid time off, and other benefits. It also includes detailed salary and demographic information on nonprofit CEOs. The full report is available for purchase, organizations that completed the survey will receive a complimentary copy. To order the full report, please visit lodestar.asu.edu or call 602.496.0500. Chief Executive Officers: Compensation, Gender Representation, and Experience CEO Salary by Budget Category Copyright © 2013 Arizona Board of Regents for and on behalf of the ASU Lodestar Center for Philanthropy and Nonprofit Innovation, College of Public Programs, Arizona State University. All rights reserved. No part of this publication may be reproduced, stored in a retrieval system, or transmitted in any form or by any means, electronic, mechanical, photocopying, recording, or otherwise without the express written permission of the ASU Lodestar Center, except for brief quotations in critical reviews. 19 Nonprofit Compensation & Benefits Report 2013 Chief Executive Officers The survey included several additional questions about the chief executive officer (CEO), identified as the organization’s top executive and usually titled CEO or executive director. Of the 237 responding organizations, 231 reported having a full-time CEO and 226 of those reported the CEO’s annual salary. As expected, CEOs are paid higher salaries in organizations with higher annual expenditures (organization budget). In a statistical regression model, organization budget size and CEO years of experience are the only significant predictors of CEO salary. Figure 10 depicts increasing levels of median CEO compensation across organization budget category. Table 23 provides more detail on the median, average, and median base (starting) salaries of CEOs across organization budget size. $164,000 $104,015 $75,000 $55,000 $0 $20,000 $40,000 $60,000 $80,000 $100,000 $120,000 $140,000 $160,000 $180,000 Figure 10. Median CEO Salary by Organization Budget Category Table 23. CEO Salary by Budget Category Salary Average Salary* Salary $164,000 $140,458 $205,528 $122,500 $137,850 $161,250 $103,000 $104,015 $107,888 $128,000 $80,000 $118,781 $80,000 $75,000 $76,844 $66,500 $60,000 $55,000 $57,706 $47,250 $67,000 $50,000
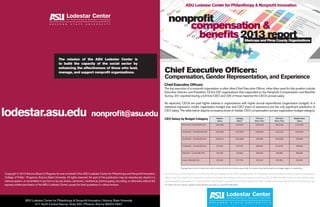
  • 2. CEOCompensation:MaricopaandPimaCounties The average CEO salary in Maricopa County was $108,067, compared with $97,867 in Pima County. The tables below provide more CEO compensation data within each county. 2013 Nonprofit Compensation and Benefits Highlight Publication 2013 Nonprofit Compensation and Benefits Highlight Publication Male/Female Differences in CEO Representation Sixty-one percent of reporting organizations are headed by female CEOs (137 organizations), compared with 39 percent headed by male CEOs (89 organizations). The graph to the left shows the percentage of male and female CEOs across organization budget size. Very large organizations (above $10 million) are significantlymorelikelytohaveamaleCEO,while organizations with budgets under $5 million are significantly more likely to have a female CEO. The figure to the right shows the median salaries of male and female CEOs across organization budget category. Within organizations of similar budget sizes, there is not a statistically significant difference between female and male executive CEO salaries. However, the overall median salary for male CEOs is $110,000, compared to $85,000 for female CEOs, a difference driven by the disproportionate number of male CEOs in the largest organizations (more than $10 million). CEO pay rises directly with organization size, and the average budget size of a nonprofit lead by a female CEO is $4 million, compared with $11 million for one led by a male CEO. CEO Years of Experience CEOs of responding organizations reported an average 18 years’ experience in the nonprofit sector. CEOs have been in their current positions an average of nearly eight years. Over two-thirds of CEOs were recruited from outside their organizations (69 percent), the other 31 percent were promoted from within their organization. Most CEOs (81 percent) were working in the nonprofit sector prior to taking on their current CEO position, and 19 percent were recruited from outside of the nonprofit sector. CEOyearsofexperienceisthesecondvariable(besides organization budget category) that significantly predicts CEO pay. More experienced CEOs are paid more, even in organizations of similar budget sizes. CEOs are paid an average $1,659 for each additional year of experience beyond the average 18 years. female male Median Salaries of Male and Female CEOs by Organization or Budget Category* Percent recruited from within the nonprofit sector Percent recruited from outside the nonprofit sector Percent recruited from outside their organization Percent promoted from within their organization 81% 19% 69% 31% By Organization Budget Number of Responses (n) Median Salary Average Salary 75% earn more than 25% earn more than Median Base Salary More than $10,000,000 22 $165,058 $195,983 $146,000 $222,875 $127,500 $5,000,001 - $10,000,000 20 $152,450 $154,924 $116,648 $181,783 $110,500 $2,500,001 - $5,000,000 24 $103,500 $112,731 $84,000 $140,813 $87,041 $1,000,001 - $2,500,000 36 $90,000 $96,644 $79,861 $113,750 $79,641 $500,001 - $1,000,000 22 $78,300 $81,327 $69,390 $97,113 $67,500 Under $500,000 40 $55,000 $58,475 $45,000 $73,750 $49,000 All Reported Executive Directors 164 $91,366 $108,067 $68,463 $136,200 $80,000 Maricopa County By Organization Budget Number of Responses (n) Median Salary Average Salary 75% earn more than 25% earn more than Median Base Salary More than $10,000,000 9 $159,500 $163,799 $125,000 $178,681 $100,000 $5,000,001 - $10,000,000 10 $105,500 $109,318 $91,805 $120,250 $92,500 $2,500,001 - $5,000,000 13 $105,000 $109,773 $98,494 $124,000 $100,000 $1,000,001 - $2,500,000 10 $100,000 $104,114 $78,750 $131,857 $82,500 $500,001 - $1,000,000 8 $70,500 $65,701 $52,475 $74,250 $50,000 Under $500,000 16 $54,023 $56,128 $50,000 $60,000 $50,000 All Reported Executive Directors 66 $95,183 $97,867 $61,500 $122,750 $80,000 Pima County 21 Nonprofit Compensation & Benefits Report 2013 Figure 12. Median Salaries of Male and Female CEOs by Organization Budget Category* $180,000 $160,000 $140,000 $120,000 $100,000 $80,000 $60,000 $40,000 $20,000 $0 $55,000 $500,000 and $73,000 $53,000 $75,000 $108,000 $135,620 $165,000 $110,000 $100,000 $124,300 $163,000 $85,000 $500,001 - $1,000,001 - $2,500,001 - $5,000,001 - More than *Based on the 226 organizations that reported the gender of the CEO and his/her salary. Note: The number of reported CEOs within each budget category is in parentheses. 21 Nonprofit Compensation & Benefits Report 2013 $180,000 $160,000 $140,000 $120,000 $100,000 $80,000 $60,000 $40,000 $20,000 $0 $55,000 $500,000 and $73,000 $53,000 $75,000 $108,000 $135,620 $165,000 $110,000 $100,000 $124,300 $163,000 $85,000 $500,001 - $1,000,001 - $2,500,001 - $5,000,001 - More than female male CEO Male/Female Representation by Organization Budget Category* CEO Years of Experience Os of responding organizations reported an average 18 years’ experience in the nonprofit sector. CEOs have been in their current sitions an average of nearly eight years. Over two-thirds of CEOs were recruited from outside their organizations (69 percent), the er 31 percent were promoted from within their organization. Most CEOs (81 percent) were working in the nonprofit sector prior to ing on their current CEO position, and 19 percent were recruited from outside of the nonprofit sector. mentioned, CEO years of experience is the second variable (besides organization budget category) that significantly predicts CEO y. More experienced CEOs are paid more, even in organizations of similar budget sizes. CEOs are paid an average $1,659 for each ditional year of experience beyond the average 18 years. Male/Female Differences in CEO Representation ty-one percent of reporting organizations are headed by female CEOs (137 organizations), compared with 39 percent headed by le CEOs (89 organizations). Figure 11 shows the percentage of male and female CEOs across organization budget size. Very large anizations (above $10 million) are significantly more likely to have a male CEO; 72 percent are led by men. Organizations in the $5 to 0 million budget range have a roughly equal number of male and female CEOs, and organizations with budgets under $5 million are nificantly more likely to have a female CEO, with 70 percent being led by women. gure 11. CEO Male/Female Representation by Organization Budget Category* Male