SlideShare a Scribd company logo
1 of 5
Creating a simple stacked column chart – Flex
A post from my blog: http://jbkflex.wordpress.com/2012/01/31/creating-a-simple-stacked-column-chart-
flex/

When I was working with Flex and Action Script 3.0 I used to do a lot of Dashboard and data visualization
applications. One thing that I used to do often was a stacked column chart displaying multi dimensional data. So I
thought of posting an example of creating a stacked chart out of the files deep within my Flex project folders. Let’s
see the demo first and then move on to the explanation.
Demo: http://jbk404.site50.net/flex/playvideo/stackedchart.html


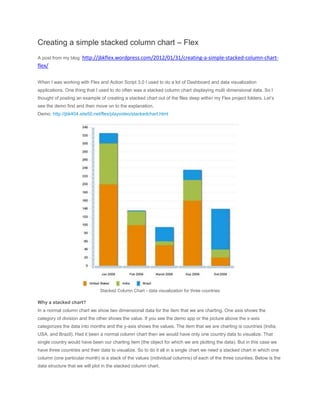
                               Stacked Column Chart - data visualization for three countries

Why a stacked chart?
In a normal column chart we show two dimensional data for the item that we are charting. One axis shows the
category of division and the other shows the value. If you see the demo app or the picture above the x-axis
categorizes the data into months and the y-axis shows the values. The item that we are charting is countries (India,
USA, and Brazil). Had it been a normal column chart then we would have only one country data to visualize. That
single country would have been our charting item (the object for which we are plotting the data). But in this case we
have three countries and their data to visualize. So to do it all in a single chart we need a stacked chart in which one
column (one particular month) is a stack of the values (individual columns) of each of the three counties. Below is the
data structure that we will plot in the stacked column chart,
private var stackedData:ArrayCollection = new ArrayCollection([

{month:"Jan 2009",unitedstates: 200, india:101, brazil: 25},

{month:"Feb 2009",unitedstates: 100, india:34, brazil: 2},

{month:"March 2009",unitedstates: 50, india:10, brazil: 35},

{month:"Sep 2009",unitedstates: 160, india:51, brazil: 25},

{month:"Oct 2009",unitedstates: 20, india:20, brazil: 100},

]);


I will not go into the explanation of each of the classes (such as ArrayCollection) that I am using here, as this example
is meant for someone who is familiar with Flex and ActionScript.
Had we been plotting a normal column chart the data structure would have been something like it is below,

private var data_normal_column_chart:ArrayCollection = new ArrayCollection([

{month:"Jan 2009",india:101},

{month:"Feb 2009",india:34},

{month:"March 2009,india:10},

{month:"Sep 2009",india:51},

{month:"Oct 2009",india:20},

]);


Writing the MXML code – creating the chart component

<mx:VBox width="100%" height="100%">

  <mx:ColumnChart id="chart" width="500" height="500" dataProvider="{stackedData}"
showDataTips="true">

      <mx:horizontalAxis>

        <mx:CategoryAxis categoryField="month"/>

      </mx:horizontalAxis>

      <mx:series>
<mx:ColumnSet type="stacked">

           <mx:ColumnSeries yField="unitedstates" displayName="United States"/>

           <mx:ColumnSeries yField="india" displayName="India"/>

           <mx:ColumnSeries yField="brazil" displayName="Brazil"/>

          </mx:ColumnSet>

     </mx:series>

  </mx:ColumnChart>

  <mx:Legend dataProvider="{chart}" direction="horizontal"/>

</mx:VBox>


To create a stacked chart we have to use the ColumnChart component. You can use the ColumnChart to represent
a variety of different charts including simple columns, clustered columns, stacked, 100% stacked, and high/low. To
visualize the data in our data structure (stackedData) it is data binded to the chart using the dataProvider property.
And then we have set the showDataTips property to true so that a tooltip displays the necessary information for each
column when user moves his mouse over it. The horizontal or the x-axis is a category axis which categorizes the data
by months and I have specified the categoryField to month which is defined in the data. You use
the ColumnSeries chart series with the ColumnChart control to define the data for the chart. A ColumnChart control
expects its series property to contain an array of ColumnSeries objects. Now, to stack the columns use
theColumnSet grouping and set the type property to stacked. There are other options available for type property to
define the grouping behavior of the chart series – clustered, 100%, overlaid. You can check them out in the
ColumnSet link that I have given. You can see in the code that for each ColumnSeries I have specified the data for
the country that it will display in the yField property. The displayName displays the value in the tooltip and the legend.
This is all to create a simple stacked column chart. And finally we have the legend component that shows the chart
legend.
Below is the full source code. You can copy the code and paste it in an .mxml file inside any of your project.

<?xml version="1.0" encoding="utf-8"?>

<s:Application xmlns:fx="http://ns.adobe.com/mxml/2009"

xmlns:s="library://ns.adobe.com/flex/spark"

xmlns:mx="library://ns.adobe.com/flex/mx"

width="100%" height="100%"

pageTitle="Stacked Column Chart">
<fx:Script>

<![CDATA[

import mx.collections.ArrayCollection;


[Bindable]

private var stackedData:ArrayCollection = new ArrayCollection([

{month:"Jan 2009",unitedstates: 200, india:101, brazil: 25},

{month:"Feb 2009",unitedstates: 100, india:34, brazil: 2},

{month:"March 2009",unitedstates: 50, india:10, brazil: 35},

{month:"Sep 2009",unitedstates: 160, india:51, brazil: 25},

{month:"Oct 2009",unitedstates: 20, india:20, brazil: 100},

]);


]]>

</fx:Script>


<mx:VBox width="100%" height="100%">

  <mx:ColumnChart id="chart" width="500" height="500" dataProvider="{stackedData}"
showDataTips="true">

  <mx:horizontalAxis>

      <mx:CategoryAxis categoryField="month"/>

  </mx:horizontalAxis>

  <mx:series>

      <mx:ColumnSet type="stacked">
<mx:ColumnSeries yField="unitedstates" displayName="United States"/>

        <mx:ColumnSeries yField="india" displayName="India"/>

        <mx:ColumnSeries yField="brazil" displayName="Brazil"/>

     </mx:ColumnSet>

  </mx:series>

  </mx:ColumnChart>

  <mx:Legend dataProvider="{chart}" direction="horizontal"/>

</mx:VBox>

</s:Application>


Here is the link to the demo once again: http://jbk404.site50.net/flex/playvideo/stackedchart.html
You can find a detailed tutorial on creating stacked chart- by Adobe in this
link:http://help.adobe.com/en_US/flex/using/WS2db454920e96a9e51e63e3d11c0bf69084-7c6b.html

More Related Content

Recently uploaded

SIP trunking in Janus @ Kamailio World 2024
SIP trunking in Janus @ Kamailio World 2024SIP trunking in Janus @ Kamailio World 2024
SIP trunking in Janus @ Kamailio World 2024Lorenzo Miniero
 
Moving Beyond Passwords: FIDO Paris Seminar.pdf
Moving Beyond Passwords: FIDO Paris Seminar.pdfMoving Beyond Passwords: FIDO Paris Seminar.pdf
Moving Beyond Passwords: FIDO Paris Seminar.pdfLoriGlavin3
 
Generative AI for Technical Writer or Information Developers
Generative AI for Technical Writer or Information DevelopersGenerative AI for Technical Writer or Information Developers
Generative AI for Technical Writer or Information DevelopersRaghuram Pandurangan
 
Digital Identity is Under Attack: FIDO Paris Seminar.pptx
Digital Identity is Under Attack: FIDO Paris Seminar.pptxDigital Identity is Under Attack: FIDO Paris Seminar.pptx
Digital Identity is Under Attack: FIDO Paris Seminar.pptxLoriGlavin3
 
Nell’iperspazio con Rocket: il Framework Web di Rust!
Nell’iperspazio con Rocket: il Framework Web di Rust!Nell’iperspazio con Rocket: il Framework Web di Rust!
Nell’iperspazio con Rocket: il Framework Web di Rust!Commit University
 
Transcript: New from BookNet Canada for 2024: Loan Stars - Tech Forum 2024
Transcript: New from BookNet Canada for 2024: Loan Stars - Tech Forum 2024Transcript: New from BookNet Canada for 2024: Loan Stars - Tech Forum 2024
Transcript: New from BookNet Canada for 2024: Loan Stars - Tech Forum 2024BookNet Canada
 
Merck Moving Beyond Passwords: FIDO Paris Seminar.pptx
Merck Moving Beyond Passwords: FIDO Paris Seminar.pptxMerck Moving Beyond Passwords: FIDO Paris Seminar.pptx
Merck Moving Beyond Passwords: FIDO Paris Seminar.pptxLoriGlavin3
 
How AI, OpenAI, and ChatGPT impact business and software.
How AI, OpenAI, and ChatGPT impact business and software.How AI, OpenAI, and ChatGPT impact business and software.
How AI, OpenAI, and ChatGPT impact business and software.Curtis Poe
 
From Family Reminiscence to Scholarly Archive .
From Family Reminiscence to Scholarly Archive .From Family Reminiscence to Scholarly Archive .
From Family Reminiscence to Scholarly Archive .Alan Dix
 
SAP Build Work Zone - Overview L2-L3.pptx
SAP Build Work Zone - Overview L2-L3.pptxSAP Build Work Zone - Overview L2-L3.pptx
SAP Build Work Zone - Overview L2-L3.pptxNavinnSomaal
 
The State of Passkeys with FIDO Alliance.pptx
The State of Passkeys with FIDO Alliance.pptxThe State of Passkeys with FIDO Alliance.pptx
The State of Passkeys with FIDO Alliance.pptxLoriGlavin3
 
New from BookNet Canada for 2024: BNC CataList - Tech Forum 2024
New from BookNet Canada for 2024: BNC CataList - Tech Forum 2024New from BookNet Canada for 2024: BNC CataList - Tech Forum 2024
New from BookNet Canada for 2024: BNC CataList - Tech Forum 2024BookNet Canada
 
Streamlining Python Development: A Guide to a Modern Project Setup
Streamlining Python Development: A Guide to a Modern Project SetupStreamlining Python Development: A Guide to a Modern Project Setup
Streamlining Python Development: A Guide to a Modern Project SetupFlorian Wilhelm
 
Are Multi-Cloud and Serverless Good or Bad?
Are Multi-Cloud and Serverless Good or Bad?Are Multi-Cloud and Serverless Good or Bad?
Are Multi-Cloud and Serverless Good or Bad?Mattias Andersson
 
Transcript: New from BookNet Canada for 2024: BNC CataList - Tech Forum 2024
Transcript: New from BookNet Canada for 2024: BNC CataList - Tech Forum 2024Transcript: New from BookNet Canada for 2024: BNC CataList - Tech Forum 2024
Transcript: New from BookNet Canada for 2024: BNC CataList - Tech Forum 2024BookNet Canada
 
New from BookNet Canada for 2024: Loan Stars - Tech Forum 2024
New from BookNet Canada for 2024: Loan Stars - Tech Forum 2024New from BookNet Canada for 2024: Loan Stars - Tech Forum 2024
New from BookNet Canada for 2024: Loan Stars - Tech Forum 2024BookNet Canada
 
Take control of your SAP testing with UiPath Test Suite
Take control of your SAP testing with UiPath Test SuiteTake control of your SAP testing with UiPath Test Suite
Take control of your SAP testing with UiPath Test SuiteDianaGray10
 
The Ultimate Guide to Choosing WordPress Pros and Cons
The Ultimate Guide to Choosing WordPress Pros and ConsThe Ultimate Guide to Choosing WordPress Pros and Cons
The Ultimate Guide to Choosing WordPress Pros and ConsPixlogix Infotech
 
Tampa BSides - Chef's Tour of Microsoft Security Adoption Framework (SAF)
Tampa BSides - Chef's Tour of Microsoft Security Adoption Framework (SAF)Tampa BSides - Chef's Tour of Microsoft Security Adoption Framework (SAF)
Tampa BSides - Chef's Tour of Microsoft Security Adoption Framework (SAF)Mark Simos
 
unit 4 immunoblotting technique complete.pptx
unit 4 immunoblotting technique complete.pptxunit 4 immunoblotting technique complete.pptx
unit 4 immunoblotting technique complete.pptxBkGupta21
 

Recently uploaded (20)

SIP trunking in Janus @ Kamailio World 2024
SIP trunking in Janus @ Kamailio World 2024SIP trunking in Janus @ Kamailio World 2024
SIP trunking in Janus @ Kamailio World 2024
 
Moving Beyond Passwords: FIDO Paris Seminar.pdf
Moving Beyond Passwords: FIDO Paris Seminar.pdfMoving Beyond Passwords: FIDO Paris Seminar.pdf
Moving Beyond Passwords: FIDO Paris Seminar.pdf
 
Generative AI for Technical Writer or Information Developers
Generative AI for Technical Writer or Information DevelopersGenerative AI for Technical Writer or Information Developers
Generative AI for Technical Writer or Information Developers
 
Digital Identity is Under Attack: FIDO Paris Seminar.pptx
Digital Identity is Under Attack: FIDO Paris Seminar.pptxDigital Identity is Under Attack: FIDO Paris Seminar.pptx
Digital Identity is Under Attack: FIDO Paris Seminar.pptx
 
Nell’iperspazio con Rocket: il Framework Web di Rust!
Nell’iperspazio con Rocket: il Framework Web di Rust!Nell’iperspazio con Rocket: il Framework Web di Rust!
Nell’iperspazio con Rocket: il Framework Web di Rust!
 
Transcript: New from BookNet Canada for 2024: Loan Stars - Tech Forum 2024
Transcript: New from BookNet Canada for 2024: Loan Stars - Tech Forum 2024Transcript: New from BookNet Canada for 2024: Loan Stars - Tech Forum 2024
Transcript: New from BookNet Canada for 2024: Loan Stars - Tech Forum 2024
 
Merck Moving Beyond Passwords: FIDO Paris Seminar.pptx
Merck Moving Beyond Passwords: FIDO Paris Seminar.pptxMerck Moving Beyond Passwords: FIDO Paris Seminar.pptx
Merck Moving Beyond Passwords: FIDO Paris Seminar.pptx
 
How AI, OpenAI, and ChatGPT impact business and software.
How AI, OpenAI, and ChatGPT impact business and software.How AI, OpenAI, and ChatGPT impact business and software.
How AI, OpenAI, and ChatGPT impact business and software.
 
From Family Reminiscence to Scholarly Archive .
From Family Reminiscence to Scholarly Archive .From Family Reminiscence to Scholarly Archive .
From Family Reminiscence to Scholarly Archive .
 
SAP Build Work Zone - Overview L2-L3.pptx
SAP Build Work Zone - Overview L2-L3.pptxSAP Build Work Zone - Overview L2-L3.pptx
SAP Build Work Zone - Overview L2-L3.pptx
 
The State of Passkeys with FIDO Alliance.pptx
The State of Passkeys with FIDO Alliance.pptxThe State of Passkeys with FIDO Alliance.pptx
The State of Passkeys with FIDO Alliance.pptx
 
New from BookNet Canada for 2024: BNC CataList - Tech Forum 2024
New from BookNet Canada for 2024: BNC CataList - Tech Forum 2024New from BookNet Canada for 2024: BNC CataList - Tech Forum 2024
New from BookNet Canada for 2024: BNC CataList - Tech Forum 2024
 
Streamlining Python Development: A Guide to a Modern Project Setup
Streamlining Python Development: A Guide to a Modern Project SetupStreamlining Python Development: A Guide to a Modern Project Setup
Streamlining Python Development: A Guide to a Modern Project Setup
 
Are Multi-Cloud and Serverless Good or Bad?
Are Multi-Cloud and Serverless Good or Bad?Are Multi-Cloud and Serverless Good or Bad?
Are Multi-Cloud and Serverless Good or Bad?
 
Transcript: New from BookNet Canada for 2024: BNC CataList - Tech Forum 2024
Transcript: New from BookNet Canada for 2024: BNC CataList - Tech Forum 2024Transcript: New from BookNet Canada for 2024: BNC CataList - Tech Forum 2024
Transcript: New from BookNet Canada for 2024: BNC CataList - Tech Forum 2024
 
New from BookNet Canada for 2024: Loan Stars - Tech Forum 2024
New from BookNet Canada for 2024: Loan Stars - Tech Forum 2024New from BookNet Canada for 2024: Loan Stars - Tech Forum 2024
New from BookNet Canada for 2024: Loan Stars - Tech Forum 2024
 
Take control of your SAP testing with UiPath Test Suite
Take control of your SAP testing with UiPath Test SuiteTake control of your SAP testing with UiPath Test Suite
Take control of your SAP testing with UiPath Test Suite
 
The Ultimate Guide to Choosing WordPress Pros and Cons
The Ultimate Guide to Choosing WordPress Pros and ConsThe Ultimate Guide to Choosing WordPress Pros and Cons
The Ultimate Guide to Choosing WordPress Pros and Cons
 
Tampa BSides - Chef's Tour of Microsoft Security Adoption Framework (SAF)
Tampa BSides - Chef's Tour of Microsoft Security Adoption Framework (SAF)Tampa BSides - Chef's Tour of Microsoft Security Adoption Framework (SAF)
Tampa BSides - Chef's Tour of Microsoft Security Adoption Framework (SAF)
 
unit 4 immunoblotting technique complete.pptx
unit 4 immunoblotting technique complete.pptxunit 4 immunoblotting technique complete.pptx
unit 4 immunoblotting technique complete.pptx
 

Featured

2024 State of Marketing Report – by Hubspot
2024 State of Marketing Report – by Hubspot2024 State of Marketing Report – by Hubspot
2024 State of Marketing Report – by HubspotMarius Sescu
 
Everything You Need To Know About ChatGPT
Everything You Need To Know About ChatGPTEverything You Need To Know About ChatGPT
Everything You Need To Know About ChatGPTExpeed Software
 
Product Design Trends in 2024 | Teenage Engineerings
Product Design Trends in 2024 | Teenage EngineeringsProduct Design Trends in 2024 | Teenage Engineerings
Product Design Trends in 2024 | Teenage EngineeringsPixeldarts
 
How Race, Age and Gender Shape Attitudes Towards Mental Health
How Race, Age and Gender Shape Attitudes Towards Mental HealthHow Race, Age and Gender Shape Attitudes Towards Mental Health
How Race, Age and Gender Shape Attitudes Towards Mental HealthThinkNow
 
AI Trends in Creative Operations 2024 by Artwork Flow.pdf
AI Trends in Creative Operations 2024 by Artwork Flow.pdfAI Trends in Creative Operations 2024 by Artwork Flow.pdf
AI Trends in Creative Operations 2024 by Artwork Flow.pdfmarketingartwork
 
PEPSICO Presentation to CAGNY Conference Feb 2024
PEPSICO Presentation to CAGNY Conference Feb 2024PEPSICO Presentation to CAGNY Conference Feb 2024
PEPSICO Presentation to CAGNY Conference Feb 2024Neil Kimberley
 
Content Methodology: A Best Practices Report (Webinar)
Content Methodology: A Best Practices Report (Webinar)Content Methodology: A Best Practices Report (Webinar)
Content Methodology: A Best Practices Report (Webinar)contently
 
How to Prepare For a Successful Job Search for 2024
How to Prepare For a Successful Job Search for 2024How to Prepare For a Successful Job Search for 2024
How to Prepare For a Successful Job Search for 2024Albert Qian
 
Social Media Marketing Trends 2024 // The Global Indie Insights
Social Media Marketing Trends 2024 // The Global Indie InsightsSocial Media Marketing Trends 2024 // The Global Indie Insights
Social Media Marketing Trends 2024 // The Global Indie InsightsKurio // The Social Media Age(ncy)
 
Trends In Paid Search: Navigating The Digital Landscape In 2024
Trends In Paid Search: Navigating The Digital Landscape In 2024Trends In Paid Search: Navigating The Digital Landscape In 2024
Trends In Paid Search: Navigating The Digital Landscape In 2024Search Engine Journal
 
5 Public speaking tips from TED - Visualized summary
5 Public speaking tips from TED - Visualized summary5 Public speaking tips from TED - Visualized summary
5 Public speaking tips from TED - Visualized summarySpeakerHub
 
ChatGPT and the Future of Work - Clark Boyd
ChatGPT and the Future of Work - Clark Boyd ChatGPT and the Future of Work - Clark Boyd
ChatGPT and the Future of Work - Clark Boyd Clark Boyd
 
Getting into the tech field. what next
Getting into the tech field. what next Getting into the tech field. what next
Getting into the tech field. what next Tessa Mero
 
Google's Just Not That Into You: Understanding Core Updates & Search Intent
Google's Just Not That Into You: Understanding Core Updates & Search IntentGoogle's Just Not That Into You: Understanding Core Updates & Search Intent
Google's Just Not That Into You: Understanding Core Updates & Search IntentLily Ray
 
Time Management & Productivity - Best Practices
Time Management & Productivity -  Best PracticesTime Management & Productivity -  Best Practices
Time Management & Productivity - Best PracticesVit Horky
 
The six step guide to practical project management
The six step guide to practical project managementThe six step guide to practical project management
The six step guide to practical project managementMindGenius
 
Beginners Guide to TikTok for Search - Rachel Pearson - We are Tilt __ Bright...
Beginners Guide to TikTok for Search - Rachel Pearson - We are Tilt __ Bright...Beginners Guide to TikTok for Search - Rachel Pearson - We are Tilt __ Bright...
Beginners Guide to TikTok for Search - Rachel Pearson - We are Tilt __ Bright...RachelPearson36
 

Featured (20)

2024 State of Marketing Report – by Hubspot
2024 State of Marketing Report – by Hubspot2024 State of Marketing Report – by Hubspot
2024 State of Marketing Report – by Hubspot
 
Everything You Need To Know About ChatGPT
Everything You Need To Know About ChatGPTEverything You Need To Know About ChatGPT
Everything You Need To Know About ChatGPT
 
Product Design Trends in 2024 | Teenage Engineerings
Product Design Trends in 2024 | Teenage EngineeringsProduct Design Trends in 2024 | Teenage Engineerings
Product Design Trends in 2024 | Teenage Engineerings
 
How Race, Age and Gender Shape Attitudes Towards Mental Health
How Race, Age and Gender Shape Attitudes Towards Mental HealthHow Race, Age and Gender Shape Attitudes Towards Mental Health
How Race, Age and Gender Shape Attitudes Towards Mental Health
 
AI Trends in Creative Operations 2024 by Artwork Flow.pdf
AI Trends in Creative Operations 2024 by Artwork Flow.pdfAI Trends in Creative Operations 2024 by Artwork Flow.pdf
AI Trends in Creative Operations 2024 by Artwork Flow.pdf
 
Skeleton Culture Code
Skeleton Culture CodeSkeleton Culture Code
Skeleton Culture Code
 
PEPSICO Presentation to CAGNY Conference Feb 2024
PEPSICO Presentation to CAGNY Conference Feb 2024PEPSICO Presentation to CAGNY Conference Feb 2024
PEPSICO Presentation to CAGNY Conference Feb 2024
 
Content Methodology: A Best Practices Report (Webinar)
Content Methodology: A Best Practices Report (Webinar)Content Methodology: A Best Practices Report (Webinar)
Content Methodology: A Best Practices Report (Webinar)
 
How to Prepare For a Successful Job Search for 2024
How to Prepare For a Successful Job Search for 2024How to Prepare For a Successful Job Search for 2024
How to Prepare For a Successful Job Search for 2024
 
Social Media Marketing Trends 2024 // The Global Indie Insights
Social Media Marketing Trends 2024 // The Global Indie InsightsSocial Media Marketing Trends 2024 // The Global Indie Insights
Social Media Marketing Trends 2024 // The Global Indie Insights
 
Trends In Paid Search: Navigating The Digital Landscape In 2024
Trends In Paid Search: Navigating The Digital Landscape In 2024Trends In Paid Search: Navigating The Digital Landscape In 2024
Trends In Paid Search: Navigating The Digital Landscape In 2024
 
5 Public speaking tips from TED - Visualized summary
5 Public speaking tips from TED - Visualized summary5 Public speaking tips from TED - Visualized summary
5 Public speaking tips from TED - Visualized summary
 
ChatGPT and the Future of Work - Clark Boyd
ChatGPT and the Future of Work - Clark Boyd ChatGPT and the Future of Work - Clark Boyd
ChatGPT and the Future of Work - Clark Boyd
 
Getting into the tech field. what next
Getting into the tech field. what next Getting into the tech field. what next
Getting into the tech field. what next
 
Google's Just Not That Into You: Understanding Core Updates & Search Intent
Google's Just Not That Into You: Understanding Core Updates & Search IntentGoogle's Just Not That Into You: Understanding Core Updates & Search Intent
Google's Just Not That Into You: Understanding Core Updates & Search Intent
 
How to have difficult conversations
How to have difficult conversations How to have difficult conversations
How to have difficult conversations
 
Introduction to Data Science
Introduction to Data ScienceIntroduction to Data Science
Introduction to Data Science
 
Time Management & Productivity - Best Practices
Time Management & Productivity -  Best PracticesTime Management & Productivity -  Best Practices
Time Management & Productivity - Best Practices
 
The six step guide to practical project management
The six step guide to practical project managementThe six step guide to practical project management
The six step guide to practical project management
 
Beginners Guide to TikTok for Search - Rachel Pearson - We are Tilt __ Bright...
Beginners Guide to TikTok for Search - Rachel Pearson - We are Tilt __ Bright...Beginners Guide to TikTok for Search - Rachel Pearson - We are Tilt __ Bright...
Beginners Guide to TikTok for Search - Rachel Pearson - We are Tilt __ Bright...
 

Creating a simple stacked column chart – Flex

  • 1. Creating a simple stacked column chart – Flex A post from my blog: http://jbkflex.wordpress.com/2012/01/31/creating-a-simple-stacked-column-chart- flex/ When I was working with Flex and Action Script 3.0 I used to do a lot of Dashboard and data visualization applications. One thing that I used to do often was a stacked column chart displaying multi dimensional data. So I thought of posting an example of creating a stacked chart out of the files deep within my Flex project folders. Let’s see the demo first and then move on to the explanation. Demo: http://jbk404.site50.net/flex/playvideo/stackedchart.html Stacked Column Chart - data visualization for three countries Why a stacked chart? In a normal column chart we show two dimensional data for the item that we are charting. One axis shows the category of division and the other shows the value. If you see the demo app or the picture above the x-axis categorizes the data into months and the y-axis shows the values. The item that we are charting is countries (India, USA, and Brazil). Had it been a normal column chart then we would have only one country data to visualize. That single country would have been our charting item (the object for which we are plotting the data). But in this case we have three countries and their data to visualize. So to do it all in a single chart we need a stacked chart in which one column (one particular month) is a stack of the values (individual columns) of each of the three counties. Below is the data structure that we will plot in the stacked column chart,
  • 2. private var stackedData:ArrayCollection = new ArrayCollection([ {month:"Jan 2009",unitedstates: 200, india:101, brazil: 25}, {month:"Feb 2009",unitedstates: 100, india:34, brazil: 2}, {month:"March 2009",unitedstates: 50, india:10, brazil: 35}, {month:"Sep 2009",unitedstates: 160, india:51, brazil: 25}, {month:"Oct 2009",unitedstates: 20, india:20, brazil: 100}, ]); I will not go into the explanation of each of the classes (such as ArrayCollection) that I am using here, as this example is meant for someone who is familiar with Flex and ActionScript. Had we been plotting a normal column chart the data structure would have been something like it is below, private var data_normal_column_chart:ArrayCollection = new ArrayCollection([ {month:"Jan 2009",india:101}, {month:"Feb 2009",india:34}, {month:"March 2009,india:10}, {month:"Sep 2009",india:51}, {month:"Oct 2009",india:20}, ]); Writing the MXML code – creating the chart component <mx:VBox width="100%" height="100%"> <mx:ColumnChart id="chart" width="500" height="500" dataProvider="{stackedData}" showDataTips="true"> <mx:horizontalAxis> <mx:CategoryAxis categoryField="month"/> </mx:horizontalAxis> <mx:series>
  • 3. <mx:ColumnSet type="stacked"> <mx:ColumnSeries yField="unitedstates" displayName="United States"/> <mx:ColumnSeries yField="india" displayName="India"/> <mx:ColumnSeries yField="brazil" displayName="Brazil"/> </mx:ColumnSet> </mx:series> </mx:ColumnChart> <mx:Legend dataProvider="{chart}" direction="horizontal"/> </mx:VBox> To create a stacked chart we have to use the ColumnChart component. You can use the ColumnChart to represent a variety of different charts including simple columns, clustered columns, stacked, 100% stacked, and high/low. To visualize the data in our data structure (stackedData) it is data binded to the chart using the dataProvider property. And then we have set the showDataTips property to true so that a tooltip displays the necessary information for each column when user moves his mouse over it. The horizontal or the x-axis is a category axis which categorizes the data by months and I have specified the categoryField to month which is defined in the data. You use the ColumnSeries chart series with the ColumnChart control to define the data for the chart. A ColumnChart control expects its series property to contain an array of ColumnSeries objects. Now, to stack the columns use theColumnSet grouping and set the type property to stacked. There are other options available for type property to define the grouping behavior of the chart series – clustered, 100%, overlaid. You can check them out in the ColumnSet link that I have given. You can see in the code that for each ColumnSeries I have specified the data for the country that it will display in the yField property. The displayName displays the value in the tooltip and the legend. This is all to create a simple stacked column chart. And finally we have the legend component that shows the chart legend. Below is the full source code. You can copy the code and paste it in an .mxml file inside any of your project. <?xml version="1.0" encoding="utf-8"?> <s:Application xmlns:fx="http://ns.adobe.com/mxml/2009" xmlns:s="library://ns.adobe.com/flex/spark" xmlns:mx="library://ns.adobe.com/flex/mx" width="100%" height="100%" pageTitle="Stacked Column Chart">
  • 4. <fx:Script> <![CDATA[ import mx.collections.ArrayCollection; [Bindable] private var stackedData:ArrayCollection = new ArrayCollection([ {month:"Jan 2009",unitedstates: 200, india:101, brazil: 25}, {month:"Feb 2009",unitedstates: 100, india:34, brazil: 2}, {month:"March 2009",unitedstates: 50, india:10, brazil: 35}, {month:"Sep 2009",unitedstates: 160, india:51, brazil: 25}, {month:"Oct 2009",unitedstates: 20, india:20, brazil: 100}, ]); ]]> </fx:Script> <mx:VBox width="100%" height="100%"> <mx:ColumnChart id="chart" width="500" height="500" dataProvider="{stackedData}" showDataTips="true"> <mx:horizontalAxis> <mx:CategoryAxis categoryField="month"/> </mx:horizontalAxis> <mx:series> <mx:ColumnSet type="stacked">
  • 5. <mx:ColumnSeries yField="unitedstates" displayName="United States"/> <mx:ColumnSeries yField="india" displayName="India"/> <mx:ColumnSeries yField="brazil" displayName="Brazil"/> </mx:ColumnSet> </mx:series> </mx:ColumnChart> <mx:Legend dataProvider="{chart}" direction="horizontal"/> </mx:VBox> </s:Application> Here is the link to the demo once again: http://jbk404.site50.net/flex/playvideo/stackedchart.html You can find a detailed tutorial on creating stacked chart- by Adobe in this link:http://help.adobe.com/en_US/flex/using/WS2db454920e96a9e51e63e3d11c0bf69084-7c6b.html