10 Banking Metrics Explained
•Download as PPTX, PDF•
333 likes•110,115 views

The document discusses 10 important banking metrics for evaluating bank performance and value. It defines each metric and provides details on what numbers are considered good. Return on equity measures profitability and banks generally want to see over 10%. Return on assets also measures profitability but doesn't reflect leverage like return on equity. Net interest margin shows how much a bank earns from its invested assets. The efficiency ratio measures operating expenses to see if a bank is a low-cost operator.

Recommended
More Related Content
What's hot
What's hot (20)
Similar to 10 Banking Metrics Explained
Similar to 10 Banking Metrics Explained (20)
Recently uploaded
Recently uploaded (20)
10 Banking Metrics Explained
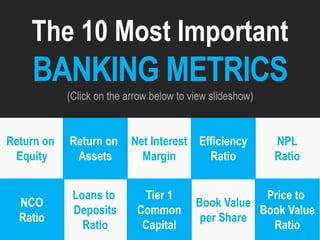
- 1. Return on Assets Return on Equity Efficiency Ratio Net Interest Margin NPL Ratio Book Value per Share Loans to Deposits Ratio NCO Ratio Tier 1 Common Capital Price to Book Value Ratio The 10 Most Important BANKING METRICS (Click on the arrow below to view slideshow)
- 2. Return on Equity: This is the most important metric in all of bank investing. It measures profitability by dividing a bank’s net income by its shareholders’ equity; the higher the number, the greater the return. Normally, you want to see a figure in excess of 10%, which is generally assumed to mark the threshold between long-term value creation and destruction. Slideshow by John J. Maxfield, The Motley Fool
- 3. Return on Assets: This number is similar to return on equity but it doesn’t reflect the impact of a bank’s leverage. Because banks are typically leveraged by a factor of 10 to 1, in order to generate a 10% return on equity, a bank must earn the equivalent of at least 1% on its assets. This has long been one of the bank industry’s most commonly cited benchmarks. Slideshow by John J. Maxfield, The Motley Fool
- 4. Net Interest Margin: A bank is a leveraged fund that borrows money at low short-term rates and then invests the funds into higher interest-earning assets. By doing so, a bank earns “net interest income.” If you divide this by a bank’s earning assets, you get its net interest margin, which shows how much the business yields on its invested assets. Slideshow by John J. Maxfield, The Motley Fool
- 5. Efficiency Ratio: Warren Buffett has intimated in the past that there are two ways a bank can generate outsized returns, one of which is to be a “very low-cost operator.” A bank’s success at managing expenses is gauged by the efficiency ratio, which divides a bank’s operating expenses by its net revenue -- lower is better. Ideally, you’re looking for ratios under 60%. Slideshow by John J. Maxfield, The Motley Fool
- 6. Nonperforming Loans Ratio: Because banks are so leveraged, it’s critical that they only invest in assets with little risk of default. Analysts use the NPL ratio to measure how lenders perform in this regard. It’s calculated by dividing a bank’s nonperforming loans by total loans. A good rule of thumb is that the NPL ratio should be less than 1% through all stages of the credit cycle. Slideshow by John J. Maxfield, The Motley Fool
- 7. Net Charge-Off Ratio: A close cousin of the NPL ratio, the NCO ratio measures what happens after loans actually default, triggering a bank’s obligation to charge the loans off against its capital. Because this metric factors in the recovery of collateral, a bank’s NCO ratio should be smaller than its NPL ratio. If not, the bank probably isn’t focusing enough on collections. Slideshow by John J. Maxfield, The Motley Fool
- 8. Loan-to-Deposit Ratio: This metric expresses a bank’s loans as a percent of deposits. In doing so, its purpose is to measure liquidity. Banks with a high ratio have less core funding to cover withdrawals or other exigencies that arise. Banks with too low of a ratio aren’t maximizing the spread between their cost of funds and interest on earning assets. Slideshow by John J. Maxfield, The Motley Fool
- 9. Tier 1 Common Capital Ratio: Regulators assess a bank’s strength first by looking at the size and composition of its capital base. The most important metric in this regard is the tier 1 common capital ratio, which compares a bank’s core equity capital (common stock less most types of preferred stock) to its risk-weighted assets. The regulatory minimum is 4.5%. Slideshow by John J. Maxfield, The Motley Fool
- 10. Book Value per Share: When you purchase shares of a bank, you’re staking a claim to a portion of its shareholders’ equity, or book value. The size of that claim is a function of (1) the number of shares you buy, and (2) the amount of book value each share entitles you to. As the next slide explains, this metric plays a leading role in the valuation of bank stocks. Slideshow by John J. Maxfield, The Motley Fool
- 11. Price-to-Book-Value Ratio: To determine how much you should pay for a bank’s shares, you look to the price-to-book-value ratio. Depending on where we’re at in the credit cycle, a typical bank’s shares will trade for between 0.5 to 2.5 times book value, with 1 times book value serving generally as the minimum threshold for banks that earn at least 10% on their equity. Slideshow by John J. Maxfield, The Motley Fool
- 12. Return on Assets Return on Equity Efficiency Ratio Net Interest Margin NPL Ratio Book Value per Share Loans to Deposits Ratio NCO Ratio Tier 1 Common Capital Price to Book Value Ratio Looking for more information like this? The Motley Fool’s mission is to help the world invest better. We’ve done this for 20 years by thinking long term and outside the box – even if that means turning Wall Street on its head. To learn more about what The Motley Fool thinks about current investment trends, and receive a special free report about what might be the next big industry to come out of Silicon Valley, just click here now.