Saratoga Investment Corp. January 2016 Profile
•Download as PPTX, PDF•
0 likes•163 views

Henri Steenkamp dives into the total assets and key stats for Saratoga Investment Corp. (SAR) as of January 2016.

Recommended
More Related Content
What's hot
What's hot (19)
Viewers also liked
Viewers also liked (11)
Similar to Saratoga Investment Corp. January 2016 Profile
Similar to Saratoga Investment Corp. January 2016 Profile (20)
More from Henri Steenkamp CA (SA)
More from Henri Steenkamp CA (SA) (11)
Recently uploaded
Recently uploaded (15)
Saratoga Investment Corp. January 2016 Profile
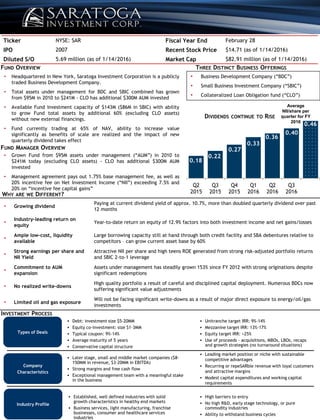
- 1. China’s leading provider of advanced testing technologies and related services Ticker NYSE: SAR Fiscal Year End February 28 IPO 2007 Recent Stock Price $14.71 (as of 1/14/2016) Diluted S/O 5.69 million (as of 1/14/2016) Market Cap $82.91 million (as of 1/14/2016) INVESTMENT PROCESS Debt: investment size $5-20MM Equity co-investment: size $1-3MM Typical coupon: 9%-14% Average maturity of 5 years Conservative capital structure Unitranche target IRR: 9%-14% Mezzanine target IRR: 13%-17% Equity target IRR: >25% Use of proceeds - acquisitions, MBOs, LBOs, recaps and growth strategies (no turnaround situations) Later stage, small and middle market companies ($8- 150MM in revenue, $3-20MM in EBITDA) Strong margins and free cash flow Exceptional management team with a meaningful stake in the business Leading market position or niche with sustainable competitive advantages Recurring or repeSARble revenue with loyal customers and attractive margins Modest capital expenditures and working capital requirements Established, well defined industries with solid growth characteristics in healthy end markets Business services, light manufacturing, franchise businesses, consumer and healthcare services industries High barriers to entry No high R&D, early stage technology, or pure commodity industries Ability to withstand business cycles Types of Deals Company Characteristics Industry Profile • Headquartered in New York, Saratoga Investment Corporation is a publicly traded Business Development Company. • Total assets under management for BDC and SBIC combined has grown from $95M in 2010 to $241M - CLO has additional $300M AUM invested • Available Fund investment capacity of $143M ($86M in SBIC) with ability to grow Fund total assets by additional 60% (excluding CLO assets) without new external financings. • Fund currently trading at 65% of NAV, ability to increase value significantly as benefits of scale are realized and the impact of new quarterly dividend takes effect • Business Development Company (“BDC”) • Small Business Investment Company (“SBIC”) • Collateralized Loan Obligation fund (“CLO”) WHY ARE WE DIFFERENT? • ►Growing dividend Paying at current dividend yield of approx. 10.7%, more than doubled quarterly dividend over past 12 months • ► Industry-leading return on equity Year-to-date return on equity of 12.9% factors into both investment income and net gains/losses • ► Ample low-cost, liquidity available Large borrowing capacity still at hand through both credit facility and SBA debentures relative to competitors – can grow current asset base by 60% • ► Strong earnings per share and NII Yield Attractive NII per share and high teens ROE generated from strong risk-adjusted portfolio returns and SBIC 2-to-1 leverage • ► Commitment to AUM expansion Assets under management has steadily grown 153% since FY 2012 with strong originations despite significant redemptions • ►No realized write-downs High quality portfolio a result of careful and disciplined capital deployment. Numerous BDCs now suffering significant value adjustments • ►Limited oil and gas exposure Will not be facing significant write-downs as a result of major direct exposure to energy/oil/gas investments $1.00 DIVIDENDS CONTINUE TO RISE FUND OVERVIEW THREE DISTINCT BUSINESS OFFERINGS • Grown Fund from $95M assets under management (“AUM”) in 2010 to $241M today (excluding CLO assets) - CLO has additional $300M AUM invested • Management agreement pays out 1.75% base management fee, as well as 20% incentive fee on Net Investment Income (“NII”) exceeding 7.5% and 20% on “incentive fee capital gains” FUND MANAGER OVERVIEW 0.18 0.22 0.27 0.33 0.36 0.40 0.46 Q2 2015 Q3 2015 Q4 2015 Q1 2016 Q2 2016 Q3 2016 Average NII/share per quarter for FY 2016
- 2. FOR ADDITIONAL INFORMATION: At SAR Investment Corporation Henri Steenkamp, Chief Financial Officer hsteenkamp@saratogapartners.com Investor Relations The Equity Group Inc. Jeremy Hellman, Senior Associate Adam Prior, Senior Vice President (212) 836-9626 (212) 836-9606 jhellman@equityny.com aprior@equityny.com This may contain statements about future events and expectations that constitute forward- looking statements. Forward-looking statements are based on SAR managements’ beliefs, assumptions and expectations of future events and economic performance, considering information currently available to management. These statements are not statements of historical fact. Forward-looking statements involve risks and uncertainties that may cause actual results, performance or financial condition to differ materially from the expectations expressed or implied in any forward-looking statement. SAR does not assume any obligation to update or revise forward-looking statements, whether as a result of new information, future events or otherwise. Anyone receiving this is encouraged to review all filings made by the Company with the Securities and Exchange Commission. The information contained herein is being provided for informational purposes only and does not constitute a solicitation to buy or sell any securities. The Equity Group provides investor relations services for SAR and other clients. The Equity Group, its officers or employees may have a position in the securities of these companies or may have received options to acquire such securities. SIGNIFICANT DRY POWDER AVAILABLE PORTFOLIO COMPOSITION AND YIELD Portfolio Composition – $241m (Based on Fair Values as of November 30, 2015) Portfolio Yield – 11.2% (Weighted Average Current Yield of Existing Portfolio) DIVERSIFICATION ACROSS INDUSTRY AND GEOGRAPHY Investments diversified geographically Investments across 12 distinct industries * Ability to grow AUM by over 60% without any new external financing Syndicated 6.6% First Lien 60.4% Second Lien 18.1% Structured Finance Securities 6.6% Common Equity 8.9% Syndicated 7.2% First Lien 10.9% Second Lien 10.6% CLO 18.9% Common Equity N/A Southeast Midwest Northeast West Other International Business Services Consumer Services Software as a Service Healthcare Services Media Structured Finance Metals Automotive Aftermarket Consumer Products Food and Beverage Building Products Education