1. www.ccsenet.org/ijbm
International Journal of Business and Management
Vol. 6, No. 5; May 2011
Strategic Analysis through the General Electric/McKinsey
Matrix: An Application to the Italian Fashion Industry
Cesare Amatulli (Corresponding author)
Professor of Fashion Marketing
Faculty of Education Science, University of Bari
Piazza Umberto I, 70121, Bari, Italy
Tel: 39-80-497-0060
E-mail: c.amatulli@formazione.uniba.it
Tiziana Caputo
Research Assistant of Marketing
Department of Business, Law and Environmental Studies, University of Salento
Via per Monteroni, 73100, Lecce, Italy
Tel: 39-83-273-2234
E-mail: tiziana_caputo@libero.it
Gianluigi Guido
Full Professor of Marketing
Department of Business, Law and Environmental Studies, University of Salento
Via per Monteroni, 73100, Lecce, Italy
Tel: 39-83-233-2665
Received: November 3, 2010
E-mail: gianluigi.guido@unisalento.it
Accepted: December 7, 2010
doi:10.5539/ijbm.v6n5p61
Abstract
Introduced in the early Seventies as a specific framework for the evaluation of investment opportunities as part
of product portfolio management, the General Electric/McKinsey Matrix is still widely used for the analysis of
competitive scenarios. In this study, this managerial tool is applied to the apparel sector and four well-known
Italian fashion companies are analyzed. The procedure for creating the matrix is described and a detailed
presentation is made, for each company over a five-year-period, of the results relative to the two typical
dimensions of the matrix: business competitiveness and industry attractiveness. Considering the current tendency
of the majority of fashion and luxury companies to internationalize and develop multi-product and multi-brand
diversification strategies, this study may be useful for marketers working in these sectors who intend to develop
positioning and competitiveness analyses. Additionally, given the limited amount of academic studies on the
application of this matrix to the fashion industry, this study can help fill that gap and describe the state of the art
in the field, enriching the literature on the subject and creating new points of departure for future research. The
paper presents results that, although they are based on a limited selection of companies, provide an accurate
demonstration of the methodology applied and highlight a few differences found between the companies
examined; in particular, between fashion brands with a very high positioning (“couture”) and those with a
medium/high positioning (“diffusion” or “ready-to-wear”).
Keywords: General Electric/McKinsey Matrix, Fashion marketing, Luxury brands, Business strengths, Industry
attractiveness, Product-portfolio analysis, Competitive marketing
1. Introduction
It is well known that the traditional “transactional” marketing has been replaced by the “relational” marketing (cf.
Grönroos, 1997), which is based on the capability to attract customers and create a relationship, it refers also to
Published by Canadian Center of Science and Education
61
2. www.ccsenet.org/ijbm
International Journal of Business and Management
Vol. 6, No. 5; May 2011
Customer Relationship Marketing (CRM). In the relational approach, marketing doesn’t refer to just one single
managerial function, but it assumes a central role for all company activities, at all levels. Other kinds of
marketing approaches have been introduced but all are associated with the “inductional” nature of marketing
(Guido, 2005, 2010). Therefore, a marketing with the aim to totally involve customers and make them willing to
buy. This kind of approach has its main successful application into integrated and competitive marketing models.
In particular, in the marketing field, competitive analysis tools can be very useful in an international economic
context, like the present one, which increasingly requires companies to rationalize investments and develop
organizational flexibility (Kotler & Caslione, 2009). It is well-known that, “when a company decides to
formulate a marketing strategy, the managers responsible need to assess the status of its strategic business units
in the marketplace” (Jan, 2002, p. 269). Marketing efforts must also aim at analyzing both the internal company
potential (the so-called core competences) and the potential of the competition, so as to be able to specialize and
establish strategic collaboration agreements (Prahalad & Hamel, 1990). To achieve these goals, analyses have
two main objectives: (1) to identify the boundaries of the competition, so as to define the strategic sphere within
which the company will operate; (2) to analyze the competition, defined as the set of competitors operating
within the same strategic sphere (Bergen & Peteraf, 2002).
It is common knowledge that companies operate in many different kinds of external market conditions, amid
environmental forces largely outside the control and influence of the business. These can be summarized by the
acronym PEST – political, economic, social, and technological (Cooper, 2000; Jan, 2002). Since this strategy
emerged as a managerial discipline in the 1960s, one of the main problems that entrepreneurs and managers have
had to face is that of finding the tools best able to understand “where” and “how” their companies should
compete, grow and be managed. Models and tools, both strategic and organizational, based on analysis
(qualitative e quantitative) aimed at the definition of intuitions, potential scenarios and possible solutions, have
helped management to make decisions in these areas.
In particular, one of the industries where competitive analysis and business assessment tools are now particularly
necessary and useful is that of fashion. Generally, fashion “refers to styles of dress (but can also include cuisine,
literature, art, architecture, and general comportment) that are popular in a culture at any given time” (Corbellini
& Saviolo, 2009, p. 4). Indeed, fashion plays a key role in our social life “by recreating the rhythm of the seasons
that was done away with by urbanization, and a social differentiation while avoiding being engulfed by the
anonymous crowd” (Kapferer & Bastien, 2009, p. 315). In this paper, fashion refers to clothes (apparel and
accessories), in particular to couture, ready-to-wear and accessories (Fionda & Moore, 2009), also identified – in
the high-end market – as “soft luxury” goods (Carcano & Catalani, 2007). In recent decades the fashion industry
has been characterized by significant changes: consumers are now more selective and more value-oriented, new
markets such as India and China are growing and new affluent people are looking for luxury goods – with
different characteristics and needs than Western customers, large international vertically integrated chains with
their own brands have appeared, independent multi-brand stores have been replaced by mono-brand stores with
the mission of protecting the values of the brand (Brun et al. 2008), CRM and new innovative communication
tools have become critical for success (Corbellini & Saviolo, 2009). The present-day competitive system has
become more complex, competitors have become bigger and more international, “luxury fashion originates from
more sources, both in terms of design and production” and “it is distributed all over the world” (Brun et al. 2008,
p. 556). In particular for EU markets, “the opening to imports and the removal of trade barriers against imports,
part of the ongoing globalization and liberalization trends” have exposed manufacturers to more competition
from low labor cost countries (Taplin & Winterton, 2004, p. 258). Nowadays, companies need to convey to
customers the right “reason why” to purchase their products. The brand represents one of a company’s most
important assets and allows leading companies to target new segments and to extend into new product categories.
Therefore, correctly managing the relationship between core and extended product categories is more and more
important for fashion companies. Moreover, fashion – and more precisely of luxury fashion goods – became “a
consolidated economic sector in the late 1990s, led by the vision of conglomerates such as LVMH, Gucci Group
and Richemont” (Okonkwo, 2009, p. 287). Consequently, to become and remain a market leader, many apparel
companies must move beyond managing product design and brand image, they must also have aggressive and
sophisticated business strategies to successfully manage a multiple brand portfolio. Especially for fashion luxury
products, “the emotional factors have been gaining more and more importance, as customers are looking for
goods that are characterized by reliable performance and perfection of detail, but at the same time they want to
be emotionally involved and feel a complete and memorable shopping and ownership experience” (Brun et al.
2008, p. 556). Therefore, according to the inductional marketing approach, all competitive marketing analyses
and strategies must take into account the significant role played by customer experience.
62
ISSN 1833-3850
E-ISSN 1833-8119
3. www.ccsenet.org/ijbm
International Journal of Business and Management
Vol. 6, No. 5; May 2011
A valid tool, which offers a clear and concise means to relate the company’s business to that of its competitors,
is the General Electric/McKinsey Matrix – also called the GE/McKinsey Matrix (Porter, 1982; Abell &
Hammond, 1986). The goal of this study is to describe this tool and present an application of it to the fashion
industry so as to offer the marketing managers in this sector a valid methodology for analyzing competitors,
resources and opportunities so as to better address decision-making issues linked to differentiation of products
and multi-product or multi-brand managerial strategies. Additionally, the study outlines a brief holistic vision of
fashion industry dynamics, analyzing the particular characteristics and competitive and attractiveness position
that each competitor examined occupies within this competitive dynamic.
2. Competitive analysis in the fashion industry
The growing number of multi-business companies (McKinsey & Company, 2008) incorporated in recent decades
has made it necessary for these same companies to manage and keep profitable various Strategic Business Units
(SBUs) – “a grouping of functional units that have the responsibility for profit (or losses) of part of the
organization’s core businesses” (Kerzner, 2009, p. 128) – that have become increasingly autonomous both
strategically and in terms of functional support (Chakravarthy & Henderson, 2007). In response to this complex
issue, the classic and still valid GE/McKinsey Matrix stands out among the various alternatives introduced, in
particular by consulting companies. However, various aspects of portfolio planning models have been strongly
criticized when used in diversified companies; in particular, because they are subject to multiple free
interpretations (Wind et al., 1983), additionally for the absence of descriptive elements relative to the potential
collaborative relationship between the various SBUs, and for the lack of meaningful directives in terms of a
concrete approach to dealing with the competition (Gluck & Kauffman, 1979). In the past, also academic
research began to focus on the relationships between diversification strategies and company performance
(Ramanujam & Varadarajan, 1989), in particular in an attempt to show how companies characterized by a
portfolio of unrelated activities (conglomerates) or by a series of vertically integrated activities are less
productive than companies with a portfolio of correlated activities (Rumelt, 1982). Nevertheless, even though
some attempts to apply market analysis frameworks to the fashion business can be found – e.g., the Ansoff
matrix (Chiari, 2009, p. 46), there is no one particular study in the literature that points out, through a
methodological application, the potential of the GE/McKinsey Matrix in the managerial sphere specific to
companies that operate in the fashion industry, in terms of decision-making support for strategies of both
portfolio and competitive analyses. Indeed, it is well-known that there has been a worldwide trend in recent
decades toward internationalization of fashion companies (particularly in the luxury market); and the
development of diversification strategies based on an increase in the number of products and/or brands held in
their portfolios (Amatulli, 2009). These are strategies which are successful, in particular for multi-brands and
particularly in the long-term if accompanied by reasoning that is not purely financial, the correct vision of the
sectorial specificity and right balance between brand autonomy and integration (Carcano & Rovetta, 2009). At
the same time, the competitive scenario has widened both in terms of market – with the new B.R.I.C. (Brazil,
Russia, India, and China) emerging markets – and in terms of competitors – with new firms coming out of
markets still developing their specialization or which were simply too far away previously (Jin, 2004; Taplin &
Winterton, 2004). This evolution of the fashion industry market points out the need, even more clearly, for
organizations operating in this sector to know about and use to their best advantage analysis tools that have
already been proven effective and relatively rapid to use. Based on these premises, the GE/McKinsey Matrix
seems to be a useful tools for achieving a higher level of organization and allocation of resources, production
efficiency, knowledge of competitive scenarios and, as a result, competitive advantages.
3. Methodology
In the field of competitive marketing (O’Shaughnessy, 1995; Paley, 1999) three strategic levels are usually
identified within a company (Boyd & Walker, 1990; Hofer & Schendler, 1978): the corporate level, the level of
the SBUs, and the functional (or operative) level. In this study, the corporate level strategies are considered to be
particularly important for those companies that are newly formed or which want to redesign their development
strategies.
To reach the goal of specialization, different market segments are identified, generally narrower than the sector
in which the company operates, each of these segments is called a Strategic Business Area (SBA). To the SBU is
given the responsibility to develop the company’s competitive position in one or more connected SBAs, with the
aim to guarantee market specialization and a high level of control of the company’s activities (Jonk, 2007).
The company must be able to allocate its financial resources so as to achieve the best possible results. An
analysis of the product portfolio helps company management to make decisions regarding the distribution of its
Published by Canadian Center of Science and Education
63
4. www.ccsenet.org/ijbm
International Journal of Business and Management
Vol. 6, No. 5; May 2011
financial resources among the various markets in which it operates (Day, 1977). The GE/McKinsey Matrix,
developed by the General Electric (GE) industrial group in collaboration with the McKinsey consulting firm
(Robinson et al., 1978), is one of the most commonly used product-portfolios models.
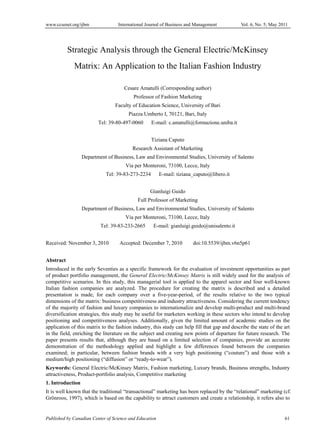
It is a nine-cell (three by three) multi-factor matrix used to perform business portfolio analysis as one of the steps
in the strategic planning process. It has two dimensions; across the horizontal axis is Industry Attractiveness (IA)
and along the vertical axis is, Business Strengths (BS). Industry attractiveness measures market potential in terms
of growth in sales and profits. Business strengths, instead, measures the current strengths of an organization in
the market, it is based on the objective evaluation of the ability that the organization has to satisfy market needs,
as compared to its competitors (McDonald, 2007). The GE/McKinsey model can be used for basic analysis and
strategic planning in conjunction with, or in alternative to, other tools such as the S.W.O.T. Analysis and the
Boston Consulting Group (BCG) Growth Share Matrix (Chakravarthy & Henderson, 2007; Jan, 2002), but is,
however, different. Indeed, it uses multiple factors to define the two dimensions (industry attractiveness and
competitiveness), in this way overcoming one of the main limits of the BCG Growth Share Matrix (Peters, 1993).
Each dimension is made up of a group of factors, some which can be evaluated objectively and others which can
be evaluated subjectively. The various company SBUs are represented by circles proportional to their sales
revenues and are positioned in boxes representative of their various levels of attractiveness (see Figure 1).
Insert Figure 1
The choice of the companies to be analyzed in this study was based on a criterion which considered the
following objective characteristics to be necessary: (1) core business linked to the fashion industry; (2) a brand
of Italian origin with a strong national connotation (Made in Italy); (3) an internationally recognized brand; (4) a
brand with at least 25 years of history; (5) an Italian owned company; (6) sales revenues in the last observed year
of at least 100 million euros; (7) at least 250 employees in the last observed year. In general, the companies
analyzed can be conceptually distributed in price ranges as follows: high (Valentino), medium-high (Armani,
Moschino) and medium-low (Benetton). In terms of stylistic identity the analyzed brands can be classified as:
elegant (Valentino), classic (Armani), avant-garde (Moschino), and casual (Benetton). From a more specialized
point of view, and considering that many companies nowadays offer different brands and collections and,
therefore, fairly diversified prices for each market segment, the companies analyzed could be positioned
(considering a price segmentation) as: couture (Valentino), ready-to-wear designer (Armani, Moschino) and
mass market (Benetton) (Corbellini & Saviolo, 2009). The five-year-period considered for the analysis
(1998–2002) was chosen because it is representative of the late 1990s and the first years after the turn of the
century; a significant period during which the European clothing industry continued to undergo the profound and
rapid “restructuring” (and “reconfiguration”) which had begun in the early 1990s – trends that further exposed
the Italian fashion sector to changes (Taplin & Winterton, 2004). (Note 1)
4. Analysis: application to Italian fashion companies
4.1 Factors
The values of the factors that make up the dimensions of the GE/McKinsey Matrix are transformed into ratings
considering the values of the other competitors. The software used in this study to obtain a representation of the
data on the GE/McKinsey Matrix is the Marketing Engineering (Lilien & Rangaswamy, 2004). This software, in
its version 1.2, uses a scale from 1 to 5 to assign ratings to the various values. Rating 5 indicates the highest
value and rating 1 indicates the lowest. On the basis of a criterion of proportionality, the rest of the values
considered were converted into ratings. Each factor was assigned a weight in relationship to the importance the
factor has for the company in the sector of activity being considered (Hofer & Schendel, 1978).
4.2 Weights
The weight of the factor is independent of the value assigned to the factor itself, it is assigned on the basis of
knowledge of the market and the company by the person drawing up the matrix. The weights are also distributed
on a scale of 1 to 5. The assignment of weight equal to 1 indicates that the factor was considered of little
importance in the determination of Industry Attractiveness or Business Strengths; a weight of 5, instead,
indicates that the factor was considered essential. The intermediate values represent different graduations of the
two extreme considered values.
4.3 Turnovers
The value of sales is the only measure in this software which is converted on a scale of 1 to 25. The modality for
assigning ratings to the various values of turnovers is different from the modality used for assigning the ratings
to the other factors: only the highest rating, 25, is assigned. This value is the basis on which the following
64
ISSN 1833-3850
E-ISSN 1833-8119
5. www.ccsenet.org/ijbm
International Journal of Business and Management
Vol. 6, No. 5; May 2011
proportions will be based so as to assign the ratings to the remaining factors. Sales, differently from the other
factors considered, is the only factor not weighed. It is evaluated only through the assignment of a value and not
through the determination of a weight.
5. Results
5.1 Industry attractiveness
The factors taken into consideration for the determination of Industry Attractiveness were Annual market growth
rate and Employment because they were felt to be those which best represent the dimension of the matrix
examined. In particular, Annual market growth rate is a value that allows for the verification of growth or loss in
a company’s market share. Employment allows for the verification of a company’s capacity to readjust its
workforce to its needs, a capacity that is the result of a series of company adjustments that are also tied to the
sector as a whole: recruitment, selection, and remuneration of personnel create, on the one hand, a work market
within the company, and, on the other hand, ease the ties and contacts with the external market. The values of the
factors taken into consideration are the result of the average of the five-year-period. Tables 1, 2, 3 and 4
summarize the values of the factors considered.
Insert Table 1
Insert Table 2
Insert Table 3
Insert Table 4
5.1.1 Annual Market Growth Rate
The measurement of market growth over the five years is an average of 1.5 percentage points. However, it is
important to point out that there was a strong heterogeneity of market growth across the years examined. A
market growth of 7.1% in Y3 contrasts with a 2.5% loss in Y5 (Hermes Lab, 2003). Since this is a mature sector,
a high weight (5) was assigned to this factor, as the ability to increase its own market share is an essential
element for a company that wants to remain competitive.
Armani: there was a slight recovery of +5.6% in Y5, after a slowdown in Y4 (only +4.3%) as compared to the
strong growth in Y3 (+8.5%) and Y2 (+9.9%). The value of the factor was converted into a rating of 1.19.
Benetton: Y5 saw a downturn of -2.9 percentage points. From Y1 to Y4, on the contrary, the company had
enjoyed a sustained growth in revenues (+12.4% in Y2, +8.5% in Y3, +9% in Y4). The value of the factor was
assigned a rating of 1.
Moschino: from Y3 to Y5 it recorded continuous growth which, in Y5, reached two-figure percentages (+18.5%),
which compensated for the setback suffered in Y2 (-5%). The average settled around 6%. The value of the factor
was converted into a rating of 1.07.
Valentino: Y5 saw a +3.6% increase of share, very little if you consider that Y3 was a year of particular
expansion with +106.5%. Additionally, from Y1, the year of its incorporation, the company’s share developed
with two-figure percentages (+15.3% in Y2 and +43.7% in Y4). Therefore, the average is very high: 42.2%. A
rating of 5 was assigned to the factor.
5.1.2 Employment (number of employees)
The outsourcing of a few areas of production caused the loss of many jobs, falling from one million posts in Y1
to 923 000 in Y5 (Hermes Lab, 2003). The weight of this factor is important in the evaluation of Industry
Attractiveness, above all, because the relative costs, affecting revenues, make it possible to evaluate the capacity
of the internal company organization to obtain results from the united efforts of the individuals who work with
the company. Therefore, it was assigned a weight of 3.
Armani: costs remained more or less unchanged between Y3 and Y5 (21.6 million euros in Y5 with a 14.9%
influence on revenues). Over the five years, the average number of staff increased (284 employees in Y5, 271 in
Y4, 255 in Y1). The transfer of a few employees to other companies was balanced by the increase of the
workforce, leaving costs unaltered. The value of the factor was assigned a rating of 1.
Benetton: in Y5 there was a reduction of 1.6% in personnel costs, determined mostly by a reduction in the
number of employees (from 2 697 in Y2 to 2 406 in Y5) as a result of both technological development and
production outsourcing. Instead, from Y1 to Y4 these costs increased following the normal growth in the cost of
labor (around 3%). The value of the factor was assigned a rating of 5.
Published by Canadian Center of Science and Education
65
6. www.ccsenet.org/ijbm
International Journal of Business and Management
Vol. 6, No. 5; May 2011
Moschino: the influence of labor on total revenues was basically constant, settling at around 13.4%. The average
workforce, in the five years analyzed, was 580 employees, with a slight decrease in Y5 as the result of the
assignment of a branch of the company to another company. The value of the factor was converted into a rating
of 1.55.
Valentino: in Y5 the cost of labor came to 17.1 million euros, as compared to 14.1 million euros in Y4.
Nevertheless, there had been a constant growth of these costs since Y1 (9.5 million euro), because of the
constant increase in the workforce which in Y1 numbered 247 employees and reached 381 in Y5. The value of
the factor was converted into a rating of 1.18. For an overview of the data, see Table 5.
Insert Table 5
5.2 Company competitiveness
The factors taken into consideration for the determination of Company Competitiveness are the Gross Operating
Margin, the Operating Income, the Net Profit, the Leftovers, the Availability Index, Accounts Receivable
Turnover, Accounts Payable Turnover, Return on Investment (R.O.I.). The values taken into consideration are
the result of the average for the five-year-period. Tables 6, 7, 8 and 9 summarize the values of the factors
considered.
Insert Table 6
Insert Table 7
Insert Table 8
Insert Table 9
5.2.1 Gross Operating Margin
Gross Operating Margin is very important in the determination of Company Competitiveness, it was assigned a
weight of 5.
Armani: Y5 saw an increase in comparison with Y4 (28.4 million euros in Y5, with an influence on revenues of
19.8%, as compared to 17.6 million euros in Y4 with 12.9% influence on revenues). The increase in absolute
value was 61.4% and is explained by both the growth of revenues and the policy of control and containment of
operating costs put into place by the company. The value of the factor was converted into a rating of 1.29.
Benetton: in Y5 there was a slight decrease due to increased sales of raw and semifinished materials to
production companies abroad, this determined a smaller margin in comparison with sales of finished products to
end clients (581.7 million euros in Y5 with a 30.3% influence on revenues, as compared to 648.8 million euros
in Y4, with a 32.8% influence on revenues). Nevertheless, with 550 million euros, Y5 was somewhat higher than
average operating margins for Y1 Y3. The value of the factor was assigned a rating of 5.
Moschino: in constant growth, even in Y5 (14% as compared to 12.3% in Y4 and 9.8% in Y3). However, as an
absolute value it increased 17.6%, much lower than the values of the preceding years (47.7% in Y4, 70% in Y3).
The value of the factor was converted into a rating of 1.23.
Valentino: the trend in revenues, together with the increase in structure costs to support development plans, only
allowed for a positive result in Y4 (1.0 million euros with a 0.9% influence on revenues). In the previous fiscal
year, the general drop in consumption, together with the costs and investments sustained particularly in the retail
area, made for a constantly negative result with a strong impact on revenues (-13.1 million euros in Y3 with a
-17.1% influence on revenues; -11.9 million euros in Y2 with a -32% influence on revenues). The factor value
was assigned a rating of 1.
5.2.2 Operating Income
This is an essential factor in the determination of Company Competitiveness, so it was assigned a weight of 5.
Armani: in Y5 there were earnings of 19.6 euro, with a 13.5% influence on revenues. A slight recovery, in
contrast with the net drop from Y1 (29.2 million euro) to Y4 (12.1 million euro), because of greater costs in
promotional-advertising investments and personnel. The factor value was converted to 2.34.
Benetton: saw a downturn in Y5 (214.1 million euro with an 11.1% influence on revenues) as compared to the
previous years’ average of 243 million euro with a 13% influence on revenues. The factor value was converted
to 2.25.
66
ISSN 1833-3850
E-ISSN 1833-8119
7. www.ccsenet.org/ijbm
International Journal of Business and Management
Vol. 6, No. 5; May 2011
Moschino: its performance here was better than its Gross Operating Margin. Between Y3 and Y5 the influence
on revenues doubled (from 5.3% in Y3 to 11% in Y5); in absolute value it reached its peak in Y4 with a
percentage of 103.8%. The factor value was assigned a rating of 5.
Valentino: the consistently negative trend inevitably felt the effects of the investments made for the previously
determined plan to open and renew various direct retail stores. The -9 million euro in Y5 (with -7.9% influence
on revenues) worsened the situation in Y4 (-3.2 million euros with a -2.9% influence on revenues). The worst
results are registered for Y3 and Y2: -17 million euros in Y3 and -16.3 million euro in Y2, with a -22.2% and
-43.9% influence on revenues respectively. The factor value was assigned a rating of 1.
5.2.3 Net Profit
Net Profit is a highly important factor for determining Company Competitiveness, it was assigned a weight of 5.
Armani: a substantial improvement was seen in Y5, with a value of 173 million euros, compared with the
average of 83 million euros over the four preceding years. Profit benefited not only from improvements in
operative management, but in particular from the significant increase in the balance of the financial management.
The factor value was assigned a rating of 5.
Benetton: it decreased during the last four years analyzed; from 242 million euro in Y2 it fell to -2.8 million euro
in Y5. The factor value was converted to 4.8.
Moschino: a positive Y5 (9.1 million euro), led to three-figure growth rates (+116.5%). Net Profit was already
positive in Y4 with 4.2 million euros (and with a growth rate of +145%), after the strong influence of the
extraordinary phenomena of devaluation which led to a loss of -9.4 million euros in Y3. The factor value was
converted to 1.83.
Valentino: in drastic decline, from year to year, it felt the effects of management issues related to the company
reorganization, and extraordinary facts such as, in Y5, the early suspension of licensing relationships. In Y5, Net
Profit was -42 million euros in comparison with the average of -22.6 million euros of the preceding four fiscal
years. For all five years, the influence on revenues was, on average, 40.4%. The factor value was assigned a
rating of 1.
5.2.4 Leftovers
Leftovers quantitatively determines the value of efficiency in productivity planning to the point that it allows for
the return in liquid form of warehouse stock over the course of a fiscal year. The factor value was assigned a
rating of 3.
Armani: there were no substantial variations over the course of the five years. In Y5 it reached 869 million euros,
not far off of the average of 914.8 million. The factor value was converted to 1.185.
Benetton: in decline in the last four years analyzed, from 169.5 million euros in Y2 they reached 120.2 million
euros in Y5. The factor value was assigned a rating of 1.
Moschino: the net reduction of the value of the Leftovers for fiscal year Y5 (15.7 million euros in comparison
with an average of 18 million euros in the four preceding years) was due to the decrease related to work in
progress and finished products. The factor value was assigned a rating of 5.
Valentino: the value of the Leftovers increased in the last two fiscal years analyzed (14770 million euros in Y5
and 13562 million euros in Y4) as compared with an average of 3256 million euros of the fiscal years Y1 Y3.
This is due to the profound transformation of the current management that the company underwent starting in Y3.
The factor value was converted to 3.47.
5.2.5 Availability Index
It is advisable that the value of the index exceed the value of one to be able to express a balanced situation. The
importance that the factor has in determining Company Competitiveness lies in its ability to allow for the
formulation of opinions on the conditions of company financial equilibrium. It was assigned a high weight: 4.
Armani: Y5 saw an index of 0.6. With an index of 0.4 in Y4, a lower profitability was recorded in the last two
years observed. This is an inversion of tendency in comparison with the excellent performance in the
three-year-period Y1 Y3, where the index greatly exceeded the value of one (2.7 in Y3, 3.3 in Y2), sign of a
high level of company equilibrium. The factor value was assigned a rating of 5.
Benetton: very close to the value of one in Y5 with a value of 0.9, in Y4 the index underwent a downturn of 0.7.
Decidedly better in Y1 (1.53) and Y2 (1.7), in Y3 it was steady at 1.03. The factor value was converted to 3.2.
Published by Canadian Center of Science and Education
67
8. www.ccsenet.org/ijbm
International Journal of Business and Management
Vol. 6, No. 5; May 2011
Moschino: Y5 saw a clear improvement, with an index of 0.82, in comparison with the three preceding years in
which the company had an average of 0.50. Equilibrium was only achieved in Y1, with an index of 1.15. The
factor value was converted to 1.7.
Valentino: it suffered from a slight downturn only in Y5, with a value of 0.2, in comparison with the average of
0.8 in the preceding years. The factor value was assigned a rating of 1.
5.2.6 Accounts Receivable Turnover
From a financial point of view, it is desirable to speed up the return of activities to liquid form since, shortening
the duration of the monetary cycle, the activity seems less risky. The importance of the factor in determining
Company Competitiveness is high: 4.
Armani: with an index of 29.4%, in Y5 the company improved in comparison with the declining trend of the
years from Y2 (62.8%) to Y4 (16.8%).The factor value was converted to 1.17.
Benetton: the average of 44.7% was basically unchanged, even in Y5 (44.6%). A serious downturn in Y3, with
an index of 9.2%, was recovered in the following fiscal years. The factor value was converted to 1.3.
Moschino: the average of this index, over the five years, settles at around 20% with peaks as high as 25% in Y5.
The factor value was assigned a rating of 1.
Valentino: from Y1 to Y5 the value of this index continually dropped and, in the four years preceding Y5,
reached very high percentages with an average of 340%, reaching 32.1% in the last year. The factor value was
assigned a rating of 5.
5.2.7 Accounts Payable Turnover
This factor makes it possible to evaluate the company’s level of exposure and risk with regard to the various
types of financial backers: it was assigned a weight of 4.
Armani: the percentage increased in the last two years analyzed, with an index of 111.3% in Y4 and 122.1% in
Y5. This reversed the decreasing trend of fiscal years Y1 (67.1%) to Y3 (24.4%). The factor value was converted
to 4.81.
Benetton: with an average of 74.7% in the last three years analyzed, Y5 was also in line with this tendency with
an index of 76.8%. The factor value was assigned a rating of 5.
Moschino: over the five years the index was in growth, starting in Y1 with an index of 15% on up to the 35% of
Y5, with an average of 23%. The factor value was assigned a rating of 1.
Valentino: this factor was much more stable than the Accounts Receivable Turnover, and maintained an average
of 20% over the Y1 Y4 period. It then reflected a slight improvement in management in Y5 with an index of
27.3%. The factor value was converted to 1.04.
5.2.8 Return on Investment (R.O.I.)
This factor was given a weight of 5, due to its high level of importance in the determination of Company
Competitiveness, since it evaluates the company’s ability to produce satisfying economic results starting from a
certain amount of resources used in the various company activities.
Armani: it tended to decrease consistently. In Y1 the index was 7.8%, in Y5 it was 4%, with the greatest
reduction in Y4 with an index of 2.27%. The factor value was assigned a rating of 1.
Benetton: in the last four years observed the index dropped by approximately 1.5 percentage points. From 14.8%
in Y2, the value reached 10.2% in Y5. The factor value was assigned a rating of 5.
Moschino: this index increased consistently until, in Y5, it reached 12.6 percentage points. The factor value was
converted to 3.8.
Valentino: in Y5 this index was 4.5%, an increase from the 1.13% of Y4, but lower than the average of 6% in the
preceding years. The factor value was converted to 1.1. Table 10 summarizes the data.
Insert Table 10
5.3 Turnover
In the five years studied, from Y1 to Y5, the total turnover of the companies in the Italian Fashion System (Made
in Italy) continued to increase, although moderately. Turnover, represented by turnovers, in this study only refers
to the national market and makes it possible to identify the market share held by the companies examined.
Differently from all the other factors, turnover only refers to the last year (Y5) taken into consideration for each
68
ISSN 1833-3850
E-ISSN 1833-8119
9. www.ccsenet.org/ijbm
International Journal of Business and Management
Vol. 6, No. 5; May 2011
competitor. The reason for taking into consideration only the last year of balance sheet produced by each
company lies in the possibility to evaluate the market share of each one, not in the static nature of an average
which levels out every change in an evolving situation, but as a current moment in an ongoing process begun in
past years. See Table 11 for a summary of the turnover values considered.
Insert Table 11
6. Results and conclusions
Following the detailed analysis of all the data and variables related to the companies in the sample, it was
possible to have a composite final result, and, therefore, reproduce the resulting GE/McKinsey Matrix (see
Figure 2). The four companies analyzed line up on the matrix in a fairly diversified manner and, therefore, it is
possible to make precise considerations.
Insert Figure 2
Armani and Moschino are in the same box of the matrix, very close together. Nevertheless, Armani is
characterized by a high Company Competitiveness value (2.73 in comparison with 2.55 for Moschino) which
gives it a positioning farther to the right than Moschino, highlighting its greater competitive strength as
compared to its nearest competitor. Moschino, instead, is characterized by a greater value in Industry
Attractiveness (1.3 in comparison with Armani’s 1.1) which, although not markedly, places it higher than
Armani, underlining its position in a more attractive market, although only slightly, than Armani. Benetton and
Valentino have a higher level of Industry Attractiveness than Armani and Moschino, although their position is
very different. Indeed, Valentino is positioned in a much more attractive market than Benetton (3.6 for Valentino
as compared with 2.5 for Benetton), but it is characterized by a very low competitive strength (1.69), even
inferior to that of Moschino (2.55). Benetton, instead, has a company competitive position of average strength
(3.61), greater than that of Armani (2.73).
Therefore, the various competitors analyzed do not all fit into the same box on the matrix. Valentino, together
with Moschino and Armani, are found in the matrix area characterized by a low attractiveness level, they are
located in two of the three boxes on the bottom left hand side of the matrix (although Valentino is located right
on the edge of the area of medium attractiveness level). Instead, Benetton is the only company located in the
medium attractiveness level of the matrix (meaning in one of the three boxes on the diagonal that runs from the
top left hand corner to the bottom right hand corner), with an extremely high sales potential – SP (due mainly to
the high volume of turnover).
It is interesting to notice how the haute couture brand, which is typically identifiable as a luxury brand for its
type of product positioning (Valentino), is associated with the highest value in terms of attractiveness but also
with the lowest value in terms of competitiveness and sales potential. This result could, on the one hand, explain
and justify the reason for which many fashion industry brands try to enter the luxury market, and, on the other
hand, highlights the difficulty that these brands have not only in penetrating, positioning and developing in this
clothing market segment, but also in consolidating and maintaining over time a certain level of results and a
certain acquired leadership. Additionally, it is significant that none of the four brands observed is positioned in
the area of high level of attractiveness.
The limits of the present analysis can be attributed to the construction of the GE/McKinsey Matrix itself. The
dimensions of the matrix strongly depend on the subjective evaluation of the analyst who draws it up.
Additionally, empirical data was not taken into consideration in the study. In fact, access was not available to a
wide enough selection of data to allow for statistical calculations such as multiple regression of factor analysis.
Use was made principally of secondary data, coming from sources produced by the same companies that were
analyzed (in particular, balance sheets). Other limitations are linked to the unavailability of some Balance
Indexes, which would be useful for an improved interpretation of the company results, and the absence of purely
qualitative variables within the analysis of the factors.
The possibility to expand this study with a greater number of companies or with observations of periods longer
than five years would be useful for future elaboration. It would be interesting to be able to point out which
companies are positioned in the area of highest attractiveness (upper right hand box in the matrix), given that no
organization observed in this study was positioned in this area. Additionally, it would also be useful to extend
this study geographically, examining not only companies that are part of the Italian Fashion System (Made in
Italy), but also companies located in other European and extra-European countries, in an attempt to highlight the
clearest differences or affinities. Further studies could be specifically aimed at the verification of substantial and
continuing differences between haute couture fashion companies and ready-to-wear fashion companies.
Published by Canadian Center of Science and Education
69
10. www.ccsenet.org/ijbm
International Journal of Business and Management
Vol. 6, No. 5; May 2011
References
Abell, D.F., & Hammond, J.S. (1979). Strategic Market Planning. Englewood Cliffs, NJ: Prentice Hall.
Aeffe S.p.A., Financial Statements, 1998–2002.
Amatulli, C. (2009). Il lusso esteriorizzato e il lusso interiorizzato. Bari: Cacucci Editore.
Benetton Group S.p.A. (1998–2002). Financial Statements.
Bergen, M., & Peteraf, M.A. (2002). Competitor Identification and Competitor Analysis: A Broad-Based
Managerial Approach. Managerial & Decision Economics, 23, 157–169.
Boyd, H.W., & Walker, O.C. (1990). Marketing Management: A Strategic Approach. Homewood, IL: Richard D.
Irwin, Inc.
Brun, A., Caniato, F., Caridi, M., Castelli, C., Miragliotta, G., Ronchi, S., Sianesi, A, & Spina G. (2008).
Logistics and supply chain management in luxury fashion retail: Empirical investigation of Italian firms.
International Journal of Production Economics, 114, 554–570.
Carcano, L., & Catalani, A. (2007). Il lusso alla ricerca di un’identità. Economia & Management, 5, 69–85.
Carcano, L., & Rovetta, B. (2009). Strategia multi-brand per i beni simbolici. Economia & Management, 5,
47–64.
Chakravarthy, B., & Henderson, J. (2007). From a hierarchy to a heterarchy of strategies: adapting to a changing
context. Management Decision, 45 (3), 642–652.
Chiari, C. (2009). Everlasting Luxury. Milan: Le Fonti.
Cooper, L.G. (2000). Strategic marketing planning for radically new products. Journal of Marketing, 64 (1),
1–15.
Cooper, R.G., Edgett, S.J., & Kleinschmidt E.J. (1999). New product portfolio management: practices and
performance. Journal of Product Innovation Management, 14 (4), 333–351.
Cooper, R.G., Edgett, S.J., & Kleinschmidt E.J. (2001). Portfolio management for new products. Cambridge,
MA: Perseus Books.
Corbellini, E., & Saviolo, S. (2009). Managing Fashion and Luxury Companies. Milan: Etas.
Day, G.S. (1977). Diagnosing the Product Portfolio. Journal of Marketing, 41 (2), 29–38.
Fionda, M., & Moore, M. (2009). The anatomy of the luxury fashion brand. Brand Management, 16 (5/6),
347–363.
Giorgio Armani S.p.A. (1998–2002). Financial Statements.
Gluck, F., & Kauffman, S. (1979). Using the strategic planning framework. McKinsey Internal Document in
Readings in Strategy, 5–6.
Grönroos, C. (1997). Value-driven Relational Marketing: from Products to Resources and Competencies.
Journal of Marketing Management, 13 (5), 407–419.
Guido, G. (2005). La Dimensione dei Rapporti con i Consumatori nelle Imprese Orientate al Marketing
Competitivo. In L. Pilotti (Ed.), Strategie dell’Impresa (pp. 113–155). Rome: Carocci Editore.
Guido, G. (2010). Un Riesame dei Criteri per la Valutazione della Customer Satisfaction: Il Modello
Conoscenze-Speranze. In G. Guido, F. Bassi and A.M. Peluso (Eds.), La Soddisfazione del Consumatore (pp.
25–151). Milan: Angeli Editore.
Hermes Lab, Camera Nazionale della Moda Italiana. (2003). Segnali sul Futuro nell’Economia della Moda.
Fashion Economic Trends, 2 (September).
Hofer, C.W., & Schendel, D. (1978). Strategy Formulation: Analytical Concepts. St. Paul, MN: West Publishing
Company.
Jan, Y.C. (2002). A three-step matrix method for strategic marketing management. Marketing Intelligence &
Planning, 20 (5), 269–272.
Jin, B. (2004). Apparel industry in East Asian newly industrialized countries. Journal of Fashion Marketing and
Management, 8 (2), 230–244.
70
ISSN 1833-3850
E-ISSN 1833-8119
11. www.ccsenet.org/ijbm
International Journal of Business and Management
Vol. 6, No. 5; May 2011
Jonk, G.J. (2007). SBU 2.0: a new tool for selecting business opportunities for the multi-unit organization.
Strategy & Leadership, 35 (5), 17–23.
Kapferer, J.N., & Bastien, V. (2009). The specificity of luxury management: Turning marketing upside down.
Brand Management, 16 (5/6), 311–322.
Kerzner, H. (2009). Project Management. Hoboke, NJ: John Wiley&Sons.
Kotler, P., & Caslione, J.A. (2009). Chaotics: The Business of Managing and Marketing in the Age of
Turbulence. New York: Amacom.
Lilien, G.L., & Rangaswamy, A. (2004). Marketing Engineering. St. Victoria, BC: Trafford Publishing.
McDonald, M. (2007). Marketing Plans. How to prepare
Butterworth-Heinemann Ltd.
them, how to use them. Boston:
McKinsey & Company. (2008). Enduring Ideas: The GE–McKinsey nine-box matrix. The McKinsey Quarterly,
September.
[Online]
Available:
https://www.mckinseyquarterly.com/Enduring_ideas_The_GE-McKinsey_nine-box_matrix_2198 (July 10,
2010).
O’Shaughnessy, J. (1995). Competitive marketing: a strategic approach. London, UK: Routledge.
Okonkwo, U. (2009). The luxury brand strategy challenge. Journal of Brand Management, 16, 287–289.
Paley, N. (1999). The Manager’s Guide to Competitive Marketing Strategies. Boca Raton, FL: CRC Press.
Peters, J. (1993). On product and service management. Management Decision, 31 (6), 49–51.
Porter, M. (1982). La Strategia competitiva. Bologna: Compositori.
Prahalad, C.K., & Hamel, G. (1990). The Core Competence of the Corporation. Harvard Business Review,
May-June.
Ramanujam, V., & Varadarajan, P. (1989). Research on corporate diversification: a synthesis. Strategic
Management Journal, 10 (6), 523–551.
Robinson, S.J.Q., Hichens, R.E., & Wade D.P. (1978). The directional policy matrix: tool for strategic planning.
Journal of Long Range Planning, 11 (3), 8–15.
Rumelt, R. (1982). Diversification strategy and profitability. Strategic Management Journal, 3 (4), 359–369.
Taplin, I.M., & Winterton, J. (2004). The European clothing industry. Journal of Fashion Marketing and
Management, 8 (3), 256–261.
Valentino S.p.A. (1998–2002). Financial Statements.
Wind, Y., & Mahajan, V. (1981). Designing Product and Business Portfolios. Harvard Business Review,
January-February.
Wind, Y., Mahajan, V. & Swire D. (1983). An empirical comparison of standardized portfolio models. Journal
of Marketing, 47 (2), 89–100.
Note
Note 1. The acronyms Y1, Y2, Y3, Y4 and Y4 respectively stand for Year 1 (1998), Year 2 (1999), Year 3
(2000), Year 4 (2001) and Year 5 (2002).
Table 1. Industry attractiveness for Armani
Armani
Industry Attractiveness
Annual Market Growth Rate
Employment
(No. of employees)
Y1
Y2
Y3
Y4
Y5
Average
+1.9%
+9.9%
+8.5%
+4.3%
+5.6%
7%
225
236
249
271
284
270
Published by Canadian Center of Science and Education
71
12. www.ccsenet.org/ijbm
International Journal of Business and Management
Vol. 6, No. 5; May 2011
Table 2. Industry attractiveness for Benetton
Benetton
Industry Attractiveness
Y1
Y2
Y3
Y4
Y5
Average
Annual Market Growth Rate
N/A
+12.4%
+8.5%
+9%
-2.9%
+5.4%
Employment
(No. of employees)
2 627
2 697
2 695
2 503
2 599
2 551
Table 3. Industry attractiveness for Moschino
Moschino
Industry Attractiveness
Y1
Y2
Y3
Y4
Y5
Average
Annual Market Growth Rate
N/A
-5%
+7.6%
+18.5%
+3.3%
+6%
Employment
(No. of employees)
569
571
588
595
570
580
Table 4. Industry attractiveness for Valentino
Valentino
Industry Attractiveness
Y1
Y2
Y3
Y4
Y5
Average
Annual Market Growth Rate
N/A
+15.3%
+106.5%
+43.7%
+3.6%
+38.7%
Employment
(No. of employees)
247
245
232
259
381
314
Table 5. Comparison of industry attractiveness values and ratings
Armani
Benetton
Moschino
Valentino
Industry
Attractiveness
Weight
Value
Rating
Value
Rating
Value
Rating
Value
Rating
Annual Market
Growth Rate
5
7%
1.19
5.4%
1
6%
1.07
38.7%
5
Employment
(No. of employees)
3
270
1
2 551
5
580
1.55
314
1.18
Table 6. Competitiveness for Armani
Armani
Company Competitiveness
Y1
Y2
Y3
Y4
Y5
Average
33.3
30.1
21.5
17.6
28.4
28.4
29.2%
25.6%
16.7%
12.1%
19.6%
13.5%
83.3
71.4
91.3
84.9
173
128
985
894
755
1 071
869
914.8
0.9
3.30
2.7
0.46
0.6
1.75
18.8%
62.8%
35.2%
16.8%
29.4%
32.6%
Accounts Payable Turnover
67.1%
36.2%
24.4%
111.3%
122.1%
72.22%
R.O.I.
7.8%
6.8%
4.6%
2.27%
4%
5.1%
Gross Operating Margin
(millions of euros)
Operating Income
(% of revenues )
Net Profit
(millions of euros)
Leftovers
(millions of euros)
Availability Index
Accounts Receivable
Turnover
72
ISSN 1833-3850
E-ISSN 1833-8119
13. www.ccsenet.org/ijbm
International Journal of Business and Management
Vol. 6, No. 5; May 2011
Table 7. Competitiveness for Benetton
Benetton
Company Competitiveness
Y1
Y2
Y3
Y4
Y5
Average
465.7
568.6
609.3
648.8
581.7
581.7
11.1%
14.4%
13%
12.7%
11.1%
12%
52.4
242
78.2
83.7
-2.8
119
148.9
169.5
165.7
144.4
120.2
144
1.53
1.7
1.03
0.7
0.9
1.17
Accounts Receivable
Turnover
44.8%
40.7%
9.2%
49%
44.6%
44%
Accounts Payable Turnover
46.4%
33%
64.7%
82.6%
76.8%
74.7%
10%
14.8%
13.1%
12.1%
10.2%
12.04%
Gross Operating Margin
(millions of euros)
Operating Income
(% of revenues)
Net Profit
(millions of euros)
Leftovers
(millions of euros)
Availability Index
R.O.I.
Table 8. Competitiveness for Moschino
Moschino
Company Competitiveness
Y1
Y2
Y3
Y4
Y5
Average
20.18
6.3
10.7
17.7
28.4
19.7
N/A
N/A
5.3%
9.3%
11%
55.9%
1.6
0.5
-9.4
4.2
9.1
1.3
17 411
17 232
18 785
18 435
15 768
16 888
Availability Index
1.15
0.43
0.56
0.53
0.82
0.7
Accounts Receivable
Turnover
18%
19%
21%
18%
25%
20%
Accounts Payable Turnover
15%
16%
25%
26%
35%
23%
2.18%
4.78%
6.24%
10.9%
12.6%
9.9%
Gross Operating Margin
(millions of euros)
Operating Income
(% of revenues)
Net Profit
(millions of euros)
Leftovers
(millions of euros)
R.O.I.
Published by Canadian Center of Science and Education
73
14. www.ccsenet.org/ijbm
International Journal of Business and Management
Vol. 6, No. 5; May 2011
Table 9. Competitiveness for Valentino
Valentino
Company Competitiveness
Y1
Y3
Y4
Y5
Average
-2.2
-11.9
-13.1
1
N/A
1
18.5%
43.9%
22.2%
2.9%
7.9%
7.9%
-14.8
-23.2
-24.6
-27.9
-42
-32
3 521
2 515
3 733
13 562
14 770
10 529
0.8
0.7
0.8
0.8
0.2
0.5
524.7%
427.2%
229.4%
179.3%
32.1%
340%
19%
20%
19.7%
21.6%
27.3%
23.5%
2.16%
Gross Operating Margin
(millions of euros)
Operating Income
(% of revenues)
Net Profit
(millions of euros)
Leftovers
(millions of euros)
Y2
6.3%
6.2%
1.13%
4.5%
5.25%
Availability Index
Accounts Receivable
Turnover
Accounts Payable Turnover
R.O.I.
Table 10. Comparison of the values and rating for company competitiveness
Armani
Benetton
Moschino
Valentino
Company
Competitiveness
Weight
Value
(millions
of euros)
Rating
Value
(millions
of euros)
Rating
Value
(millions
of euros)
Rating
Value
(millions
of euros)
Rating
Gross Operating
Margin
5
28.4
1.29
581.7
5
19.7
1.23
1
1
5
13.5%
2.34
12%
2.25
55.9%
5
-7.9%
1
Net Profit
5
128
5
119
4.8
1.3
1.83
-32
1
Leftovers
3
914.8
1.185
144
1
16 888
5
10 529
3.47
Availability Index
4
1.75
5
1.17
3.2
0.7
1.7
0.5
1
Accounts Receivable
Turnover
4
32.6%
1.17
44%
1.3
20%
1
340%
5
Accounts Payable
Turnover
4
72.22%
4.81
74.7%
5
23%
1
23.5%
1.04
R.O.I.
5
5.1%
1
12.04%
5
9.9%
3.8
5.25%
1.1
Operating Income
(% of revenues)
Table 11. Comparison of the turnover values and ratings
Armani
Benetton
Moschino
Valentino
Values
(millions
of euros)
Turnover
74
Rating
Values
(millions
of euros)
Rating
Values
(millions of
euros)
Rating
Values
(millions
of euros)
Rating
143.7
1.8
1 922
25
147
1.9
114.2
1.5
ISSN 1833-3850
E-ISSN 1833-8119
15. Vol. 6, No. 5; May 2011
High
International Journal of Business and Management
Medium
High attractiveness
Medium attractiveness
Low attractiveness
Low
Industry Attractiveness (IA)
www.ccsenet.org/ijbm
Low
Medium
High
Business Strengths (BS)
Figure 1. The GE/McKinsey Matrix model
5.00
Industry Attractiveness (IA)
4.50
4.00
3.50
Valentino
3.00
Benetton
2.50
2.00
1.50
Armani
Moschino
1.00
1.00
1.50
2.00
2.50
3.00
3.50
4.00
4.50
5.00
Business Strengths (BS)
IA: Industry Attractiveness; BS: Business Strengths; SP: Sales Potential.
Armani: IA = 1.1; BS = 2.73; SP = 1.8
Benetton: IA = 2.5; BS = 3.61; SP = 25
Moschino: IA = 1.3; BS = 2.55; SP = 1.9
Val
Figure 2. Graphic representation of the resulting GE/McKinsey
Published by Canadian Center of Science and Education
75