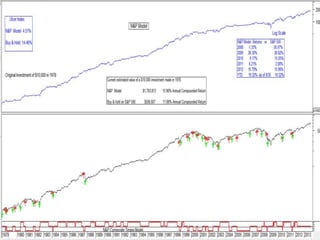
The N&P model has been trading live since 2001, and it is made up of monetary, sentiment, interest rate data, corporate bond market data, and technical indicators. One thing that really stands out about the N&P Model is the ulcer index is 4.51% vs. 14.46% for the S&P 500, a 68% reduction in risk over the S&P 500.
The above chart shows the draw downs for the N&P Model(in red) compared to the draw downs for the S&P 500(in Black). The one thing that stands out on this chart is the draw downs for the N&P model are significantly less than the draw downs for buy and hold on the S&P 500.