1. Preface
This report is the product of a fifteen-month long project by the McKinsey Global
Institute, working in collaboration with McKinsey’s India Office, on the economic
performance of India.
McKinsey undertook this project as an important step towards developing our
understanding of how the global economy works. India, which will soon be the
world’s most populous country, remains one of the poorest. Reforms over the past ten
years have been inadequate. If it were to continue with its current economic
performance, the economic prospects of millions of Indians living in rural India
would decline steadily over the next ten years – one of the most serious problems of
today’s global economy. We conducted this project, with a view to discovering
whether better economic policies could significantly improve India’s situation.
This project builds upon the previous work of the McKinsey Global Institute in
assessing economic performance among the major economies of the world. Our early
reports separately addressed labour, capital productivity and employment1: the
fundamental components of economic performance. Later, we combined these
components to address the overall performance of Sweden, Australia, France,
Germany, the Netherlands, Brazil, Korea, the UK, Russia, Poland and Japan.2 In all
of these countries, economic performance was compared with the US and other
relevant countries.
This study continues our efforts to assess economic performance across countries. As
before, the core of our work is concentrated on conducting sector case studies to
measure differences in productivity, output and employment performance across
1 Service Sector Productivity, McKinsey Global Institute, Washington, D.C., October 1992; Manufacturing Productivity,
McKinsey Global Institute, Washington, D.C., October 1993; Employment Performance, McKinsey Global Institute,
Washington, D.C., November 1994; Capital Productivity, McKinsey Global Institute, Washington, D.C., June 1996.
2 Sweden’s Economic Performance, McKinsey Global Institute, Stockholm, September 1995; Australia’s Economic
Performance, McKinsey/Australia and McKinsey Global Institute, Sydney, November 1995; Removing Barriers to
Growth in France and Germany, McKinsey Global Institute, March 1997; Boosting Dutch Economic Performance,
McKinsey Global Institute and Max Geldens Foundation for Societal Renewal, September 1997; Productivity-The Key
to an Accelerated Development Path for Brazil, McKinsey Brazil Office and McKinsey Global Institute, Sao Paulo,
Washington, March 1998; Productivity-led Growth for Korea, McKinsey Seoul Office and McKinsey Global Institute,
Seoul, Washington, March 1998; Driving Productivity and Growth in the U.K. Economy, McKinsey London Office and
McKinsey Global Institute, October 1998; Unlocking Economic Growth in Russia, McKinsey Global Institute, October
1999; Poland’s Economic Performance, McKinsey Global Institute, March 2000; Why the Japanese Economy is not
Growing: micro barriers to Productivity Growth, McKinsey Global Institute, July 2000.
2. countries and to determining the reasons for the differences. Since 60 per cent of the
workforce in India is employed in the agricultural sector, we had to conduct case
studies in agriculture for the first time. This case study work provides the basis for
our conclusions on how to improve economic performance in India.
The report consists of three volumes. Volume 1 has six chapters, the first of which is
an executive summary. Chapter 2 describes our project objective and approach.
Chapter 3 reviews the performance of the Indian economy at an aggregate level and
also presents perspectives that we found about its performance in economic literature.
Chapter 4 presents the synthesis of our sector level findings about India’s current
economic performance. Chapter 5 provides our assessment of India’s growth
potential. And Chapter 6 gives our recommendations. Volumes 2 and 3 contain the 13
sector case studies broadly divided into agriculture: dairy farming and wheat farming;
manufacturing: apparel, automotive assembly, dairy processing, steel and wheat
milling; and services: housing construction, electric power, retail, retail banking,
software and telecommunications.
A core group of six consultants from McKinsey’s India office and five consultants
from the McKinsey Global Institute made up the working team for this project. The
India based consultants were Neeraj Agrawal, Chandrika Gadi, Deepak Goyal, Jayant
Kulkarni, Anish Tawakley, Sanoke Viswanathan and Alkesh Wadhwani. The Global
Institute consultants were Angelique Augereau, Vivake Bhalla, Amadeo Di Lodovico,
Axel Flasbarth and Catherine Thomas. Jaya Banerji, Amrit Dhillon, Shampa Dhar-
Kamath, Uma Khan and Jeanne Subramaniam provided editorial support. Jayshri
Arya, Saandra Desouza, Audrey D’Souza, Leslie Hill Jenkins and Eleanor Rebello
provided administrative assistance. Shirish Sankhe was responsible for the day-to-day
management of the project, assisted by Amadeo Di Lodovico and Alkesh Wadhwani.
This project was conducted under the direction of Ranjit Pandit and I, with assistance
from Vincent Palmade.
In carrying out the work we were fortunate to have an external advisory committee.
The committee members were Montek Singh Ahluwalia now of the IMF and earlier
of the Planning Commission of India, Orley Ashenfelter of Princeton University, and
Rakesh Mohan now of the Ministry of Finance and formerly of the National Council
of Applied Economic Research. The working team had four one and a half day
meetings with the advisory committee to periodically review progress during the
course of the project and benefited from many written comments and individual
discussions. The members of the advisory committee participated in this project as
individuals and not as representatives of their respective institutions. It is McKinsey
that is solely responsible for the content of this report.
3. Throughout the project we also benefited from the unique worldwide perspective and
knowledge that the McKinsey consultants brought to bear on the industries
researched for our case studies. Their knowledge was a product of intensive work
with clients and a deep investment in understanding industry structure and behaviour
to support client work. McKinsey sector leaders provided valuable input to our case
studies and reviewed our results. McKinsey’s research and information department
provided invaluable information and insights while working under trying deadlines.
Finally, we could not have undertaken this work without the information we received
from numerous interviews with corporations, industry associations, government
officials and others. We thank all those who gave of their time and help.
Before concluding, I’d like to emphasise that this work is independent and has not
been commissioned or sponsored in any way by any business, government or other
institution.
August 2001 Bill Lewis
Director
McKinsey Global Institute
4. 1
India: The Growth Imperative
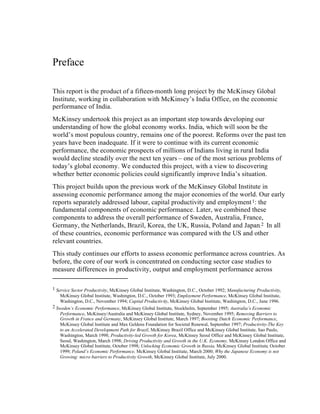
A decade ago, India and China had roughly the same GDP per capita. But at US$
440, India’s current GDP per capita is now only half that of China’s. Further,
India’s GDP is growing at a mere six per cent a year, compared to China’s 10 per
cent. India’s working-age population, however, is expanding ever faster. Unless
GDP grows at closer to 10 per cent a year, India could face unemployment as high
as 16 per cent by 2010 (Exhibit 1.1).
Over the past 16 months, the McKinsey Global Institute (MGI) has studied India’s
economy to see what is holding back growth and what policy changes might
accelerate it. Our study has shown that, with the right new policies, GDP growth
of 10 per cent a year is within India’s reach.
We examined 13 sectors in detail — two in agriculture, five in manufacturing and
six in services. Together, they accounted for 26 per cent of India’s GDP and 24
per cent of its employment. We identified the barriers to productivity and output
growth in each of these sectors in a bottom-up, rigorous manner and quantified
their impact. We then extrapolated these findings to the overall economy.
Our work revealed that there are three main barriers to faster growth: the
multiplicity of regulations governing product markets (i.e., regulations that affect
either the price or output in a sector); distortions in the land markets; and
widespread government ownership of businesses (Exhibit 1.2). We estimated that,
together, these inhibit GDP growth by around 4 per cent a year. In contrast, we
found that the factors more generally believed to retard growth — inflexible
labour laws and poor transport infrastructure — while important, constrain India’s
economic performance by less than 0.5 per cent of GDP a year. Therefore, it
would be a mistake to focus growth policies exclusively on these familiar
problems. To raise India’s growth trajectory a broader reform agenda is required.
Removing the main barriers to growth would enable India’s economy to grow as
fast as China’s, at 10 per cent a year. Annual growth in labour productivity would
double to 8 per cent. Some 75 million new jobs would be created, sufficient not
only to ward off the looming crisis in employment, but also to reabsorb any
workers that might be displaced by productivity improvements.
We believe that India’s government can rapidly overcome these three main
barriers to growth. In order to do this, however, it will have to adopt a deeper,
faster process of reform immediately. We have identified 13 policy changes the
government should enact now to ensure that India’s economy grows as fast as it
must.
5. 2
THREE MAJOR BARRIERS INHIBIT INDIA’S ECONOMIC
GROWTH
Productivity — the amount of output per unit of labour and unit of capital invested
— is the most powerful engine of GDP growth. Countries with the highest
productivity have the highest GDP per capita (Exhibit 1.3), as the percentage of
people employed is not significantly different across countries. Clearly, increases
in productivity in these countries have not led to a decline in employment. India’s
efforts to increase GDP should thus be focused squarely on increasing productivity
in all sectors of the economy. The three main barriers to growth —regulations
governing products and markets, land market distortions and government owned
businesses — have a depressing effect largely because they protect most Indian
companies from competition, and thus from incentives to improve productivity.
Removing these barriers will increase productivity immediately.
Product market regulations restrict competition and best
practice
Taken together, product market barriers and the rules and policies governing
different sectors of the economy impede GDP growth by 2.3 per cent a year.
India’s liberalised automotive industry shows what could be gained by removing
them. As part of its economic reforms in 1991, the Indian government relaxed
licensing requirements for carmakers and restrictions on foreign entrants.
Competition increased dramatically, and the old, pre-reform automobile plants lost
substantial market share. But demand for the new, cheaper, higher quality Indian-
made automobiles soared, leading to a net increase in employment in the industry
despite its very high productivity growth (Exhibit 1.4).
India’s current regulatory regime has five features especially damaging to
competition and productivity:
¶ Inequitable regulation: Many regulations restrict competition because
they are inequitable and ill-conceived. In telecommunications, for
example, the inconsistency and instability of the policy framework has
meant that competitive intensity has remained low in the fixed line
telephony arena even though the sector was opened up to private players
in 1994. Even after several revisions, the telecom regulatory and policy
framework has several features that tilt the playing field in favour of the
incumbent thus decreasing the competitive intensity necessary to foster
growth in productivity and output. For instance, private entrants must
pay heavy fees for licenses while government-owned incumbents pay no
such fees. In addition, rules about the access to other operators’ networks
are unclear. Incumbents have used this ambiguity to delay the start-up of
private entrants’ operations. .
6. 3
¶ Uneven enforcement: The rules are not applied equally to all players.
So, for example, sub-scale steel mills frequently steal electricity and
underreport their sales to avoid tax. Larger, more visible players cannot
get away with such irregularities. So the less productive players survive
by competing unfairly against the larger ones (Exhibit 1.5).
¶ Reservation of products for the small-scale enterprises: Around 830
products in India are currently reserved for manufacture by firms below a
certain size. For example, producers of certain types of clothing and
textiles face limits on their spending on new plants. These limits protect
(indeed, promote) clothing-makers that are below efficient scale. As a
result, a typical Indian clothing plant has only about 50 machines,
compared to over 500 in a Chinese plant. Restrictions on imports of
clothing from more productive countries protect the domestic markets of
these subscale Indian players.
At present, their exports are protected too. Several countries, including
the United States, import a guaranteed quota of Indian clothing each
year. As a result, India’s share of garment imports in countries without
such a quota is much lower than it is in quota countries, while the
opposite is true of China’s more competitive garment exports. But all
such quotas are to be lifted over the next five years. Indian exports will
be highly vulnerable, unless the sector can become more productive
(Exhibit 1.6).
Removing the small-scale industry reservation will allow these
manufacturers to expand and achieve an efficiency of scale sorely needed
to enable competition with imports. The WTO agreement has already
resulted in the removal of restrictions on 550 items out of a total of 830.
This was made effective in 2001.
¶ Restrictions on Foreign Direct Investment (FDI): FDI is prohibited in
certain sectors of the Indian economy — retail, for example — closing
off a fruitful source of technology and skills. Global, best practice
retailers have enabled the retail sectors in Thailand, China, Brazil and
Poland to develop rapidly. Their international experience helps them to
build operations quickly and to tailor formats to local environments.
Foreign retailers also prompt local supply chains to improve, stimulating
investment and productivity growth in wholesaling, food processing and
consumer goods manufacturing, for example. Allowing FDI in food retail
will ensure that the share of supermarkets increases dramatically – from
its current 2 per cent to 25 per cent by 2010. Since these supermarkets
can offer prices, which are, on average, 9 per cent lower than those
offered by traditional grocery stores, an increase in the share of
supermarkets would lead to an improvement in the standards of living of
Indians across the social spectrum.
7. 4
¶ Licensing or quasi-licensing: In several sectors of the Indian economy,
operators need a license from the government to compete — in the dairy
industry, for example. Although licensing dairy processors through the
Milk and Milk Products Order (MMPO) was supposed to ensure high
levels of quality and hygiene, the licensing authority has in fact
prevented high quality private dairy plants from competing in certain
areas, thus protecting government-owned plants and cooperative dairies
from competition, and from any incentive to shed excess labour or to
improve operations. Removing these restrictions would increase
competition among processors, forcing them to make improvements such
as working with farmers to improve cattle breeds and milk yields, or
using chilling centres (Exhibit 1.7).
Unrecognised land market distortions constrain biggest
domestic sectors
We estimated that land market distortions account for close to 1.3 per cent of lost
growth a year, but largely remain excluded from public debate. They limit the land
available for housing and retail, the largest domestic sectors outside agriculture.
Less room to expand for players in these sectors means less competition. Scarcity
has helped make Indian land prices the highest among all Asian nations, relative to
average incomes (Exhibit 1.8). Land market distortions include:
¶ Unclear ownership: Most land parcels in India — 90 per cent by one
estimate — are subject to legal disputes over their ownership. The
problem might take Indian courts a century to resolve at their current rate
of progress. Being unclear about who owns what makes it immensely
difficult to buy land for retail and housing developments. Indian
developers also have trouble raising finance since they cannot offer land
to which they do not have a clear title as collateral for loans. As a result,
most new housing developments are constructed either on land already
owned by the developers, or by the few insiders who know how to speed
up the bureaucratic title-clearing process.
Streamlining this process and revising the law on land ownership would
boost competition in construction. Competitive builders would improve
their productivity and offer lower house prices. And the sluggish Indian
construction market would expand dramatically.
¶ Counterproductive taxation: Low property taxes, ineffective tax
collection and subsidised user charges for power and water leave local
governments unable to recover investments in infrastructure, particularly
in suburban areas. In Delhi, for example, water is supplied at only 10 per
cent of its true cost. Property tax collected in Mumbai amounts to only
0.002 per cent of the estimated capital value of the buildings: The usual
8. 5
ratio in developed countries is around 1-2 per cent. With more efficient
collection of higher taxes, local governments could invest in the
infrastructure required to support new developments on large parcels of
suburban land. Developers would compete to build on such plots. If they
could build up to 25 houses in a project instead of the single homes they
more typically construct today, construction costs would fall by as much
as 25 per cent.
Conversely, stamp duties in India are extraordinarily high, close to 8-10
per cent of the value of the property changing hands. This, too,
discourages land and real estate transactions.
¶ Inflexible zoning, rent and tenancy laws: Zoning laws, rent controls
and protected tenancies “freeze” land in city centres that would otherwise
be available for new retail outlets and flats. Protected tenants cannot be
evicted, and will never voluntarily surrender their cheap tenancies, so
their ancient buildings can never be renovated. These laws also restrict
competition. For example, subsidised rents allow traditional inner city
counter stores to overlook their operational inefficiencies. But in
Chennai, the capital of India’s southern state of Tamil Nadu, where rent
control and zoning laws are less stringent, modern supermarkets already
account for almost 20 per cent of total food retailing compared to less
than 1 per cent in cities with higher average incomes such as Mumbai
and Delhi.
Government control of companies promotes inefficiency and
waste
Government-controlled entities still account for around 43 per cent of capital
stock in India and 15 per cent of employment outside agriculture. Their labour and
capital productivity levels are well below those of their private competitors
(Exhibit 1.9). In effect, they suppress potential competition and productivity
improvements equivalent to 0.7 per cent of GDP growth every year. For example,
the near-monopoly status of government-owned companies in some sectors,
including telecommunications and oil, guarantees their profits however
unproductive they may be. Failing state-owned companies in industries open to
competition such as steel and retail banking can get government support, allowing
them, too, to survive despite their inefficiencies. In telecommunications and
electrical power, the government controls both the large players and the regulators,
creating an uneven playing field for private competitors.
India’s electric power sector illustrates how government control of companies can
promote inefficiency. Government-owned State Electricity Boards (SEBs) lose a
staggering 30-40 per cent of their power, mostly to theft, compared to private
power distributors’ losses of around 10 per cent, arising mostly from technical
9. 6
factors. Government subsidies—and corruption — blunt the public sector
managers’ motivation to control theft. Subsidies also limit their incentive to
prevent blackouts and to maintain power lines, all tasks which private players do
better. Privatising SEBs would save government the subsidies (amounting to
almost 1.5 per cent of GDP), and oblige managers to improve their financial and
therefore their operational performance. They would have to monitor theft and
improve capital and labour productivity.
Minor barriers to growth
The popular view is that India’s economy would grow faster if it were not for its
inflexible labour laws and its poor transport infrastructure. We found that these
factors, in fact, constrain India’s economic performance less than what is
commonly assumed: Together, they account for lost growth equivalent to only 0.5
per cent of GDP. While India would benefit if these three problems were tackled,
they should not become the sole focus of attention.
Current labour laws do inhibit productivity in labour intensive and export oriented
manufacturing sectors such as clothing by making it difficult for firms to shed
workers rendered redundant by changing market or production conditions. But
these sectors account for less than 4 per cent of India’s employment. Moreover,
companies in these sectors can generally overcome the ban on shedding workers
by offering voluntary retirement schemes, as do firms in capital-intensive sectors,
like electrical power and automobile assembly. In addition, current labour laws,
including the Factory Act, do not apply to private players in the service industries
— software and private banking, for example. Employment in these sectors is
more flexible, governed only by the terms of contracts between individual
employees and their employers.
The impact of poor transport infrastructure on productivity is overstated. In fact
most companies typically find ways around the problem. For instance, automotive
suppliers are often located close to assembly plants to avoid disrupting the plants’
just-in-time operations. More importantly, there is much that could be done to
make the existing transport infrastructure work better. For example, less red tape
in port management would speed up customs clearance and cargo ships’
turnaround time; modest investments in handling equipment would greatly
increase the productivity of India’s ports. In the absence of such efforts, the
funding devoted to creating additional transportation infrastructure would be sub-
optimally utilised.
10. 7
POLICIES TACKLING MAJOR BARRIERS WILL ACCELERATE
GROWTH
Thirteen policy changes would succeed in removing the bulk of these critical
barriers to higher productivity and growth. They include removing reservations on
products to small scale manufacturers; rationalising taxes and excise duties;
establishing effective, pro-competition regulation and powerful, independent
regulators; removing restrictions on foreign investment; reforming property and
tenancy laws; and widespread privatisation. If the government were to carry out
these changes over the next two to three years, we believe that the economy could
achieve most of the projected 10 per cent yearly growth by 2004-05.
Such profound changes will certainly prompt resistance, especially from those
protected by the current regulatory regime. But the fact is that several of the
current policies have not achieved their social purpose, however worthy their
intentions. Many have, in fact, been counterproductive. So, for example, small-
scale reservation has cost India manufacturing jobs by preventing companies from
becoming productive enough to compete in export markets. Similarly, tenancy
laws designed to protect tenants have driven up non-protected rents and real estate
prices, making ordinary, decent housing unaffordable to many Indians.
Critics might still argue that the increase in GDP resulting from these policy
changes will all flow towards the already rich. But if we examine the effects of the
proposed reforms on the Indian economy carefully, we can see that, again, the
opposite is true. By creating a virtuous cycle of broad-based GDP growth, with
millions of construction, retail and manufacturing jobs, they will benefit every
Indian. Farming families, the poorest group, will increase their real incomes by at
least 40 per cent.
Implementing such a broad reform programme rapidly will undoubtedly be
politically challenging. The challenge can, however, be made more manageable in
two ways. First, by understanding and accommodating the interests of the parties
affected, wherever possible. And it is possible to do so in a number of instances.
For example, import duties could be lowered to Asian levels in a pre-determined
but phased manner (over an approximate 5-year period) to give the industries
adequate time to improve their competitiveness. Similarly, standard retrenchment
compensation norms should be introduced and stringently observed to protect the
interests of workers as organisations are granted greater freedom to retrench.
Furthermore, granting generous equity stakes at discounted prices to the workers
will also reduce their resistance to privatisation. Second, in some of the areas of
reform, the Government should also try and manage political opposition by
targeting its efforts on those portions of the reform that will yield maximum
impact. For example, when removing small-scale reservations, the Government
should first focus on the 68 items that account for 80 per cent of the production of
the total 836 reserved items. Similarly, rent control for old tenancies could be
11. 8
phased out over a period of 5-10 years so as to allow adequate time for those
affected to find alternative accommodation.
THE EFFECTS OF REFORM
India’s economy has three types of sector: modern sectors — with production
processes resembling those in modern economies — provide 24 per cent of
employment and 47 per cent of output; transitional sectors provide 16 per cent of
employment and 27 per cent of output; and agricultural sectors provide 60 per cent
of employment and 26 per cent of output. Transitional sectors comprise those
informal goods and services consumed by a growing urban population: street
vending, domestic service, small-scale food processing and cheap, mud housing,
to name a few. Transitional businesses typically require elementary skills and very
little capital, so they tend to absorb workers moving out of agriculture.
What will happen to the economy if India immediately removes all the existing
barriers to higher productivity? Our analysis shows that the resulting increases in
labour and capital productivity will boost growth in overall GDP to 10 per cent a
year; they will release capital for investment worth 5.7 per cent of GDP; and they
will generate 75 million new jobs outside agriculture, in modern as well as
transitional sectors.
Growth in labour productivity will almost double to 8 per
cent
Removing all the productivity barriers would almost double growth in labour
productivity to 8 per cent a year over the next ten years. The modern sectors would
account for around 90 per cent of the growth, while it would remain low in the
other two sectors. In fact, productivity in the modern sectors of the economy
would increase almost three times over the next 10 years (Exhibit 1.10). Though
there may be small improvements in agricultural productivity, mainly from yield
increases, the massive rise in agricultural productivity which mechanised farming
has supported in developed countries is unlikely to occur in India for another ten
years, at least, while there is still a surplus of low cost rural labour to deter farmers
from investing in advanced machines. Enterprises in the transitional sectors have
inherently low labour productivity because they use labour intensive “low-tech”
materials, technologies or business formats. So although these sectors will grow to
meet rising urban demand, their labour productivity will remain about the same.
Capital productivity will increase by 50 per cent
If all the barriers were removed, capital productivity in the modern sectors would
grow by at least 50 per cent. Increased competition would force managers to
eliminate the tremendous time and cost over-runs on capital projects and low
12. 9
utilisation of installed capacity which they can get away with now, especially in
state-run enterprises. Regulation to ensure healthy competition, equitably
enforced, would prevent unwise investments common today such as the
construction of sub-scale and under-utilised steel mills.
Higher productivity means faster growth with less investment
Many policy-makers and commentators believe it would take investment
equivalent to more than 35 per cent of GDP, an almost unattainable amount, to
achieve a 10 per cent GDP growth rate in India. Our analyses, however, suggest
that, at the higher levels of labour and capital productivity, India can achieve this
rate of GDP growth with investment equivalent to only 30 per cent of GDP a year
for a decade, less than China invested between 1988 and 1998. Although still a
challenge, this rate is certainly achievable, since removing the barriers that hinder
productivity will unleash extra funds for investment, equivalent to the consequent
drop in the public deficit and the increase in FDI. These sources, by themselves,
would be sufficient to increase investment from its current level of 24.5 per cent of
GDP to 30.2 per cent.
The funds would be released in the following manner: Removing the barriers to
higher productivity would generate extra revenue for the government through
more efficient taxation — particularly on property — and from privatisation, and
the government would save what it now spends on subsidies to unprofitable state-
owned enterprises. As a result, its budget deficit would decrease by around 4 per
cent of GDP, an amount which would then become available for private
investment elsewhere.
In the instance of foreign investment: Current flows of FDI into India are worth
just 0.5 per cent of GDP. By contrast, many developing countries, including
Malaysia, Thailand and Poland, consistently attract FDI worth more than 3 per
cent of annual GDP. We estimate that lifting restrictions on FDI and opening all
modern sectors of India’s economy to well regulated competition will increase
FDI by at least 1.7 per cent of GDP within the next three years.
India will enjoy job-creating growth
Productivity growth and increased investment will create more than 75 million
new jobs outside agriculture in the next 10 years compared to the 21 million
projected as a result of current policies. But while most of the productivity gains
and 32 million of the new jobs will, indeed, appear in the modern sectors, 43
million new jobs will be created in the transitional sectors, making the move to
town worthwhile for low paid and underemployed agricultural workers.
Agricultural wages will therefore rise. Although there will be job losses in
government-dominated sectors like steel, retail banking and power, these will be
more than offset by new jobs in transitional and modern sectors such as food
processing, retail trade, construction, apparel and software. More workers with
13. 10
more disposable income will stimulate more demand for goods and services.
Greater demand will create opportunities for further investment, in turn creating
more jobs.
This migration of labour between sectors is a feature of all strongly growing
economies and should be welcomed by policy-makers. For even though increasing
productivity may displace labour, it stimulates more overall employment.
INDIA NEEDS A DEEPER, FASTER PROCESS OF REFORM
For India to enjoy the benefits of faster growth, a small team of senior cabinet
ministers, under the direct supervision of the Prime Minister, should make
implementing the 13 policy reforms their immediate priority. While the central
government must take the lead, state governments will have a crucial supporting
role to play: one-third of the reforms required — those concerning the land market
and power sectors — lie in their hands (Exhibit 1.11). However, state
governments will need careful guidance from the centre. Central government
should identify for each state the critical areas for reform; design model laws and
procedures for the states to adapt and enact; and encourage them to implement the
reforms with financial incentives.
Central government must act now to achieve a positive outcome soon. Though the
2001 Union Budget gave a powerful boost to the second round of economic
reforms, the pace needs to be much faster. We urge the government to complete
these 13 policy reforms over the next two to three years, in order to achieve the 10
per cent growth target by 2004-05.
* * *
India will be a very different country in ten years time if these reforms are
undertaken. With a GDP of around US$ 1100 billion, individual Indians will be
more than twice as rich, and probably live in the fastest growing economy in the
world. Best of all, this is no pipe dream but an achievable goal — if India’s
government and its people act decisively and quickly.
14. 2001- 01-10MB-ZXJ151(vd)
Exhibit 1.1
INDIA NEEDS TO INCREASE ITS GDP AT 10% PER YEAR
Status Quo
Complete
reforms
GDP growth
5.5
10.1
16
7
CAGR
Jobs created
outside agriculture
Millions
Unemployment
rate in 2010*
Per cent
* Current Daily Status. Assuming that labour participation rate remains constant
Source: McKinsey analysis
24
75
2001- 01-10MB-ZXJ151(vd)
Exhibit 1.2
5.5
10.1
0.3
2.3
1.3
0.7
India
(Status
quo)
PRODUCT AND LAND MARKET BARRIERS AS WELL AS GOVERNMENT
OWNERSHIP ARE THE KEY BARRIERS TO GDP GROWTH
CAGR (2000-2010)
India
(Complete
reforms)
Product
market
barriers
Govern-
ment
owner-
ship
Other*Land
market
barriers
* Includes lack of transport infrastructure and labour market barriers
Source: McKinsey analysis
15. 2001- 01-10MB-ZXJ151(vd)
Exhibit 1.3
PRODUCTIVITY AND GDP PER CAPITA ARE CLOSELY CORRELATED
0
10
20
30
40
50
60
70
80
90
100
110
0 10 20 30 40 50 60 70 80 90 100 110
Source: Economic Intelligence Unit; OECD; MGI
India (2000)
Russia (1999)
Brazil (1997)
Poland
(1999)
Korea (1997)
Japan (2000)
UK (1998)
US (1990-1999)
Germany (1996)
France (1996)
GDP/capita
Labour productivity
Indexed to the US = 100 in 1996
2001- 01-10MB-ZXJ151(vd)
Exhibit 1.4
RAPID PRODUCTIVITY AND OUTPUT GROWTH IN THE
PASSENGER CAR ASSEMBLY SEGMENT1992-93
Equivalent cars per equivalent employee; Indexed to India = 100 in 1992-93
1992-93 1999-00
100
356
CAGR
20%
Labor productivity
100
380
1992-93 1999-00
CAGR
21%
Output
1992-93 1999-00
111100
CAGR
1%
Employment
Source: Interviews, SIAM, Annual reports
16. 2001- 01-10MB-ZXJ151(vd)
Exhibit 1.5
NON-LEVEL TAXES AND ENERGY PAYMENTS ALLOW SMALL STEEL
MILLS TO SURVIVE
Source: McKinsey metals and mining practice, interviews, Indian Railways, McKinsey analysis
US$ per ton of liquid steel Punjab example
80 279
267
347
True cost
of a Mini
mill
Costs
evaded
•Taxes
•Power
payments
Actual cost
of the mini
mills in the
current
system
Large
mini mill
costs
2001- 01-10MB-ZXJ151(vd)
Exhibit 1.6
11.3
38.1
Of top 10
quota
countries*
QUOTAS PROTECT INDIA’S MARKET SHARE IN WORLD APPAREL
* U.S., Germany, UK, France, Italy, Belgium, Canada, Spain, Austria, Denmark
** Japan, Netherlands, Switzerland, Sweden, Australia, Norway, Singapore, Poland, Korea, Chile
Source: UN International Trade Statistics
Per cent of total apparel imports
Of top 10
non-quota
countries**
From China
3.2
1.6
Of top 10
quota
countries*
Of top 10
non-quota
countries**
From India
-50%
+337%
17. 2001- 01-10MB-ZXJ151(vd)
Exhibit 1.7
COMPETITION BETWEEN DAIRY PROCESSORS BENEFITS FARMERS
Yield per milch animal per day
(litres/day)
Degree of
competition
between dairy
processors
Low
(Village with milk
trader only)
Medium
(Village with one
direct collection
facility + milk trader)
High
(Village with two direct
collection facilities +
milk trader)
2.19
3.14
3.86
Source: Basic Animal Husbandry Statistics, 1999; NCAER Evaluation of Operation Flood on Rural Dairy
Sector, 1999, 1991census data; interviews; McKinsey analysis
2001- 01-10MB-ZXJ151(vd)
Exhibit 1.8
LAND COSTS RELATIVE TO INCOME LEVELS ARE VERY HIGH IN INDIA
Source: Colliers Jardine, Asia Pacific Property Trends (October 1999); The Economist (1996)
Kuala
Lumpur
2 6 7 9 1 2 1 3 1 3
2 2
52
100
115
Indexed to New Delhi=100; Ratio of land cost per sq m to GDP per capita in 1999
Sydney Bangkok Tokyo Singapore Jakarta Seoul Taipei Bangalore MumbaiNew
Delhi
18. 2001- 01-10MB-ZXJ151(vd)
Exhibit 1.9
Source: Bank source; CEA, DoT, Ministry of Planning; Interviews; McKinsey Analysis
GOVERNMENT OWNERSHIP HINDERS PRODUCTIVITY
Indexed to US=100 in 1998
Retail banking
Power generation
Power T&D
Dairy processing
Telecom
India private
(average)
Labour productivity Capital productivity
-
-
India public
(average)
27
3
20
10
3.0
0.5
55
10
76
25
8065
60
12
6759
India private
(average)
India public
(average)
19.
20. 2001- 01-10MB-ZXJ151(vd)
Exhibit 1.10
LABOUR PRODUCTIVITY IN MODERN SECTORS UNDER ‘COMPLETE
REFORMS’
Current
productivity
Steel
Automotive assembly
Dairy processing
Wheat milling
Apparel*
Telecom
Power: Generation
T&D
Housing construction*
Retail supermarkets
Retail banking
Software
Expected productivity in 2010Sector
Per cent, US in 1998 = 100
* Modern sector only – transition component excluded
** Extrapolated from the sectors studied to the overall economy
Source: Interviews, McKinsey analysis
Average**
11
24
16
7
26
25
9
1
15
20
12
44
15
78
78
46
17
65
100
52
9
28
90
62
85
43
23. 1
Category Action Key sectors
directly affected
Product
market
1 Eliminate reservation of all products for small-scale industry; start with 68
sectors accounting for 80 percent of output of reserved sectors
• 836
manufactured
goods
2 Equalize sales tax and excise duties for all categories of players in each
sector and strengthen enforcement
• Hotels and
restaurants
• Manufacturing
(e.g. steel,
textiles,
apparel)
• Retail trade
3 Establish effective regulatory framework and strong regulatory bodies • Power
• Telecom
• Water supply
4 Remove all licensing and quasi-licensing restrictions that limit number of
players in affected industries
• Banking
• Dairy
processing
• Petroleum
marketing
• Provident fund
management
• Sugar
5 Reduce import duties on all goods to levels of South East Asian Nations (10
percent) over 5 years
• Manufacturing
6 Remove ban on foreign direct investment in retail sector and allow
unrestricted foreign direct investment in all sectors
• Insurance
• Retail trade
24. 2
Category Action Key sectors
directly affected
• Telecom
Land
market
7 Resolve unclear real-estate titles by setting up fast-track courts to settle
disputes, computerizing land records, freeing all property from constraints on
sale, and removing limits on property ownership
8 Raise property taxes and user charges for municipal services and cut stamp
duties (tax levied on property transactions to promote development of
residential and commercial land and to increase liquidity of land market
9 Reform tenancy laws to allow rents to move to market levels
• Construction
• Hotels and
restaurants
• Retail trade
Govern-
ment
owner-
ship
10 Privatize electricity sector and all central and state government-owned
companies; in electricity sector, start by privatizing distribution; in all other
sectors, first privatize largest companies
• Airlines
• Banking and
insurance
•
• Manufacturing
and mining
• Power
• Telecom
Others 11 Reform labor laws by repealing section 5-B of the Industrial Disputes Act;
introducing standard retrenchment-compensation norms; allowing full
flexibility in use of contract labor
• Labor-intensive
manufacturing
and service
sectors
12 Transfer management of existing transport infrastructure to private players,
and contract out construction and management of new infrastructure to
private sector
• Airports
• Ports
• Roads
13 Strengthen extension services to help farmers improve yields • Agriculture
25. 1
Objectives and Approach
The purpose of this study was to identify and prioritise the measures that would
help accelerate India’s economic growth. As we have said, India’s GDP per capita,
the best measure of economic performance, is only 6 per cent that of the US and
50 per cent that of China. Of the two components that make up GDP per capita,
employment per capita and labour productivity (output per employee), increases
in the former will yield only small increases in GDP per capita. Our focus was
thus on labour productivity in India, more specifically, on estimating current
productivity levels and determining how they could be improved. To do this, we
analysed India’s output and productivity gap vis-à-vis output and productivity in
the US and in other developing countries.
In this chapter we explain our approach to this study and the methodology behind
our analyses and conclusions.
APPROACH TO THE STUDY
The main focus of our work was on building a microeconomic understanding of
the performance of 13 sectors in India’s economy, encompassing agriculture,
manufacturing and services, that would be considered representative of the major
sectors of the Indian economy, and then extrapolating these findings to determine
overall productivity levels.
Having done this, we benchmarked the productivity of Indian industry with that of
the best performing economies in the world. We then identified the main barriers
to productivity growth and to the productive investments necessary for output and
employment growth in each sector. By synthesising the results from the 13 case
studies, we drew conclusions on the actions needed to improve India’s economic
performance.
As we have said, productivity growth is the key determinant of GDP growth
(Exhibit 2.1). More efficient use of resources allows the economy to provide
lower cost goods and services relative to the income of domestic consumers and
to compete for customers in international markets. This raises the nation’s
material standards of living (Exhibit 2.2). Productivity growth is also the key
determinant of higher firm profitability if there is free and fair competition (see
“Productivity and Profitability”).
The main debates on improving India’s economic performance have centred
around the importance of privatisation, improving infrastructure, reducing the
budget deficit, containing corruption and liberalising labour laws. However, the
26. 2
bulk of the discourse has neither been conclusive, nor led to a successful reform
agenda. It has focused mainly on India’s aggregate performance without studying
specific industries that collectively drive the performance of the national
economy. In contrast, we believe that systematically analysing the relative
importance of determinants of productivity in a representative set of sectors is
crucial to understanding the nature of India’s economic problems and to
providing convincing evidence to help prioritise reforms.
Our work has emphasised the economic barriers to India’s prosperity in the
medium and long term. We have not addressed the short-term macroeconomic
factors that may affect economic performance at any given moment. In drawing
policy implications from our findings, we bore in mind that higher material living
standards are only one of many policy goals that a government can have. We
believe, however, that higher productivity and output levels release resources that
can be used to address social challenges more effectively.
STUDY METHODOLOGY
The research and analysis in this study are based on the methodology developed
by the McKinsey Global Institute (MGI) and consist of two main steps. First, we
reviewed the data on the country’s overall economic performance as well as
current opinion on the factors behind it as expressed in existing academic and
official documents. This allowed us to capture the current understanding of the
factors in past productivity, output and employment patterns in India. Having done
this, we compared India’s performance with that of the US and other developing
countries to provide a point of departure for our case studies.
Second, we used industry case studies to highlight the economic factors that
explained the performance of different sectors of the economy. Then, by looking
at common patterns across our case studies, we identified the main barriers to
productivity and output growth in India. In doing so, we estimated the impact of
removing such barriers on India’s GDP and employment as well as on the
required levels of investment (Exhibit 2.3).
Sector case studies
The core of the research project was a detailed analysis of 13 agriculture,
manufacturing and services sectors. We selected sectors that covered around 26
per cent of India’s output and 24 per cent of its total employment (Exhibit 2.4)
and represented the following key areas of its economy: agriculture: wheat and
dairy farming; heavy manufacturing: steel and automotive assembly; light
manufacturing: dairy processing, wheat milling and apparel; infrastructure sectors
with large investment requirements: electric power and telecommunications; a
domestic sector with a large employment component: housing construction;
27. 3
service sectors critical to any modern economy: retail, retail banking and the hi-
tech software sector.
In each of the sectors we followed the same two-step process: (1) measuring
current productivity relative to world benchmarks and India’s potential at current
factor costs (see “Interpreting Global Productivity Benchmarks”); (2) generating
and testing hypotheses on the causes of the observed gap.
¶ Measuring productivity: Productivity reflects the efficiency with
which resources are used to create goods and services and is measured
by computing the ratio of output to input. To do this, we first defined
each sector in India such that it was consistent with the comparison
countries, making sure that our sectors included the same parts of the
industry value chain. We then measured the sector’s output using
measures of Purchasing Power Parity and adjusted value added or
physical output. We measured labour inputs as number of hours worked
and capital inputs (used in steel, power and telecom) as capital services
derived from the existing stock of physical capital (see Appendix 2A:
Measuring Output and Productivity). We measured labour productivity
in all 13 case studies and capital productivity in only the most capital-
intensive sectors, i.e., steel, power generation, power transmission and
distribution and telecommunications.
Given the lack of reliable statistical data in some sectors, we
complemented official information with customised surveys and
extensive interviews with customers, producers and regulators (Exhibit
2.5). This methodology was particularly helpful in deriving bottom-up
productivity estimates in service sectors such as housing construction,
retailing, retail banking and software, where traditional sources of
information are particularly unreliable and incomplete. Finally, given
the size of the Indian Territory, we also conducted over 600 interviews
in different cities to account for regional performance differences.
These interviews were particularly helpful in sectors such as wheat
farming, dairy farming and retail, where local policies (especially as
they relate to soil conditions and land use) are a crucial determinant of
competitive intensity.
¶ Generating and testing causality hypotheses: To explain why levels
of productivity in India differ from the benchmarks, we started by
generating a set of hypotheses on the possible causes of low
productivity. In explaining this productivity gap, we also estimated the
productivity potential of each sector given India’s current low labour
costs. This is the productivity level that India could achieve right now
making only investments that are currently viable. This productivity
potential takes into account India’s low labour costs compared to the
US, which limit the amount of viable investments.
28. 4
In this phase, we drew on McKinsey & Company’s expertise in many industries
around the world, as well as on the expertise of industry associations and
company executives in both India and the benchmark countries. By using a
systematic framework, we captured the major causes of productivity differences
across countries. This framework has three hierarchical layers of causality:
differences in productivity due to practices followed in the production process;
differences arising from industry dynamics; and differences due to external
factors, that is policy and regulatory prescriptions, that explain why the choices
of Indian companies differ from those in the comparison countries (see
Appendix2B: Defining a Framework).
Synthesis and growth potential
Having identified the causal factors for each industry, we compared the results
across industries. The patterns that emerged allowed us to determine the causes
of the aggregate productivity gap between India and the comparison countries, as
well as the potential for productivity growth in different sectors if external
factors were removed. We also estimated the total investment that would be
required to reabsorb displaced labour.
Estimating the expected evolution of output by sector was key in determining the
required investment rate. Taking into account the potential to improve capital
productivity at the sector level, we first estimated the investment requirements
for each of our 13 sectors. We then scaled up the results to the overall economy
taking into account the expected output evolution. We calculated output growth at
the sector level from benchmarks of domestic consumption growth and of the
additional output that could be expected from exports.
Finally, we estimated the resulting evolution in employment. We then
extrapolated our productivity and output growth estimates to the overall
economy, for each sector, to obtain average productivity growth, GDP evolution
by sector and, hence, the employment evolution by sector.
We then tested the feasibility of our overall estimates and assessed the impact of
each policy scenario on the country’s investment levels, skill requirements, fiscal
deficit and balance of payments situation. This allowed us to assess the relative
importance of different barriers and formulate the specific reforms that would
place India on a high growth path.
29. 5
Appendix 2A: Measuring output and
productivity
Productivity reflects the efficiency with which resources are used to create value
in the marketplace. We measured productivity by computing the ratio of output
produced in a year to inputs used in that production over the same time period.
Output (value added)
GDP can be seen as the sum of all the value added across sectors in the economy.
In other words, the GDP of a country is the market value of the final goods and
services produced. It reflects the market value of output produced by means of
the labour and capital services available within the country.
For a given industry, the output produced differs from the traditional notion of
sales. Sales figures include the value of goods and services purchased by the
industry to produce the final goods or services (for example, milk purchased by
dairies to produce pasteurised milk). In contrast, the notion of value added is
defined as factory gate gross output less purchased materials, services and
energy. The advantage of using value added is that it accounts for differences in
vertical integration across countries. Furthermore, it accommodates quality
differences between products, as higher quality goods normally receive a price
premium that translates into higher value added. It also takes into account
differences in the efficiency with which inputs such as energy are used.
In the case study of the retail industry, we used the value added measure of output
while for software we used total sales. One complication that could arise is that
value added is not denominated in the same currency across countries. As a
result, this approach requires a mechanism to convert value added to a common
currency. The standard approach uses Purchasing Power Parity (PPP) exchange
rates, a topic which is discussed separately below.
In sectors where prices for inputs and/or outputs are distorted, we used physical
production as a measure of output. This was the case in dairy farming, wheat
farming, steel, automotive assembly, dairy processing, wheat milling, apparel,
electric power, telecommunications, housing construction and retail banking. To
make our measures comparable to our benchmark countries, we needed to adjust
for the product variety and quality differences across countries. This approach
also required data from the same part of the value chain in every country: In some
countries an industry may simply assemble products while in others it may
produce them from raw materials. Physical measures would tend to overestimate
the productivity of the former, as fewer inputs would be required to produce the
30. 6
same amount of output. To overcome these problems, our adjusted physical
output measure accounts for differences in quality and relative differences in
energy consumption.
Purchasing Power Parity exchange rate
To convert value added in different countries to a common currency, we used
PPP exchange rates rather than market exchange rates. PPP exchange rates can be
thought of as reflecting the ratio of the actual cost of purchasing the same basket
of goods and services in local currencies in two countries.
The reason for not using the market exchange rate was that it only reflects
international transactions; it cannot reflect the prices of non-tradeable goods and
services in the economy. Furthermore, comparisons made on the basis of market
exchange rates would be affected by fluctuations in the exchange rate resulting
from, say, international capital movements.
For our aggregate survey and some of our cases, we used PPP exchange rates
reported by the United Nations and by the Economist Intelligence Unit. In
principle, as long as the products are in the same market, we only need the PPP
for one product and can use the market relative prices to compute the PPPs for
the rest of the product range. In cases where the PPP exchange rates were not
readily available, they were constructed “bottom up” by comparing the actual
market price of comparable goods and services across countries, and then
aggregating the individual prices up to a “price” for sector-specific baskets of
goods and finally the total GDP.
Finally, we adjusted our PPP rates to exclude sales tax and other taxes and
accounted for different input prices in order to obtain a Double Deflated PPP,
which is the PPP exchange rate ultimately used in our value added comparisons.
Inputs
Our inputs consist of labour and capital. Labour inputs are the more
straightforward to measure: we sought to use the total annual number of hours
worked in the industry by workers at the plant site. When actual hours were not
available, we estimated labour inputs by multiplying the total number of
employees by the best available measure of average hours of work per employee
in the sector. In the case of India, we also needed to account for additional
services provided by some companies that are not usually provided by companies
in the benchmark countries. These included social and recreational services for
workers that are still to be found in some Indian factories (mainly in heavy
manufacturing, e.g., townships provided by steel companies) and are a legacy of
pre-reform times. In these cases, detailed data on workers’ occupation was
needed in order to subtract them from the labour inputs figures used in our
productivity calculations.
31. 7
In the steel, electric power and telecommunications case studies we also
measured capital inputs. The heterogeneity of capital makes measuring capital
inputs more difficult. Capital stock consists of various kinds of structures (such
as factories, offices and stores) and equipment (such as machines, trucks and
tools). The stock is built up incrementally by the addition of investment (business
gross fixed capital formation) to the existing capital stock. Each piece of capital
provides a flow of services during its service life. The value of this service is
what one would pay if one were leasing this asset and this is what we used as our
measure of capital inputs. To estimate the current value of capital stock we used
the real Gross Fixed Capital Formation data provided by the Annual Survey of
Industries published by the Central Statistical Office (CSO). In certain instances,
such as the telecommunications sector, the CSO data did not match our sector
definition. In this case, we used a “bottom-up approach” and constructed the
capital figures from the companies’ balance sheets.
Once we had measured capital stock, we constructed our capital service measures
using the Perpetual Inventory Method (PIM). We based our estimates on US
service lives for structures and equipment. Although ideally we would have liked
to measure the capital inputs in each of our case studies, we concentrated on the
steel, electric power and telecommunications industries since they were the most
capital-intensive sectors in our sample. For the remaining case studies, we
treated capital as a causal factor in explaining labour productivity.
32. 8
Appendix 2B: Defining a framework
To arrive at a detailed understanding of the factors that contributed to the gap
between current and benchmarked productivity, we used a framework
incorporating causes of low productivity at three levels: in the production
process; in industry dynamics, i.e., the conduct of players in the industry; and in
the external factors that shape managerial decisions, i.e., policy and regulation.
Possible barriers to high productivity are also described to explain the
importance of each cause and to introduce some of the barriers that are presented
in the later discussions.
Production process
The first set of factors affecting productivity arise in the production process and
can be grouped into operations, product mix/marketing and production factors. It
is important to remember that factors in the production process are in turn
determined by elements of a firm’s external environment that are beyond its
control and decisions made by its managers.
¶ Operations: A large number of operational processes determine
productivity. They are:
• Organisation of functions and tasks: This is a broad category
encompassing the way production processes and other key functions
(product development, sales, marketing) are organised and run. It
reflects managerial practices in most areas of the business system
as well as the structure of incentive systems for employees and
companies.
Ÿ Excess labour: These are workers who could be laid off
immediately without any significant change to the organisation of
functions and tasks. It also includes the variable portion of workers
still employed despite a drop in output.
• Design for manufacturing (DFM): DFM is the adoption of
efficient building or product design by using an optimal site/plant
layout, then using standard, interchangeable and cost competitive
materials.
• Capacity utilisation: This represents the labour productivity
penalty associated with low capacity utilisation given the fixed
proportion of workers (i.e., management, machine operators,
maintenance, etc.).
33. 9
• Suppliers: Suppliers can contribute to industry productivity through
efficient delivery, collaboration in product development or products
and services that facilitate production (e.g., material suppliers in
residential construction). They can cause productivity penalties
through lower quality supplies or services and fluctuations in the
delivery of inputs.
• Marketing: Within product categories, countries may differ in the
quality of products made. Production of higher value added products
or services using similar levels of input is reflected in higher
productivity (e.g., branding in software services). Another source of
productivity differences within product categories is product
proliferation (e.g., the variety of Stock Keeping Units –SKUs–in
retail). A wide range of product or service lines can reflect a sub-
optimal product mix that reduces productivity. Finally, both within
the manufacturing sectors and in services, design can influence
which technology might be applied. Design changes might simplify
the production process and improve productivity.
• Labour skills and trainability: This factor captures any possible
labour productivity penalties due to lower frontline trainability
potentially caused by lower educational levels, different educational
focus (discipline/skills), low frontline worker motivation, lack of
incentives/possibility for top management to impose changes. It is
also a factor when (older) workers/middle management find it
particularly difficult to break old habits.
¶ Product/Format mix: Countries may differ in the categories of
products they demand or supply, and a productivity penalty can arise if a
country’s output consists of a higher share of inherently less productive
product or service categories (such as mud houses in housing
construction). Demand for such output is mainly the result of
consumers’ inability to afford inherently more productive products
(such as brick houses).
¶ Technology: The choice and use of technology affects productivity
through three factors:
• Lack of scale: Higher production scale generally leads to increased
productivity if fixed assets are a large enough proportion of total
costs. We use capital in the sense of physical assets and their
embodied technologies (such as machines, plants, buildings and
hardware). We classify assets as being sub-scale when they do not
reach the minimum efficient scale.
Ÿ Lack of viable investment: This refers to investment in upgrading
as well as new investment that would be economical even with
India’s low labour costs. For our calculations, we applied current
wage levels and a weighted average cost of capital (WACC) of 16
34. 10
per cent typically used by domestic and foreign corporations in
India.
• Non-viable investments: This refers to investment in upgrading
assets as well as investment in green field operations that would not
be economical given India’s low relative labour costs. As a result,
this category includes investments that are not being made only
because of the lower relative cost of labour (such as full packaging
automation).
Industry dynamics
The competitive pressure in the industry influences management decisions to
adopt best practices in production. We studied the influence of three factors:
¶ Domestic competitive intensity: This refers to differences in the
industry structure and the resulting competitive behaviour of domestic
players. Other factors being equal, more competition puts more
pressure on management to adopt more productive processes.
Industries with high competitive intensity typically experience frequent
entry and exit of players as well as changes in prices and profitability.
¶ Exposure to best practice: This includes competitive pressures from
foreign best practice companies either via imports or through foreign
direct investment (FDI).
¶ Non-level playing field: In a well regulated and well functioning
market economy, the same laws and rules (such as pricing, taxation)
apply to different players in the same industry, ensuring that
productivity levels will determine who succeeds and who fails.
Conversely, in markets where regulation is differentially applied,
companies can often ignore productivity pressures since less
productive firms may flourish at the expense of more productive ones.
External factors
External influences on productivity relate to conditions in the economy or policy
and regulatory prescriptions that determine how companies operate. These
factors are largely outside the control of firms and include:
¶ Macroeconomic conditions (e.g., labour costs or income levels):
To illustrate, for a given level of capital costs, where labour costs are
low relative to capital, managers will use less automated production
processes. This could reduce labour productivity. Low incomes may
lead to the consumption of inherently less productive products and
services hampering the country’s overall productivity.
35. 11
¶ Macroeconomic barriers: Policy and practice within the overall
economy can have a negative impact on productivity. For instance, large
public budget deficits increase the cost of funds for private investors,
since the government’s need to borrow to make up the deficit pushes up
interest rates. Furthermore, the general economic environment in which
managers operate affects their planning horizon, investment decisions
and everyday operational decisions. Investments are more difficult to
commit to in an unstable macroeconomic and political environment
where high inflation rates, uncertainty about exchange rates, or
frequently changing fiscal policies generate additional uncertainty. This
instability leads to higher capital costs (for domestic investors) or
higher country risk (for foreign investors). These higher discount rates
will lead profit-maximising managers to choose different production
technologies, resulting in labour and capital productivity differences
across economies.
¶ Capital markets: Distortions in the capital market (such as
administered interest rates) result in an inefficient allocation of capital
across sectors and firms and will distort the market’s ability to reward
productive firms.
¶ Government ownership: The amount of pressure from owners or
shareholders can influence the rate at which productivity is improved.
Companies under government ownership are often not under much
pressure since they receive subsidies that allow them to compete
against more productive players.
¶ Labour market: How the labour market is regulated as well as the skill
levels within it also affect productivity. Labour regulations may
influence the implementation of productivity improvements (e.g., by
restricting efforts to reduce excess workers). With regard to skills,
managers and frontline workers in one country may have lower levels of
education or a different educational focus (discipline/skills) than those
in other countries. This may lead to lower frontline skills/trainability,
resulting in lower productivity.
¶ Product market: Regulations governing different sectors of the
economy can pose barriers to productivity growth (Exhibit 2.6). They
include:
• Entry barriers: Regulations prohibiting or discouraging
investment in certain services, products or players can lower the
productivity of a sector. These include restrictions on the size of
players (e.g., the reservation of products for manufacture by small
scale industry), origin of players (in the form of trade barriers and
restrictions on FDI) or type of player (e.g., licensing in dairy
processing that prevents new private players from entering in certain
areas).
36. 12
• Competition distortions: Regulations can distort competition by
subjecting players to differing rules. These include direct tax breaks
and/or subsidies for certain kinds of players, such as small-scale or
government-owned firms. They also include regulations that limit or
distort competition by protecting or favouring incumbent companies
(as in the telecom sector). Similarly, regulations prohibiting or
discouraging certain products or service offerings (including
regulations on pricing) can harm productivity, for example, by
forcing farmers to sell through intermediaries.
Ÿ Lack of enforcement: Unequal enforcement of tax (as in tax
evasion by small retailers) as well as other acts of omissions (such
as the lack of enforcement of intellectual property rights in
software) also distort competition. As an example, uneven
enforcement of energy payments among different kinds of players
will also create differences in costs and value added. This is
particularly relevant in energy intensive manufacturing sectors such
as steel.
• Other product market barriers: Other policies and practices that
can harm productivity include:
– Standardisation: Although many firms and consumers benefit
from standards, individual firms often do not have sufficient
incentive to promote a standard. Government intervention is
often required (for instance, in quality standards for construction
materials) on the grounds that the society does not yet have the
means or incentives to invest in standardisation.
– Threat from red tape/harassment: Excessive red tape and
regulatory harassment increase costs through the time and other
investments needed in negotiating complex procedures, limiting
the incentives of firms to optimise operations.
¶ Land market barriers: Distortions resulting from the tax system or
regulations relating to land use can prevent efficient use of land.
Examples are low property taxes, stringent tenancy laws, discretionary
procedures for government procurement contracts and land allocation.
Another barrier is a defective system of land titles, which prevents the
formation of an efficient land market thereby distorting the allocation
of land among players.
¶ Problems imposed by related industries: Supplier or downstream
industries can hamper productivity by reducing the competitive
pressures on industry players. An underdeveloped upstream industry can
also impose significant productivity costs by failing to provide products
or services that facilitate production or by delivering lower quality
37. 13
goods or services and/or at irregular frequencies (e.g., irregular milk
supply to dairy processors).
¶ Poor infrastructure: This includes issues in the country’s
infrastructure such as roads, transportation and communications. As a
related sector, infrastructure can affect productivity either through the
demand side (for instance in inefficient distribution) or through the
cost side (e.g., in input procurement).
¶ Other barriers: Markets within different countries may vary in the
structure of consumer demand as a result of varying climates, tastes, or
traditional consumption patterns. This influences the product mix
demanded, which can affect the value of the total output and thus
productivity. Productivity penalties may also arise through the structure
of costs as a result of climatic, geographical and geological differences
across countries.
38. 14
Box 1
PRODUCTIVITY AND PROFITABILITY
Within any given market, a firm that is more productive will enjoy higher profitability unless it
suffers from some other source of cost disadvantage. A more productive firm will either
produce the same output with fewer inputs and thus enjoy a cost advantage, or produce better
output with the same inputs and thus enjoy a price premium.
Over time, the higher profitability of productive firms will attract competition. As competitors
catch up in productivity, profitability will tend to converge. In such an environment, the only
way a firm can enjoy higher profitability is by pushing the productivity frontier beyond its
competitors. If, as a result, the firm achieves higher productivity, it will enjoy higher
profitability only until its competitors catch up again. In other words, profitability, in a dynamic
world, is a transient reward for productivity improvements. This linkage holds within a given
market, unless the playing field is not level, i.e., competition is distorted. As we explain below,
an uneven playing field is one of the more important factors in explaining India’s productivity
gaps.
While a more productive firm will enjoy higher profitability within a given market, this may not
be true for firms operating in different markets, for two reasons. First, higher cost of inputs
may render a productive firm in one market unprofitable, while a less productive firm in
another market with lower cost of inputs may be profitable. For example, a US firm may be
more productive but less profitable than an Indian firm because US wages are higher.
Second, competitive intensity may differ across markets so that a productive firm in a highly
competitive market may be less profitable than an unproductive monopolist or oligopolist in
another market. To illustrate, in the 1980s, European airlines enjoyed higher profitability than
their more productive US counterparts because they faced much less price competition.
However, deregulation and globalisation are eliminating distinctions between national markets.
As barriers are removed, productive firms will enter markets with unproductive incumbents.
This could take the form of exports if goods are traded. While cheap input prices may
temporarily shield unproductive incumbents in the importing country, they are not sustainable in
the long run. The cost of capital (a key input price) is converging internationally, and wages
(the other key input price) will eventually catch up with productivity (so that no country can
enjoy both low wages and high productivity in the long run). The other form of market entry
for productive firms is foreign direct investment. In this case, productive transplants will face
the same input prices as unproductive incumbents and will therefore enjoy higher profitability.
In sum, as markets liberalise and globalise, the only sustainable source of higher profitability
for a firm will be to continually achieve productivity higher than that of its competitors.
39. 15
Box 2
INTERPRETING GLOBAL PRODUCTIVITY BENCHMARKS
To assess the performance of Indian industries, we compared their labour productivity levels
with those of the best performing economies in the world. This benchmark allowed us to
measure the existing efficiency of the production processes of Indian companies relative to
their potential efficiency. The comparisons also allowed us to identify the reasons for the
productivity gap through a detailed comparison of production processes and other business
practices in India and the benchmark country.
The global benchmarks should not be perceived, however, as a measure of maximum possible
productivity levels. At any given moment, there are individual companies with productivity
levels above the average of the best performing economy. And over time, the global
benchmark rises as individual companies continuously improve their productivity. So while the
benchmark productivity level can be interpreted as a realistically achievable level of efficiency,
it should not be seen as a limitation.
Independent of the global benchmark for any specific sector, we have chosen to express all
our productivity measures in consistent units defined relative to the US average productivity
level. The US has the highest real income level among large countries, which makes it the
benchmark for the level of total GDP per capita. While this is not the case for several
industries, we believe that using a consistent benchmark unit helps the interpretation of
productivity gaps in individual industries and facilitates performance comparisons across them.
40. 2001- 01-10MB-ZXJ151(vd)
Exhibit 2.1
GDP per
capita
Employment
per capita
Labour
productivity
=
LABOUR PRODUCTIVITY GROWTH DRIVES GDP PER CAPITA GROWTH
• Only small
differences across
countries
• Limited by
demographic factors
• Key driver of GDP
per capita
X
2001- 01-10MB-ZXJ151(vd)
Exhibit 2.2
DYNAMICS OF PRODUCTIVITY LED GROWTH
Productivity
increase in
Company A
Creates surplus:
(Higher value added
and/or lower
labour/capital costs)
• Increase in demand for all
goods (including Company A)
• Increase in investment in all
sectors (including Company A)
Surplus distributed among:
• Retrenched employees (VRS)
• Customers of company
(lower prices)
• Existing employees (Higher
salaries)
• Owners/investors (Higher
profits)
GDP
Growth
Source: McKinsey analysis
41. 2001- 01-10MB-ZXJ151(vd)
Exhibit 2.3
MGI FRAMEWORK: FINDING THE CAUSES FOR LOW PRODUCTIVITY
PERFORMANCE
External
factors
Industry
dynamics
Operational
factors
• Pressure from global best practice
• Domestic competitive intensity
• Non-level playing field
Productivity
levels
• Average
• Distribution
• Growth
• Operations
–Excess labour
–OFT/DFM
–Capacity utilization
–Supplier
–Marketing
–Labour trainability
• Product/Format mix
• Technology
–Lack of scale
–Lack of viable investment
–Non-viable investment
• Macroeconomic barriers
• Capital market barriers
• Government ownership
• Labour market barriers
• Product/land market barriers
• Related industry barriers
• Infrastructure
• Others (e.g. climate)
2001- 01-10MB-ZXJ151(vd)
Exhibit 2.4
SECTOR COVERAGE OF MGI INDIA STUDY
Per cent; million employees in 1997
Employment
Services
Agriculture 63
15
22
Manufacturing
100% = 356
Retailing
Automotive
Steel
Dairy processing
Wheat milling
Apparel
8% coverage
36% coverage
23% coverage
Share of total
employment (%)
Dairy farming
Wheat farming
6
0.01
0.1
0.1
0.3
0.6
12.6
2.0
23.6
Retail banking 0.25
Housing construction 1
Software 0.3
Source: NSSO; MGI
Sectors studied
Power 0.3
Telecom 0.1
42. 2001- 01-10MB-ZXJ151(vd)
Exhibit 2.5
Interviews
Total
Industry
* Does not include survey of 1,000 respondents
Source: McKinsey Global Institute
Dairy farming
Wheat farming
Automotive
Power
Steel
Telecom
Dairy processing
Wheat milling
Apparel
Housing construction
Retail banking
Retailing
Software
627
51
89
15
37
44
32
29
45
56
96
46
54*
33
McKINSEY GLOBAL INSTITUTE’S INDUSTRY STUDIES IN INDIA: NUMBER
OF INTERVIEWS
43. 2001- 01-10MB-ZXJ151(vd)
Exhibit 2.6
KEY PRODUCT AND LAND MARKET BARRIERS
Competition
distortion
Entry barriers
Lack of
enforcement
Other
• Non-level taxes/subsidies/duties
• Non level regulation (e.g., telecom and apparel)
• Force intermediation (e.g., wheat farming)
• FDI restrictions (e.g., retail)
• Entry restrictions/licensing (e.g., MMPO)
• Small scale reservations
• Tax evasion/black money (e.g., housing)
• Lack of IPR enforcement (e.g., software)
• Lack of enforcement of tougher regulation (e.g., power generation and
steel)
• Pricing regulation (e.g., telecom)
• Lack of adequate standards (e.g., construction material)
• CRR/SLR limits in retail banking
Land market
barriers
• Unclear titles
• Low property taxes/user charges
• Rent control/tenant laws
• Zoning laws
ILLUSTRATIVE
44. 1
Current Perspectives on India’s Economic
Performance
A starting point in our study was to review India’s economic performance in the past
decade, and compare it with that of the US and other developing countries. By analysing
available data and reviewing official and academic publications, we identified the main
factors for India’s current economic performance. This allowed us to draw conclusions
on the relative importance of the different barriers to output and productivity growth in
India.
We found these to be quite different from the barriers commonly identified in the
current discourse. According to the ongoing debate, India’s fiscal deficit and its capital
market distortions, restrictive labour laws and poor infrastructure are the most
important of the remaining barriers to rapid growth. Throughout this report, we show
that the real problems lie elsewhere: Important product and land market barriers are
severely hampering India’s economic growth and, more disturbingly, its ability to
absorb an imminent surge in the working age population.
INDIA’S ECONOMIC PERFORMANCE IS SLUGGISH COMPARED TO
OTHER DEVELOPING ECONOMIES
Despite the economic reforms of 1991, India’s economic growth has been slow
compared to the levels achieved by other Asian economies in the past (Exhibit 3.1). To
assess India’s economic development, it is useful to compare its performance with that
of the US, the world leader in productivity and GDP per capita, and to benchmark its
performance against that of other developing countries such as China, Korea, Indonesia
and Thailand, which have been among the strongest Asian performers in the past two
decades. Taking GDP per capita as a measure of economic well-being, we have
explained India’s level of output per capita through the differences in labour inputs
(employment per capita) and labour productivity (the efficiency with which labour
inputs are used to produce a certain level of output).
45. 2
India has the lowest GDP per capita among the benchmark
countries
The best available measure to compare material living standards across countries is
GDP per capita measured in Purchasing Power Parity (PPP) terms. Currently, India’s
GDP per capita stands at around US$ 440 a year, or 6 per cent of US levels (Exhibit
3.2). With a GDP per capita that is about 50 per cent that of China’s, India has the
lowest GDP per capita among our benchmark countries (Exhibit 3.3).
From 1991 – when the economic reforms began – till 2000-end, India’s GDP per capita
has grown at 4.2 per cent a year. Output growth has been lowcompared to that achieved
in Korea, Indonesia, China and Thailand, when they were at India’s current GDP per
capita levels. In fact, at current growth rates, it would take India 18 years to reach the
levels of Indonesia and China, 35 years to reach Thailand and over 50 years to reach
Korea’s levels.
Economic growth in India has evolved in three distinct phases (Exhibit 3.4). Up to the
early 1980s, GDP per capita grew at only 1.6 per cent a year. The government owned
large swathes of industry and rigorously controlled the economy, severely restricting
entry into all its sectors. From the mid-1980s to 1991, GDP per capita grew to around
2.6 per cent a year. This was the result of limited reforms, focusing as they were on
only de-licensing and tariff reduction in just a few sectors. Growth was somewhat
unfettered only in 1991, when more fundamental reforms were introduced, leading to an
increased GDP per capita growth of around 4 per cent a year. Government monopolies
and licensing requirements were abolished in many sectors. Trade tariffs were reduced
and the reservation of certain sectors for small-scale industry were removed. In this
period, output growth in the manufacturing and service sectors increased significantly,
reducing agriculture’s share in the economy from 31 per cent in 1990 to 27 per cent in
1998 (Exhibit 3.5).
Labour productivity increases have contributed most to GDP
per capita growth
Growth in labour productivity has been the key source of past GDP per capita growth in
India (Exhibit 3.6). Since 1993, employment growth has not kept pace with population
growth and increases in GDP per capita have come mainly from higher productivity of
the employed workforce. This trend is consistent with the experience of other countries
such as Korea, Japan, the UK and the US where GDP per capita is highly correlated with
labour productivity levels (Exhibit 3.7). As we have said, the level of labour
productivity reflects the extent to which an economy is making
46. 3
efficient use of its labour inputs. We treat capital inputs as a potential causal factor
affecting the level of labour productivity. Higher levels of investment in mechanisation
and technology will increase the output that each hour of labour can produce.
Employment growth has not kept pace with population growth
Employment per capita in India has declined in the past decade. Since 1991, labour
inputs per capita have fallen at the rate of around 0.7 per cent a year and are now at 81
per cent of the US level. Therefore, despite the creation of around 24 million jobs in
the last 6 years, jobs have not grown at the same rate as has the population.
Employment in India is skewed towards the agriculture sector, which accounts for
around 60 per cent of total employment. In line with the evolution of output described
above, employment in agriculture has decreased from 64 per cent in 1994 to around 62
per cent in 1998 (Exhibit 3.8). Moreover, the agricultural workforce is heavily under-
employed: Of the officially reported agricultural hours, over half actually consist of
idle time (Exhibit 3.9). Most non-agricultural employment is in the non-registered
sector: Only 8 per cent of total employment is in companies registered under the
Companies Act (Exhibit 3.10).1
The situation is quite alarming considering the upcoming demographic changes in India.
By 2010, as much as 62 per cent of the population will be aged between 15 and 59,
leading to a substantial increase in the working age population (Exhibit 3.11). This will
put a significant strain on the economy that can only be contained if India’s GDP grows
at around 10 per cent per year, i.e., at almost twice the current rate.2
High investment levels have produced only limited GDP growth
India’s past GDP growth has been accompanied by a significant increase in capital
stock, which has grown at around 5.4 per cent since 1991 (Exhibit 3.12). In contrast to
the experience of other countries, high investment rates in India have resulted in
relatively low growth. This is partly explained by the fact that around 40 per cent of the
net capital stock in India is in the hands of the government.
The increase in capital stock is due to relatively high investment rates, which have risen
from around 15 per cent of GDP in the 1970s to over 25 per cent in 1997. These
1 In India, the non-registered sector is also called the “unorganised” sector.
2 See Chapter 5: India’s Growth Potential.
47. 4
investments have been almost entirely financed domestically, with foreign direct
investment accounting for around 0.5 per cent of GDP.
But the high investment levels have resulted in relatively limited GDP growth. In the
post reform period, India needed to invest around 4.2 per cent of its output for each per
cent of GDP growth. In contrast, in Thailand, Indonesia, Korea, Malaysia and China, the
investment requirements per unit of GDP growth were up to 30 per cent lower (Exhibit
3.13).
Social indicators have improved
Socio-economic indicators in India have somewhat improved as a result of higher GDP
growth. The proportion of the population below the poverty line has declined from
around 45 per cent in 1980 to 26 per cent in 2000 according to official figures
(Exhibit 3.14). Life expectancy has risen by over 25 per cent (from 50 to 63 years)
between 1980 and 1998. Similarly, the overall literacy rate has almost doubled: from
30 per cent of the total population in 1980 to around 54 per cent in 2000.
CONVENTIONAL PERSPECTIVES ON REASONS FOR POOR ECONOMIC
PERFORMANCE
Our review of academic, official and other documents showed that – in the official and
academic perspectives – a large fiscal deficit, poor infrastructure and stringent labour
laws, among an array of other issues, are major impediments to India’s economic
growth. Unfortunately, these assertions tend to be unsupported by solid arguments or
evidence. Nor do they shed any light on which reforms are the most important ones and
should, therefore, be tackled first by the government.
Product and land market barriers have been largely ignored in the current debate. In fact,
there is a feeling in policy circles that most product market barriers have already been
removed by the 1991 reforms (e.g., through the abolition of licensing in many sectors).
Our study shows clearly that significant product and land market barriers still remain,
and constitute the key barriers to productivity growth, leading to the inescapable
conclusion that removing these barriers constitutes the most important task of the
government.
Conventional perspectives on constraints to economic growth, as reflected in official
and academic documents, can be summarised as follows:
¶ Fiscal indiscipline constrains growth: Current academic and policy
documents often highlight the large fiscal deficit as a key factor in limiting
48. 5
investment and growth in India. Government borrowing to finance the deficit
crowds out private investment by keeping domestic real interest rates high
(Exhibit 3.15).
Despite the 1991 reforms, India’s consolidated fiscal deficit is growing and is
currently at around 11 per cent of GDP (Exhibit 3.16). Poor tax collection
and increasing expenditure are the main causes of the growing deficit.
Subsidies have grown at the expense of capital formation and now account for
around 30 per cent of central government and over 60 per cent of state
government expenditures.
On the external front, things seem more stable. The current account deficit has
substantially decreased from the high pre-reform levels. Net capital inflows
have grown rapidly, boosting foreign exchange reserves (Exhibit 3.17).
Remittances make up most of the inflows, and compensate for the low levels
of foreign direct investment. The government’s managed exchange rate policy
helps boost reserves but results in overvaluation of the rupee, increasing the
cost of importing capital equipment which could increase productivity and
hence GDP growth.
¶ Capital market barriers discourage productive investment: Distortions
in the financial sector are seen as key barriers to productive investment.3
Financial controls such as directed lending increase intermediation costs and
keep interest rates high. Bank operating costs in India account for around 10
per cent of banking assets compared to around 3 per cent in the US and Korea
(Exhibit 3.18). Operational inefficiencies and the large amount of non-
performing assets are also responsible for the high intermediation costs.
Financially unstable players hold almost 85 per cent of the assets in the Indian
financial system and more than 5 per cent of their portfolios make up non-
performing assets (Exhibit 3.19).
¶ Government ownership harms productivity growth: Academic and other
publications sometimes cite government ownership as an important barrier to
productivity and output growth in some sectors. Government ownership
distorts managers’ incentives and directly hampers productivity. Despite
announced plans to privatise key sectors, most Public Sector Units (PSUs)
still remain under government control. As a result, the government still
controls around 70 per cent of employment in the registered sector and 40
per cent of the net capital stock. Key sectors such as oil, power,
3 Financial Sector Policies in India by Surjit Bhalla (Oxus, 2000).
49. 6
telecommunications, insurance and banking are almost completely
government-owned.
¶ Restrictive labour laws are behind slow output and productivity
growth: Labour market distortions are frequently cited as the key reasons for
India’s slow output and productivity growth.4 Stringent labour laws make it
difficult for companies to restructure, thereby hampering their ability to
improve efficiency and expand output.
Employment in India’s registered sector is highly protected. Registered
companies (i.e., those with more than 100 employees) must obtain specific
permission from the state government to retrench or to close down. Stronger
restrictions apply to government-owned companies and managers whose jobs
are directly protected by the state governments.
Enforcement of labour laws also differs between registered and non-
registered sectors. While workers in the registered sector enjoy absolute
protection from retrenchment, contract labour and other workers are under the
perpetual threat of being laid off. Smaller units typically work outside existing
legislation. Moreover, large companies usually sub-contract work to smaller
units to bypass labour laws.
¶ Low labour skills are a further constraint: Low literacy levels within the
labour force are another factor referred to in discussions about low output
levels and low growth. Nearly 50 per cent of India’s population is illiterate. In
contrast, in Thailand, China and Brazil less than 20 per cent of the population
is illiterate (Exhibit 3.20).
The correlation between education and wages has frequently been cited as
evidence of the higher productivity of more educated workers. Recent reports
have paid increasing attention to the role of human capital in economic
growth. Education can affect output in two ways. First, a lack of education
prevents workers from acquiring skills, which directly limits their
productivity. Second, a lack of education prevents voters from making the
choices that would ultimately help improve policy making in the country.
While levels of education are more readily comparable across countries, the
quality of education is also important. There has been concern over the quality
of basic education in India, suggesting that the education gap between India and
4 See “Freeing the Old Economy” by Arvind Panagariya (The Economic Times, 31 Jan 2001).
50. 7
other developing countries may actually be even larger when the quality of
schooling is taken into account.
In our case studies, however, we found that a lack of education is not an
absolute barrier to productivity growth since on-the-job training can often
substitute for education. We also found that this holds true for blue-collar
workers as well as technicians and managers.
¶ Product market barriers have largely been removed: The reforms in
1991 removed some key product market barriers. De-licensing removed
government monopoly in major sectors of the economy. Small-scale
reservation was removed in some export-oriented sectors (Exhibit 3.21), and
reduction in tariffs and duties as well as fiscal concessions on exports boosted
trade and increased pressure on domestic producers. But a large number of
product market barriers remain and are described in relevant chapters. The
current debate on outstanding product market reforms focuses mostly on
small-scale reservation.5 Over 800 labour-intensive sectors remain reserved
for small-scale operations. Small-scale reservation limits scale economies
and increases costs. Moreover, small-scale operations often result in lower
quality and increase the complexity costs for downstream producers who are
forced to source from many small suppliers.
¶ Red tape and corruption discourage investment: The large amount of red
tape and corruption in India is also believed to discourage productive
investment. According to surveys of large companies’ executives, corruption
levels in India are perceived to be substantially higher than in other developing
countries like Korea, Malaysia, Brazil and Thailand (Exhibit 3.22). Multiple
and often conflicting regulations increase red tape (especially in customs)
delaying production and hampering exports. As a result, foreign best-practice
players may be deterred from entering the market, further limiting
competitive intensity.
¶ Inadequate infrastructure is an ever-present barrier: Poor infrastructure
is one of the most frequently mentioned barriers to rapid growth in India. To
take just one element of infrastructure – roads. In a country as large as India,
the capacity of the whole economy to function as one market hinges on
efficient infrastructure that reduces transportation costs and makes regional
producers face competition from one another. But India’s road network is not
5 Small Scale Reservation in India by Rakesh Mohan (NCAER, 1999); “Freeing the Old Economy” by Arvind Panagariya
(The Economic Times, 31 Jan 2001).
51. 8
up to the task, being largely unpaved and in poor condition (Exhibit 3.23).
Furthermore, electricity shortages are common in many regions.
Poor infrastructure not only hampers players in the domestic economy, it also
holds them back when competing in international markets. In India, ports are
heavily utilised but are very inefficient compared to other Asian ports
(Exhibit 3.24). On average, waiting time at berth is 4-5 days in India
compared to less than 1 day in Singapore. This puts exporters at a cost
disadvantage in international markets, and benefits domestic producers by
raising the prices of imported goods.
REAL BARRIERS TO ECONOMIC GROWTH
We have found that the major causes of low productivity lie in the distortions that
create product and land market barriers, which – together with government ownership –
substantially limit labour and capital productivity.
Further, while presenting an extensive list of issues as barriers to economic growth,
official and academic documents offer no indication as to their relative importance. But
prioritising these factors is essential for tailored policy prescriptions.
This prioritisation cannot be accomplished by analysing overall economic performance.
Our India study and our previous work in other countries have taught us that it is
industry-level analysis that provides the answers. By looking at the different factors at
the industry level, we are able to understand how managers operate under current
conditions. Taken together, these individual decisions and actions indicate how policy
and competitive behaviour dictate economic performance.
We have applied this method to 13 key sectors of the Indian economy, as described in
Volume I, Chapter 2: Objectives and Approach. These case studies have helped us
identify the recurring barriers to performance improvement in India. We have (1)
evaluated the economic cost of previously recognised factors in low productivity; (2)
identified new important issues that restrict economic growth; and (3) prioritised the
different barriers in order to identify viable policy actions that can substantially enhance
India’s growth and allow it to meet its biggest need: Generating enough employment for
the surge in the labour force that is a result of the large-scale additions to the working-
age population.
In the following chapters, we describe in detail the factors hampering productivity and
output growth in each of the 13 sectors we have studied. In the final chapters, we
52. 9
provide our perspective on the current performance and growth potential of the Indian
economy as a whole.
53. Exhibit 3.1
20000211DL-ZXL350_8(ECO-PERF)
OUTPUT GROWTH IN SELECTED COUNTRIES
Country
GDP per capita
growth
(CAGR)
Korea
(1970-85)
Thailand
(1985-95)
Indonesia
(1988-97)
India
(1993-99)
GDP per capita at
starting point
(% of US)
10.0
8.2
7.8
5.9
4.2
China
(1990-97)
6
10
6
4
5
Source: World Development Indicators; The Economist (2000)
54. Exhibit 3.2
20000211DL-ZXL350_8(ECO-PERF)
BREAK-UP OF INDIAN GDP PER CAPITA
Source: CMIE (monthly revenue of the Indian Economy, November 1999); manpower (profile India Yearbook 1989); The Economist, 1996
Source: CMIE (Monthly Review of the Indian Economy, November 1999); Manpower (Profile India Yearbook 1999); The
Economist (1996); MGI
100
49
25 23
6
GDP per capita
Labour productivity
100
36 29 22
8
Employment per capita
100
139
86
103
81
Indexed to US in 1996 = 100, 1990-99
Brazil
1996
US
1996
Korea
1996
Poland
1998
India
1999
Brazil
1996
US
1996
Korea
1996
Poland
1998
India
1999
Brazil
1996
US
1996
Korea
1996
Poland
1998
India
1999
Exhibit 3.3
20000211DL-ZXL350_8(ECO-PERF)
0
5,000
10,000
15,000
20,000
25,000
30,000
35,000
0 1,000 2,000 3,000 4,000 5,000 6,000
WORLD DISTRIBUTION OF PER CAPITA GDP BY COUNTRY
India China
US
Population (Millions)
GDPpercapita(1998)
US$, PPP adjusted
Source: Economic Intelligence Unit; OECD; MGI