SlideShare a Scribd company logo
1 of 13
Page 1 of 13
A Cure For Unanticipated Cost and Schedule Growth
Thomas J. Coonce
Thomas J. Coonce, LLC
tom.coonce@verizon.net
+1 703 362 2568
Glen B. Alleman
Niwot Ridge LLC
glen.alleman@niwotridge.com
+1 303 241 9633
ABSTRACT
Delivering programs with less capability than promised, while exceeding the cost and planned durations,
distorts decision making, contributes to increasing cost growth to other programs, undermines the Federal
government’s credibility with taxpayers and contributes to the public’s negative support for these
programs.
Many reasons have been hypothesized and documented for cost and schedule growth. The authors
review some of these reasons, and propose that government and contractors use the historical variability of
the past programs to establish cost and schedule estimates at the outset and periodically update these
estimates with up-to-date risks, to increase the probability of program success. For this to happen, the
authors recommend changes to estimating, acquisition and contracting processes.
INTRODUCTION
Publically-funded programs have consistently delivered less than originally planned capabilities and cost
more than planned and are late. Because public funds are limited, new programs cannot be started, or
worse, they are started and then must be stretched out to fund the overruns of programs that are being
developed. In short, the entire portfolio of programs is affected when most of the programs require more
funds and take longer than planned. Funding authorizers become skeptical of new proposals because the
estimates are not deemed credible. Decisions of choice are distorted since the estimates are in error, or
worse, decision-makers know the numbers are biased low and make best guesses which result in poor
choices. Furthermore, excessive growth in public programs damages the credibility of the estimating
community and contributes to the public’s negative support for these programs.
This paper discusses the never-ending problem of cost and schedule growth in publically funded
programs and offers some recommendations to improve performance within the current Department of
Defense (DOD) acquisition environment. This paper highlights the magnitude of cost and schedule growth
within the DOD and the National Aeronautics and Space Administration (NASA) and summarizes some of
the known and hypothesized reasons for growth. The paper also summarizes some of the initiatives that
have been put in place to address estimating issues but suggests more can be done to improve them,
effectively communicate them, and set these estimates high enough to reflect the historical experience so as
to minimize or eliminate growth in future programs.
The authors recommend specific changes to the way initial estimates are created and agreed to. In
particular, this paper discusses the value of developing activity-based estimates adjusted to account for
issues that have occurred on past similar programs.
The authors propose that programs be budgeted at the 70 percent probability of meeting both cost and
schedule targets – Joint Confidence Level. 1They show how this can be done, including active input from
the contracting community, and how contract management can be improved through the use of risk
registers and periodic probability statements about Estimates At Completion (EAC) and Estimated
Completion Dates (ECD). They also enumerate the implementation challenges, and how they can be
overcome.
1
The Joint Confidence Level connects Schedule, Cost, Risk, and Uncertainty in a single assessment of the probability
of program success, http://www.nasa.gov/pdf/724371main_76646-Risk_Analysis_Brochure-Final6.pdf
Page 2 of 13
COST AND SCHEDULE GROWTH – A PERSISTENT PROBLEM THROUGH THE DECADES
“In 1982, an unnamed witness at a House Armed Services Committee stated, ‘enough material has been
written on the subject of cost growth during the last ten years to fill a Minuteman silo. Unfortunately, cost
growth is still with us. In a decade since that testimony enough additional information on cost growth has
been written to fill a second minuteman silo.” 2
Table 1 summarizes cost growth associated with NASA and DOD research programs. 3 Although this
information is somewhat dated, the growth trend has not been materially reduced since the time this study
was completed. Figure 1.0 below illustrates the cost and schedule growth of 30 NASA missions that were
developed in the 2007 – 2009 time frame. 4
Table 1.0. Cost Growth Experience, 2004 NASA Study showing increasing growth over the decades in spite of all
efforts to control this growth through improved insight and management processes.
Figure 1.0 – Cost and Schedule Growth of 30 NASA Missions, 2007 - 2009
2
Cost Growth in DOD Major Programs: A Historical Perspective, Col. Harry Calcutt, April 1993,
http://www.dtic.mil/dtic/tr/fulltext/u2/a276950.pdf
3
Unpublished 2004 NASA study performed by Drs Joseph Hamaker and Mathew Schaffer.
4
Unpublished 2009 NASA study
42%
29%
21%
0%
10%
20%
30%
40%
50%
60%
From
Phase B
Start
From
PDR
From
CDR
DevelopmentCostGrowth
29%
23%
19%
0%
10%
20%
30%
40%
50%
60%
From
Phase B
Start
From
PDR
From
CDR
PhaseB/C/DScheduleGrowth
Average Median
NASA in the 90s 36% 26% 78%
NASA in the 70s 43% 26% 75%
NASA in the 80s (GAO) 83% 60% 89%
DoD RDT&E 45% 27% 76%
Cost/Budget Growth
Study
Percent of Projects
Which Experienced
Page 3 of 13
Reasons for Cost and Schedule Growth
As stated earlier, volumes have been written about programs failing to provide promised capabilities at
the agreed cost and projected completion dates. Most of these studies attempted to categorize the root
causes, so corrective actions could be taken. Some of the causes are related to estimating and acquisition
initiation activities while others focused on issues associated with management and / or contract execution.
One of the more comprehensive studies was performed by Colonel Harry Calcutt in 1993. 5 Following are
Col. Calcutt’s reasons for growth organized into five categories.
 Requirements:
o Poor initial requirement definition
o Poor performance/cost trade-off during development
o Changes in quantity requirements
 Estimating:
o Errors due to limitation is estimating procedures
o Failure to understand and account for technical risks
o Poor inflation estimates
o Top down pressure to reduce estimates
o Lack of valid independent cost estimates
 Program Management:
o Lack of program management expertise
o Mismanagement/human error
o Over optimism
o Schedule concurrency
o Program stretch outs to keep production lines open
 Contracting:
o Lack of competition
o Contractor buy-in
o Use of wrong type of contract
o Inconsistent contract management/admin procedures
o Too much contractoroversight
o Waste
o Excess profits
o Contractors overstaffed
o Contractor indirect costs unreasonable
o Taking too long to resolve undefinitized contracts
 Budgeting:
o Funding instabilities caused by trying to fund too many programs
o Funding instabilities caused by congressionaldecisions
o Inefficient production rates due to stretching out programs
o Failure to fund for management reserves
o Failure to fund programs at most likely cost
5
Ibid, Calcutt, p.17
Page 4 of 13
A second study from DOD’s Office of Program Assessment and Root Cause Analysis (PARCA)
published a recent report, which categorized growth into two broad categories:6
 Inception:
o Unrealistic performance expectations
o Unrealistic baseline estimates for cost or schedule
o Immature technologies or excessive manufacturing or integration risk
 Execution related
o Unanticipated design, engineering manufacturing or technology integration issues
o Changes in procurement quantities
o Inadequate program funding or funding instability
o Poor performance by government or contractor personnel
INITIATIVES TO REDUCE COST AND SCHEDULE GROWTH
Over the last five decades, the DOD, NASA, and other civilian agencies have implemented numerous
policy and regulation changes to reduce growth. This paper does not attempt to enumerate all the initiatives
nor assess their effectiveness in combating growth. However, this paper does address those initiatives
dealing with estimating and the processes used to establish and manage contractor baseline estimates.
A few of the more important initiatives to improve the ability of the cost estimating community to
produce better estimates were:
 Need for independent estimating at all levels;
 Standardized Work Breakdown Structures (WBS) for military systems e.g., MIL-STD 881, and
similar structures for NASA and the National Reconnaissance Office;
 Routine cost collection of analogous historical systems upon which to base future estimates;
 Use of a Cost Analysis Requirements Description (CARD) (or similar documents) to be used as a
basis for the estimates;
 Use of technical and program management subject matter expertise to assist in developing
estimates; and
 Policy requirements to budget to higher confidence levels (80 percent cost confidence level within
DOD and 70 percent joint cost and schedule confidence level for NASA projects).
These initiatives are believed to have helped estimators create more credible estimates. Using the actual
experience of similar past projects has been particularly useful as it helps estimators explain the basis for
their estimates and provides leadership with a reference by which to judge the proposed new systems.
However, these data are product-based (based on the systems’ WBS) and Program Management Offices
(PMOs) often think in terms of the materiel developers (contractors’) activities so they find the product-
based estimates difficult to consume, particularly when the independent estimates are higher than those the
PMO receives from one or more contractors. PMOs frequently discount the independent estimates in favor
of the contractor-developed estimates they find easier to understand.
Figure 2 depicts the traditional method in which the cost estimating community develops its estimates.
The chart shows that the cost estimate is a function of the value of the cost driving para meter as well as the
variability of the costs that have been incurred for the product in the past. The figure illustrates that the
higher the input parameter, the higher the cost, but that the estimated cost also depends on the point within
the distribution of cost values that have been incurred on past similar programs. Cost estimators prefer to
provide estimates at the mean or higher for a given WBS element. Estimates created in this way are
considered to be standard acceptable practice and result in credible estimates. However, as noted earlier,
the estimates are not always in the same language as the PMO or the contractors and thus are difficult to
consume.
6
Report to Congress on Performance Assessment and Root Cause Analyses, Office of the Under Secretary of Defense
for Acquisition, Technology and Logistics, March 2014, p. 7, http://www.acq.osd.mil/parca/docs/2014-parca-report-
to-congress.pdf
Page 5 of 13
Figure 2.0 – Traditional method of estimating by the WBS product or process defines the variances on the cost
estimate compared to the drivers of the cost, in this example the “weight” of the product being produced. The weight
becomes a “technical performance measure. Being outside the weight bounds will cost more for the product to be
produced.
Page 6 of 13
Figure 3 depicts an activity-based estimate built up using the schedule of activities and the resources
associated with the activities. This is known as a cost or resource-loaded schedule that is based upon a set
of expected activity durations and costs for the resources. This is the type of estimate that contractors
submit in response to RFPs and used to set contract baselines for reporting progress to the PMOs. When
independent WBS-based estimates are higher than those submitted by contractors, PMOs find it near
impossible to analyze where the extra cost should be added to the contractors’ activity-based estimates.
Thus, the WBS-based estimates are not as “consumable” as ones that are based on a set of generally agreed
activities.
Figure 3.0 – Sample Activity-Based Estimate derived from the Integrated Master Schedule (IMS). Costs are assigned
for each work element in the IMS, usually within a Work Package, using the WBS number to identify this unique
assignment. These costs are then “rolled” up to the Control Account and then the program at the top. These costs are
reported in DI-MGMT-81861’s IPMR Format 1.
A POSSIBLE SOLUTION TO SOLVE COST AND SCHEDULE GROWTH
While activity-based estimates are easier to explain, they still need to be credible and to do so, they too
must be informed with the variance of the activity durations and costs fromsimilar historical programs. The
variance of the cost associated with an activity-based plan has two components – costs that vary with the
passage of time and cost that are independent of time. A good example of a cost that is time independent is
material. An example of a cost that is time dependent would be systems engineering or progra m
management which must be in place as long as the program is under development. Similar to the variance
in the cost of each WBS element, each activity has a variance in duration and the cost associated with those
durations (both time dependent and time independent). In the end, the cost and cost variance of a given
system that is aggregated by WBS must be the same of the cost and cost variance that is collected by
activities. This concept is depicted in Figure 4.0 below.
It should be noted that variance of cost and schedules reflect the variation that occur in the “normal”
process of developing similar programs. This is referred to as the natural uncertainty that occurs and
estimates of future programs must take this into account. Some researchers have labeled this uncertainty as
“irreducible” because a manager cannot take specific actions to reduce the “risks”; rather, the manager
must just recognize that this variation occurs as part of the normal process of development. 7 The amount of
7
Irreducibility Uncertainty – a Fact of Life for Reserve Estimates, John D. Wright, SPE Annual Technical Conference
and Exhibition, 5-8 October, Denver, Colorado, Society of Petroleum Engineers, 2003.
Page 7 of 13
uncertainty that “should” be included has been discussed within the community within the past ten years.
The Weapon Systems Acquisition Reform Act of 2009 specified that all major programs within DOD
should be budgeted at the 80 percent cost confidence level. That policy for the DOD was recently rescinded
in favor of point estimates that reflect “… a confidence level such that it provides a high degree of
confidence that the program can be completed without the need for significant adjustment to program
budgets.”8 NASA requires all programs to be budgeted such that the programs possess a 70 percent
probability of achieving both cost and schedule targets. Assuming cost and schedule are independent,
identically statisticaldistributions, this implies an 84 percent confidence level for cost separately.
Figure 4.0 – Cost Distributions Are The Same Regardless of Estimating Technique
Some have advocated that estimates just need to be conservative. Others have argued that probabilistic
estimating should not be done at all since the historical data are scant and therefore, assessed values reflect
the estimator’s judgment and those could be biased and difficult to explain. Yet still others have advocated
budgeting programs a high confidence levels (above 80 percent) and perhaps raise it higher if the growth is
not contained. Still others have advocated that budgeting programs at high confidence levels is inefficient
as certain programs will be over-budgeted and other worthy programs will not be started. Others have
argued that high confidence levels will only result in higher costs over time as program managers will
expand requirements to use up any funds that appeared to be in excess of those required.
The authors assert that it is not possible to predict in advance which of these scenarios will occur unless
setting the budget at some confidence level is tried. The authors observe that the community has never
really tried budgeting programs at confidence levels that are based on well-understood historical data.
(NASA has only recently done so and it is too early to conclude whether this has had a positive impact on
cost and schedule growth). Anecdotal information suggests that some programs within the DOD have been
budgeted at a stated 50% confidence level, yet experienced rather significant over runs in costs and
Innovative Design Manufacturing Research Center (IdMRC) – Cost Modeling, 24th
International Forum on
COCOMO – November 2009.
A Framework for Considering Uncertainty in Quantitative Life Cycle Cost Estimation, Proceedings of the ASME
2009 Design Engineering Technical Conferences & Computers and Information Engineering Conference,
IDETC/CIE 2009,
8
FY2011 Annual Report on Cost Assessment Activities, Director, Cost Assessment and Program Evaluation (CAPE),
February 2012, p.7-8.
Page 8 of 13
completion dates in excess of plan. The authors take the position that programs should be budgeted at a
higher confidence level (above 80 percent for cost and schedule separately) using agreed to historical data
and then observe if this controls the unanticipated growth.
IMPLEMENTATION DETAILS
Setting the budgets at a high confidence level will necessitate modifications in estimating methods
(noted above), the contracting process,and implementation. These are described below.
The first step requires that government program offices (PMOs) take a more active role in clarifying
requirements, and developing the top-level plan (cost-loaded schedule) with an associated statement about
the probability of success (technical, cost and schedule). This top-level plan ought to form the basis for the
first draft of the annual resources required. The second major step involves getting feedback from the
contracting community concerning the probability of delivering program capabilities for the targeted cost
and delivery date. The government will do this by issuing a Request for Information (RFI). PMOs will then
analyze industry’s feedback, modify the requirements, budget or time (or all three) and then issue a Request
for Proposal (RFP). And finally, along with their technical approach, contractors will submit their cost-
loaded plans, risk registers, and probability statements in response to RFPs.
The processes to complete the first major step – development of the RFI – are depicted in Figure 5.0
below and described in the following paragraphs.
Figure 5.0 – Develop draft plan and obtain industry feedback. This feedback will confirm if the government
generated cost-phased estimate is credible from the past experience of industry. This approach is used in Japan’s
defense acquisition system. It engages the government and the providers in a dialogue in search of a phased plan that
can increase the probability of success for the program
Page 9 of 13
The first step in this process (1.0) is to develop an Integrated Master Plan (IMP). This is a top-level
picture of the general sequence of activities needed in order to mature the capabilities desired. This should
be developed per the Department of Defense’s (DOD’s) Integrated Master Plan and Integrated Master
Schedule Preparation and Use Guide.9
The second Step is to develop a top-level Integrated Master Schedule. This schedule is notional but
reflects the PMO’s thoughts on how the system capabilities ought to be developed. By its nature, the
schedule is high level, but still includes a logical structure of activities. It ought to reflect the PMO’s
thoughts about which activities can be performed in parallel and which must be serial. The activity
durations are based on the amount of time of similar past programs.
In Step 3, the PMO adds the resources (costs) associated with the high level schedule developed in
step 2. Ideally, the cost associated with the activities will be available from databases. However, if they are
unavailable, the PMO should estimate the costs. Some of the cost information could come from the
developed independent estimates but transformed into the number of people, labor rates and material costs.
Ideally, these discrete estimates ought to be equal to or higher than the mean of the historical data.
The forth step is to create a risk register (RR) that will be used along with the top-level cost loaded
schedule (developed in step 3) to develop cost and schedule confidence levels (step 5) for the PMO’s draft
plan. The risk register should contain, at a minimum, information about the variation of the activity
durations and associated costs from the historical database. As discussed earlier, this uncertainty represents
the “natural variation” associated with developing similar programs, i.e., the irreducible risks. The risk
register should also include the specific discrete risks that the PMO feels is unique to the program. This
uncertainty (risk) should have an associated probability of occurrence and a cost and/or schedule
consequence if it does occur.
In the fifth step, the PMO should use appropriate Monte Carlo simulation software with the Risk
Register developed in Step 4 and the top-level cost-loaded plan developed in step 3 to develop cost and
schedule confidence levels for the targeted budget and development duration.
In sixth step, the PMO adjusts cost and or program duration to achieve a “reasonable” confidence level.
The authors believe that PMO should select a targeted cost with at least a 70 percent joint cost and schedule
confidence level (above 80 percent for cost and schedule separately).
Once the RFI has been issued, contractors are expected to review and comment on the PMO’s draft plan
and answer the following questions:
1. Is the top-level plan logical given the technical challenges and capabilities required? If no,
a. What other activities should be included or dropped?
b. What changes in logic are required?
2. Are activities durations “consistent” (within family) of their experience?
3. Are the costs “consistent” (within family) of their experience?
4. Is the PMO’s perspective on risks realistic? If not,
a. Which risks are overstated?
b. Which risks are understated?
c. Which risks were missed? What is the contractor’s assessment of probabilities and
consequences forthose risks? (Included in their risk register).
Contractors are expected to provide an updated high-level cost-loaded schedule, updated risk register,
and associated probability statement of achieving the desired capabilities within the desired budget and
duration. These submissions are not considered proposals; rather, they are considered inputs to the PMO on
how the contractor might proceed, along with the associated confidence levels for the stated resources.
Upon receipt of the contractors’ responses to the RFI, the PMO modifies the top-level plan and creates a
Request for Proposal (RFP) that reflects the contractors’ concerns and notional plans. This process is
depicted in Figure 6.0 below.
9
Integrated Master Plan and Integrated Master Schedule Preparation and Use Guide, October 21, 2005
Page 10 of 13
Figure 6.0 – The process to improve the Request for Proposals (RFP) starts with an assessment of the responses
from the Request for Information, where contractors provided their cost estimates.
In step eight, the PMO assesses the contractors’ concerns and evaluates their top-level plans, risk
registers, and confidence levels on the risk and their reduction through the handling plans. The PMO
evaluates and synthesizes the concerns expressed about the capabilities, top-level plan; the risk registers
and revises the PMO plan including the budget profile (step 9). Certain capabilities might be dropped or
revised to reduce the development risk. The PMO will re-run their Monte-Carlo simulations to determine
the confidence levels for the original budget and duration. PMOs increase the budget and/or development
period in order to achieve at least a 70 joint cost and schedule confidence level (step 11). Once this is done,
the PMO prepares and issues the RFP.
Contractors develop their responses the RFPs in the normal fashion, but will include their final risk
registers along with their implantation plans contained in a schedule model instrumented with Monte
Carlos Simulation software. The response will include probability statements about the achieving the cost
and schedule targets. This response and deliverables should be similar to the cost-loaded schedule
submitted in response to the RFI. This process is depicted in Figure 7.0 below.
8.0
Assess
Responses to
RFI
Updated Risk
Register (RR)
Updated Program Capabilities
(Requirements)
10.0
Re-create
Joint
Probability
Distribution
Updated Cost-Loaded IMS
11.0
Decide on
TargetedCost
and
Completion
Date
Multiple responses
12.0
Create
Request for
Proposal
(RFP)
9.0
Update IMP/
IMS, Risk
Register,
and/or
Modify
Rqmts
Page 11 of 13
Figure 7.0 – Contractor process to generate responses to RFPs using the earlier cost estimates developed and shared
by all the participants in the acquisition process. The government now has a credible estimate of the cost, schedule, and
technical performance and makes the selection on “Best Value.”
The next step is the selection of the winning contractor. In addition to other selection criteria, the
government will include “Implementation Plan Realism” as part of its selection criteria. Inclusion of the
cost-loaded schedule and the contractors’ risk registers will permit the government evaluators to assess the
credibility of the contractors’ plans and perspective on risks. Plans which reflect documented actual
historical experience, control for the discrete risks, i.e., include resources in their plans to address or control
them, and possess a joint cost and schedule confidence levels in excess of 60 percent, should be awarded
higher scores.10
At the Integrated Baseline Review, the contractor will:
a) Show how progress will be objectively measured in units of measure meaningful to the decision
makers, through Technical Performance Measures derived from the Integrated Master Plan. It is
essential that technical progress be the driver of the reported cost and schedule progress. Without
progress measures that are meaningful to the PMO, the contractor will be unable to propose
corrective actions to keep the contract effort “on-track”; and
b) Develop a Performance Management Baseline (PMB) such that it has at least of 50 percent
probability of meeting both cost and schedule targets and demonstrate the contractor possesses
sufficient Management and Schedule Reserves (schedule margin) to maintain a minimum of a 60
percent joint probability of success. If the contractor proposes a PMB with less than 50 percent
joint probability of meeting cost and schedule targets in its baseline, the contract should be
amended (reduce capabilities, increase cost and/or schedule), or be cancelled. Contracts should not
be started if the PMB has less than a 50/50 change of success.
10 The selection of the joint confidence level could vary, but 60 percent is chosen as an absolute
minimum. In order to tame cost and schedule growth, contracted efforts ought to have better than 50/50
change of meeting targets.
13.0
Create
Contractor
Versionof
IMP
14.0
Develop
Summary
Level IMS
15.0
Develop
Detailed
Cost or
Resource-
Loaded
IMS
Contractor Historical Activity
Durations and Associated Costs
17.0
Create Joint
Probability
Distribution
16.0
Create
Updated
Risk
Register
(RR)
Contractor Risk
Register (RR)
18.0
Specify Joint
Confidence Level of
Targeted Cost and
Completion Date
19.0
Complete
Preparation of
Proposal
Response to RFP
Updated Program
Capabilities
(Requirements)
Page 12 of 13
After the contract is awarded, the PMO and the contractor must actively manage the risks and attempt to
develop the desired capabilities while maintaining a high probability of meeting cost and schedule targets.
The PMO must do its part by holding firm on requirement changes – a well-known cause of cost and
schedule growth. The contractor must communicate progress based on the pre-approved TPMs, and
evolving risks. The contractor should submit updated plans every six months to the PMO along with his
risk register and communicate the probabilities associated with its “Best Case”, “Worst Case” and “Most
Likely” Estimates at completion and the Estimated Completion Date. These terms mean little to the PMO
or other stakeholders without associated probability statements and the drivers of cost and schedule from
the risk register content. This information should allow the contractor and PMO to focus on the future risks
and revise their plans to keep the contracts on track.
THE CHALLENGES
There are several challenges that must be addressed in order to implement these recommendations.
These are briefly discussed below.
First, the estimating community must broaden its data collection effort to capture the durations and
associated costs of common high-level development activities. Some of these data may already exist within
the native schedules contained with the Earned Value Management Central Repository (EVM -CR).
Comparison of initial and final schedules could provide useful analogies for future systems. All programs,
regardless of size, have some form of schedule and the community should make a concerted effort to
collect, store and share these data. The authors assert that the contracting communities, particularly those
involved in the construction industry, have done a better job of collecting these data and effectively using
these data, than the government.
Second, PMOs must take more active roles in creating realistic plans for their programs. As noted above,
this means PMOs must create Integrated Master Plans – the architectural document to develop the required
capabilities. They also need to assure themselves that issued RFPs possess an “achievable” outcome within
the resources available. This means that PMOs must develop a top-level cost-loaded plan and compute
probabilities for meeting the cost and schedule targets. Given limited internal resources, PMO will likely
need to obtain outside assistance to perform this function. This is an additional expense to the PMO, but
one that is easily justified.
Third, asking the contracting community for their top-level picture of probabilities in advance of the
RFP might come at a cost. Serious interested vendors will likely make the investment to develop a
summary-level plan, Risk Register, and model to calculate probabilities, but perhaps not. PMOs might have
to contract for systems engineering contracts to provide their perspectives, but cost should be minimal –
less than four staff months worth of effort, each. This will be a s mall price to pay to obtain FRPs that have
a higher probability of success.
Forth, the IPMR Data Item Description (DID) will need to be updated to require: a) submission of the
IMP in responses to RFPs, b) EAC and ECD probability statements in Format 5, and c) inclusion of risk
registers and instrumented schedule models every six months. Requesting the IMP within the RFP should
never be optional as it provides the architectural framework for delivering the desired capabilities. As noted
earlier, it provides the foundation for the contractors’plans – the cost or resource loaded schedule.
Including the probability statements in Format 5 appears to be fairly straightforward and be could be
done with minimal expense, but will be of marginal value to the PMO without the accompanying schedule
model and associated risk registers. A PMO should be able to see the impact to the cost and schedule
outcomes if changes in schedule logic are made of if they have a different perspective on risks. PMOs (or
other stakeholders) should be able to independently exercise the contractors’ models. However, this
requirement could be negotiated in such a way that the contractor will merely be required to develop the
model and be ready to address PMO “what-if” questions.
Page 13 of 13
CONCLUSION
This paper discusses the perennial problem of cost and schedule growth in publically funded programs
and offers recommendations to improve performance within the DOD environment. This paper proposes
that programs be budgeted (with active inputs from industry partners) at a 70 percent joint cost and
schedule confidence level and that contracts be periodically reassessed to ensure high probabilities of
success.
The authors observe that few programs have been budgeted for high confidence levels and cost growth
continues. They assert that setting a relatively high probability of success is necessary to attempt to control
growth and restore credibility with authorizers and taxpayers. The authors also address a number of the
challenges to implement their recommendations and offer suggestions to overcome them.

More Related Content

What's hot

Practices of risk management
Practices of risk managementPractices of risk management
Practices of risk managementGlen Alleman
 
Showing how to Increase the Probability of Project Success by applying the ...
Showing how to Increase the Probability of Project Success by applying the ...Showing how to Increase the Probability of Project Success by applying the ...
Showing how to Increase the Probability of Project Success by applying the ...Glen Alleman
 
Risk assesment template
Risk assesment templateRisk assesment template
Risk assesment templateGlen Alleman
 
Notional cam interview questions (update)
Notional cam interview questions (update)Notional cam interview questions (update)
Notional cam interview questions (update)Glen Alleman
 
Essential views of the IPMR
Essential views of the IPMREssential views of the IPMR
Essential views of the IPMRGlen Alleman
 
Integrating risk with earned value
Integrating risk with earned valueIntegrating risk with earned value
Integrating risk with earned valueGlen Alleman
 
Risk Management Processes (v2)
Risk Management Processes (v2)Risk Management Processes (v2)
Risk Management Processes (v2)Glen Alleman
 
Increasing the probability of program success
Increasing the probability of program successIncreasing the probability of program success
Increasing the probability of program successGlen Alleman
 
Measurement of project quality performance
Measurement of project quality performanceMeasurement of project quality performance
Measurement of project quality performanceK.K. PATHAK
 
Principles of Risk Management
Principles of Risk ManagementPrinciples of Risk Management
Principles of Risk ManagementGlen Alleman
 
Building a risk tolerant integrated master schedule
Building a risk tolerant integrated master scheduleBuilding a risk tolerant integrated master schedule
Building a risk tolerant integrated master scheduleGlen Alleman
 
Cpm500 d _alleman__tpm lesson 3 (v1)
Cpm500 d _alleman__tpm lesson 3 (v1)Cpm500 d _alleman__tpm lesson 3 (v1)
Cpm500 d _alleman__tpm lesson 3 (v1)Glen Alleman
 
Principles of IT Governance
Principles of IT GovernancePrinciples of IT Governance
Principles of IT GovernanceGlen Alleman
 
Getting To Done - A Master Class Workshop
Getting To Done - A Master Class WorkshopGetting To Done - A Master Class Workshop
Getting To Done - A Master Class WorkshopGlen Alleman
 
Increasing the Probability of Success with Continuous Risk Management
Increasing the Probability of Success with Continuous Risk ManagementIncreasing the Probability of Success with Continuous Risk Management
Increasing the Probability of Success with Continuous Risk ManagementGlen Alleman
 
Estimating cost and schedule for monte carlo simulation
Estimating cost and schedule for monte carlo simulationEstimating cost and schedule for monte carlo simulation
Estimating cost and schedule for monte carlo simulationGlen Alleman
 

What's hot (20)

Practices of risk management
Practices of risk managementPractices of risk management
Practices of risk management
 
Showing how to Increase the Probability of Project Success by applying the ...
Showing how to Increase the Probability of Project Success by applying the ...Showing how to Increase the Probability of Project Success by applying the ...
Showing how to Increase the Probability of Project Success by applying the ...
 
Risk assesment template
Risk assesment templateRisk assesment template
Risk assesment template
 
Notional cam interview questions (update)
Notional cam interview questions (update)Notional cam interview questions (update)
Notional cam interview questions (update)
 
Essential views of the IPMR
Essential views of the IPMREssential views of the IPMR
Essential views of the IPMR
 
Integrating risk with earned value
Integrating risk with earned valueIntegrating risk with earned value
Integrating risk with earned value
 
Handling risk
Handling riskHandling risk
Handling risk
 
Risk Management Processes (v2)
Risk Management Processes (v2)Risk Management Processes (v2)
Risk Management Processes (v2)
 
Risk Management
Risk ManagementRisk Management
Risk Management
 
Increasing the probability of program success
Increasing the probability of program successIncreasing the probability of program success
Increasing the probability of program success
 
Measurement of project quality performance
Measurement of project quality performanceMeasurement of project quality performance
Measurement of project quality performance
 
Principles of Risk Management
Principles of Risk ManagementPrinciples of Risk Management
Principles of Risk Management
 
Building a risk tolerant integrated master schedule
Building a risk tolerant integrated master scheduleBuilding a risk tolerant integrated master schedule
Building a risk tolerant integrated master schedule
 
Cpm500 d _alleman__tpm lesson 3 (v1)
Cpm500 d _alleman__tpm lesson 3 (v1)Cpm500 d _alleman__tpm lesson 3 (v1)
Cpm500 d _alleman__tpm lesson 3 (v1)
 
Risk Assessment
Risk AssessmentRisk Assessment
Risk Assessment
 
Principles of IT Governance
Principles of IT GovernancePrinciples of IT Governance
Principles of IT Governance
 
Getting To Done - A Master Class Workshop
Getting To Done - A Master Class WorkshopGetting To Done - A Master Class Workshop
Getting To Done - A Master Class Workshop
 
Increasing the Probability of Success with Continuous Risk Management
Increasing the Probability of Success with Continuous Risk ManagementIncreasing the Probability of Success with Continuous Risk Management
Increasing the Probability of Success with Continuous Risk Management
 
Estimating cost and schedule for monte carlo simulation
Estimating cost and schedule for monte carlo simulationEstimating cost and schedule for monte carlo simulation
Estimating cost and schedule for monte carlo simulation
 
112 risk management
112 risk management112 risk management
112 risk management
 

Similar to Cure for Cost and Schedule Growth

A Possible Cure for Unanticipated EAC Growth
A Possible Cure for Unanticipated EAC GrowthA Possible Cure for Unanticipated EAC Growth
A Possible Cure for Unanticipated EAC GrowthGlen Alleman
 
Portfolio management and the ppbe process at the department of energy white p...
Portfolio management and the ppbe process at the department of energy white p...Portfolio management and the ppbe process at the department of energy white p...
Portfolio management and the ppbe process at the department of energy white p...p6academy
 
A possible cure 2014 may9
A possible cure 2014 may9A possible cure 2014 may9
A possible cure 2014 may9Glen Alleman
 
Coast estimating and assessment guide
Coast estimating and assessment guideCoast estimating and assessment guide
Coast estimating and assessment guideBudi Santony
 
The Programme Certainty Paradox
The Programme Certainty ParadoxThe Programme Certainty Paradox
The Programme Certainty ParadoxHKA
 
WSARA: Baselining Programs Early Compounds the Problems
WSARA: Baselining Programs Early Compounds the ProblemsWSARA: Baselining Programs Early Compounds the Problems
WSARA: Baselining Programs Early Compounds the ProblemsPete Modigliani
 
Zimmerman.marybeth
Zimmerman.marybethZimmerman.marybeth
Zimmerman.marybethNASAPMC
 
BNamericas Project Risk Analytics - June 2015 Inaugural report
BNamericas Project Risk Analytics - June 2015 Inaugural reportBNamericas Project Risk Analytics - June 2015 Inaugural report
BNamericas Project Risk Analytics - June 2015 Inaugural reportnatans
 
Automated Surface Observation System Independent Government Cost Estimate
Automated Surface Observation System Independent Government Cost EstimateAutomated Surface Observation System Independent Government Cost Estimate
Automated Surface Observation System Independent Government Cost EstimateLogapps LLC
 
Does Better Scheduling Drive Execution Success?
Does Better Scheduling Drive Execution Success?Does Better Scheduling Drive Execution Success?
Does Better Scheduling Drive Execution Success?Acumen
 
Why Scheduling Mustn't Be Allowed to Become an Extinct Science
Why Scheduling Mustn't Be Allowed to Become an Extinct ScienceWhy Scheduling Mustn't Be Allowed to Become an Extinct Science
Why Scheduling Mustn't Be Allowed to Become an Extinct ScienceAcumen
 
Estimate costs in fragile and transitional contexts - July - 2014
Estimate costs in fragile and transitional contexts - July - 2014Estimate costs in fragile and transitional contexts - July - 2014
Estimate costs in fragile and transitional contexts - July - 2014Abdulrahman Ismail
 
Chap 5 Estimating Project Times
Chap 5 Estimating Project TimesChap 5 Estimating Project Times
Chap 5 Estimating Project Timesproject management
 
C:\documents and settings\ckampschulte\desktop\in sync risk range analysis
C:\documents and settings\ckampschulte\desktop\in sync risk range analysisC:\documents and settings\ckampschulte\desktop\in sync risk range analysis
C:\documents and settings\ckampschulte\desktop\in sync risk range analysisInSync Conference
 
Chaplowe - M&E Planning 2008 - shortcuts
Chaplowe - M&E Planning 2008 - shortcutsChaplowe - M&E Planning 2008 - shortcuts
Chaplowe - M&E Planning 2008 - shortcutssgchaplowe
 
Project_Management_Institute_A_Guide_to_the_Project_Management_Body-201-300.pdf
Project_Management_Institute_A_Guide_to_the_Project_Management_Body-201-300.pdfProject_Management_Institute_A_Guide_to_the_Project_Management_Body-201-300.pdf
Project_Management_Institute_A_Guide_to_the_Project_Management_Body-201-300.pdfsandipanpaul16
 

Similar to Cure for Cost and Schedule Growth (20)

A Possible Cure for Unanticipated EAC Growth
A Possible Cure for Unanticipated EAC GrowthA Possible Cure for Unanticipated EAC Growth
A Possible Cure for Unanticipated EAC Growth
 
Portfolio management and the ppbe process at the department of energy white p...
Portfolio management and the ppbe process at the department of energy white p...Portfolio management and the ppbe process at the department of energy white p...
Portfolio management and the ppbe process at the department of energy white p...
 
A possible cure 2014 may9
A possible cure 2014 may9A possible cure 2014 may9
A possible cure 2014 may9
 
033
033033
033
 
Coast estimating and assessment guide
Coast estimating and assessment guideCoast estimating and assessment guide
Coast estimating and assessment guide
 
The Programme Certainty Paradox
The Programme Certainty ParadoxThe Programme Certainty Paradox
The Programme Certainty Paradox
 
WSARA: Baselining Programs Early Compounds the Problems
WSARA: Baselining Programs Early Compounds the ProblemsWSARA: Baselining Programs Early Compounds the Problems
WSARA: Baselining Programs Early Compounds the Problems
 
Zimmerman.marybeth
Zimmerman.marybethZimmerman.marybeth
Zimmerman.marybeth
 
BNamericas Project Risk Analytics - June 2015 Inaugural report
BNamericas Project Risk Analytics - June 2015 Inaugural reportBNamericas Project Risk Analytics - June 2015 Inaugural report
BNamericas Project Risk Analytics - June 2015 Inaugural report
 
Automated Surface Observation System Independent Government Cost Estimate
Automated Surface Observation System Independent Government Cost EstimateAutomated Surface Observation System Independent Government Cost Estimate
Automated Surface Observation System Independent Government Cost Estimate
 
Why Plan?
Why Plan?Why Plan?
Why Plan?
 
Does Better Scheduling Drive Execution Success?
Does Better Scheduling Drive Execution Success?Does Better Scheduling Drive Execution Success?
Does Better Scheduling Drive Execution Success?
 
Why Scheduling Mustn't Be Allowed to Become an Extinct Science
Why Scheduling Mustn't Be Allowed to Become an Extinct ScienceWhy Scheduling Mustn't Be Allowed to Become an Extinct Science
Why Scheduling Mustn't Be Allowed to Become an Extinct Science
 
Estimate costs in fragile and transitional contexts - July - 2014
Estimate costs in fragile and transitional contexts - July - 2014Estimate costs in fragile and transitional contexts - July - 2014
Estimate costs in fragile and transitional contexts - July - 2014
 
Chap 5 Estimating Project Times
Chap 5 Estimating Project TimesChap 5 Estimating Project Times
Chap 5 Estimating Project Times
 
PMBOK7-201-300.pdf
PMBOK7-201-300.pdfPMBOK7-201-300.pdf
PMBOK7-201-300.pdf
 
C:\documents and settings\ckampschulte\desktop\in sync risk range analysis
C:\documents and settings\ckampschulte\desktop\in sync risk range analysisC:\documents and settings\ckampschulte\desktop\in sync risk range analysis
C:\documents and settings\ckampschulte\desktop\in sync risk range analysis
 
Chaplowe - M&E Planning 2008 - shortcuts
Chaplowe - M&E Planning 2008 - shortcutsChaplowe - M&E Planning 2008 - shortcuts
Chaplowe - M&E Planning 2008 - shortcuts
 
Pmwg.110603
Pmwg.110603Pmwg.110603
Pmwg.110603
 
Project_Management_Institute_A_Guide_to_the_Project_Management_Body-201-300.pdf
Project_Management_Institute_A_Guide_to_the_Project_Management_Body-201-300.pdfProject_Management_Institute_A_Guide_to_the_Project_Management_Body-201-300.pdf
Project_Management_Institute_A_Guide_to_the_Project_Management_Body-201-300.pdf
 

More from Glen Alleman

A Gentle Introduction to the IMP/IMS
A Gentle Introduction to the IMP/IMSA Gentle Introduction to the IMP/IMS
A Gentle Introduction to the IMP/IMSGlen Alleman
 
Increasing the Probability of Project Success
Increasing the Probability of Project SuccessIncreasing the Probability of Project Success
Increasing the Probability of Project SuccessGlen Alleman
 
Process Flow and Narrative for Agile+PPM
Process Flow and Narrative for Agile+PPMProcess Flow and Narrative for Agile+PPM
Process Flow and Narrative for Agile+PPMGlen Alleman
 
Deliverables Based Planning, PMBOK® and 5 Immutable Principles of Project Suc...
Deliverables Based Planning, PMBOK® and 5 Immutable Principles of Project Suc...Deliverables Based Planning, PMBOK® and 5 Immutable Principles of Project Suc...
Deliverables Based Planning, PMBOK® and 5 Immutable Principles of Project Suc...Glen Alleman
 
From Principles to Strategies for Systems Engineering
From Principles to Strategies for Systems EngineeringFrom Principles to Strategies for Systems Engineering
From Principles to Strategies for Systems EngineeringGlen Alleman
 
NAVAIR Integrated Master Schedule Guide guide
NAVAIR Integrated Master Schedule Guide guideNAVAIR Integrated Master Schedule Guide guide
NAVAIR Integrated Master Schedule Guide guideGlen Alleman
 
Building a Credible Performance Measurement Baseline
Building a Credible Performance Measurement BaselineBuilding a Credible Performance Measurement Baseline
Building a Credible Performance Measurement BaselineGlen Alleman
 
Integrated master plan methodology (v2)
Integrated master plan methodology (v2)Integrated master plan methodology (v2)
Integrated master plan methodology (v2)Glen Alleman
 
IMP / IMS Step by Step
IMP / IMS Step by StepIMP / IMS Step by Step
IMP / IMS Step by StepGlen Alleman
 
DHS - Using functions points to estimate agile development programs (v2)
DHS - Using functions points to estimate agile development programs (v2)DHS - Using functions points to estimate agile development programs (v2)
DHS - Using functions points to estimate agile development programs (v2)Glen Alleman
 
Making the impossible possible
Making the impossible possibleMaking the impossible possible
Making the impossible possibleGlen Alleman
 
Heliotropic Abundance
Heliotropic AbundanceHeliotropic Abundance
Heliotropic AbundanceGlen Alleman
 
Capabilities based planning
Capabilities based planningCapabilities based planning
Capabilities based planningGlen Alleman
 
Process Flow and Narrative for Agile
Process Flow and Narrative for AgileProcess Flow and Narrative for Agile
Process Flow and Narrative for AgileGlen Alleman
 
Building the Performance Measurement Baseline
Building the Performance Measurement BaselineBuilding the Performance Measurement Baseline
Building the Performance Measurement BaselineGlen Alleman
 
Program Management Office Lean Software Development and Six Sigma
Program Management Office Lean Software Development and Six SigmaProgram Management Office Lean Software Development and Six Sigma
Program Management Office Lean Software Development and Six SigmaGlen Alleman
 
Policy and Procedure Rollout
Policy and Procedure RolloutPolicy and Procedure Rollout
Policy and Procedure RolloutGlen Alleman
 
Integrated Master Plan Development
Integrated Master Plan DevelopmentIntegrated Master Plan Development
Integrated Master Plan DevelopmentGlen Alleman
 
Project Management Theory
Project Management TheoryProject Management Theory
Project Management TheoryGlen Alleman
 
Increasing the Probability of Project Success with Five Principles and Practices
Increasing the Probability of Project Success with Five Principles and PracticesIncreasing the Probability of Project Success with Five Principles and Practices
Increasing the Probability of Project Success with Five Principles and PracticesGlen Alleman
 

More from Glen Alleman (20)

A Gentle Introduction to the IMP/IMS
A Gentle Introduction to the IMP/IMSA Gentle Introduction to the IMP/IMS
A Gentle Introduction to the IMP/IMS
 
Increasing the Probability of Project Success
Increasing the Probability of Project SuccessIncreasing the Probability of Project Success
Increasing the Probability of Project Success
 
Process Flow and Narrative for Agile+PPM
Process Flow and Narrative for Agile+PPMProcess Flow and Narrative for Agile+PPM
Process Flow and Narrative for Agile+PPM
 
Deliverables Based Planning, PMBOK® and 5 Immutable Principles of Project Suc...
Deliverables Based Planning, PMBOK® and 5 Immutable Principles of Project Suc...Deliverables Based Planning, PMBOK® and 5 Immutable Principles of Project Suc...
Deliverables Based Planning, PMBOK® and 5 Immutable Principles of Project Suc...
 
From Principles to Strategies for Systems Engineering
From Principles to Strategies for Systems EngineeringFrom Principles to Strategies for Systems Engineering
From Principles to Strategies for Systems Engineering
 
NAVAIR Integrated Master Schedule Guide guide
NAVAIR Integrated Master Schedule Guide guideNAVAIR Integrated Master Schedule Guide guide
NAVAIR Integrated Master Schedule Guide guide
 
Building a Credible Performance Measurement Baseline
Building a Credible Performance Measurement BaselineBuilding a Credible Performance Measurement Baseline
Building a Credible Performance Measurement Baseline
 
Integrated master plan methodology (v2)
Integrated master plan methodology (v2)Integrated master plan methodology (v2)
Integrated master plan methodology (v2)
 
IMP / IMS Step by Step
IMP / IMS Step by StepIMP / IMS Step by Step
IMP / IMS Step by Step
 
DHS - Using functions points to estimate agile development programs (v2)
DHS - Using functions points to estimate agile development programs (v2)DHS - Using functions points to estimate agile development programs (v2)
DHS - Using functions points to estimate agile development programs (v2)
 
Making the impossible possible
Making the impossible possibleMaking the impossible possible
Making the impossible possible
 
Heliotropic Abundance
Heliotropic AbundanceHeliotropic Abundance
Heliotropic Abundance
 
Capabilities based planning
Capabilities based planningCapabilities based planning
Capabilities based planning
 
Process Flow and Narrative for Agile
Process Flow and Narrative for AgileProcess Flow and Narrative for Agile
Process Flow and Narrative for Agile
 
Building the Performance Measurement Baseline
Building the Performance Measurement BaselineBuilding the Performance Measurement Baseline
Building the Performance Measurement Baseline
 
Program Management Office Lean Software Development and Six Sigma
Program Management Office Lean Software Development and Six SigmaProgram Management Office Lean Software Development and Six Sigma
Program Management Office Lean Software Development and Six Sigma
 
Policy and Procedure Rollout
Policy and Procedure RolloutPolicy and Procedure Rollout
Policy and Procedure Rollout
 
Integrated Master Plan Development
Integrated Master Plan DevelopmentIntegrated Master Plan Development
Integrated Master Plan Development
 
Project Management Theory
Project Management TheoryProject Management Theory
Project Management Theory
 
Increasing the Probability of Project Success with Five Principles and Practices
Increasing the Probability of Project Success with Five Principles and PracticesIncreasing the Probability of Project Success with Five Principles and Practices
Increasing the Probability of Project Success with Five Principles and Practices
 

Recently uploaded

Are Multi-Cloud and Serverless Good or Bad?
Are Multi-Cloud and Serverless Good or Bad?Are Multi-Cloud and Serverless Good or Bad?
Are Multi-Cloud and Serverless Good or Bad?Mattias Andersson
 
DSPy a system for AI to Write Prompts and Do Fine Tuning
DSPy a system for AI to Write Prompts and Do Fine TuningDSPy a system for AI to Write Prompts and Do Fine Tuning
DSPy a system for AI to Write Prompts and Do Fine TuningLars Bell
 
"LLMs for Python Engineers: Advanced Data Analysis and Semantic Kernel",Oleks...
"LLMs for Python Engineers: Advanced Data Analysis and Semantic Kernel",Oleks..."LLMs for Python Engineers: Advanced Data Analysis and Semantic Kernel",Oleks...
"LLMs for Python Engineers: Advanced Data Analysis and Semantic Kernel",Oleks...Fwdays
 
DevEX - reference for building teams, processes, and platforms
DevEX - reference for building teams, processes, and platformsDevEX - reference for building teams, processes, and platforms
DevEX - reference for building teams, processes, and platformsSergiu Bodiu
 
Hyperautomation and AI/ML: A Strategy for Digital Transformation Success.pdf
Hyperautomation and AI/ML: A Strategy for Digital Transformation Success.pdfHyperautomation and AI/ML: A Strategy for Digital Transformation Success.pdf
Hyperautomation and AI/ML: A Strategy for Digital Transformation Success.pdfPrecisely
 
Advanced Test Driven-Development @ php[tek] 2024
Advanced Test Driven-Development @ php[tek] 2024Advanced Test Driven-Development @ php[tek] 2024
Advanced Test Driven-Development @ php[tek] 2024Scott Keck-Warren
 
Anypoint Exchange: It’s Not Just a Repo!
Anypoint Exchange: It’s Not Just a Repo!Anypoint Exchange: It’s Not Just a Repo!
Anypoint Exchange: It’s Not Just a Repo!Manik S Magar
 
Tampa BSides - Chef's Tour of Microsoft Security Adoption Framework (SAF)
Tampa BSides - Chef's Tour of Microsoft Security Adoption Framework (SAF)Tampa BSides - Chef's Tour of Microsoft Security Adoption Framework (SAF)
Tampa BSides - Chef's Tour of Microsoft Security Adoption Framework (SAF)Mark Simos
 
SAP Build Work Zone - Overview L2-L3.pptx
SAP Build Work Zone - Overview L2-L3.pptxSAP Build Work Zone - Overview L2-L3.pptx
SAP Build Work Zone - Overview L2-L3.pptxNavinnSomaal
 
Scanning the Internet for External Cloud Exposures via SSL Certs
Scanning the Internet for External Cloud Exposures via SSL CertsScanning the Internet for External Cloud Exposures via SSL Certs
Scanning the Internet for External Cloud Exposures via SSL CertsRizwan Syed
 
Designing IA for AI - Information Architecture Conference 2024
Designing IA for AI - Information Architecture Conference 2024Designing IA for AI - Information Architecture Conference 2024
Designing IA for AI - Information Architecture Conference 2024Enterprise Knowledge
 
How AI, OpenAI, and ChatGPT impact business and software.
How AI, OpenAI, and ChatGPT impact business and software.How AI, OpenAI, and ChatGPT impact business and software.
How AI, OpenAI, and ChatGPT impact business and software.Curtis Poe
 
Merck Moving Beyond Passwords: FIDO Paris Seminar.pptx
Merck Moving Beyond Passwords: FIDO Paris Seminar.pptxMerck Moving Beyond Passwords: FIDO Paris Seminar.pptx
Merck Moving Beyond Passwords: FIDO Paris Seminar.pptxLoriGlavin3
 
Unleash Your Potential - Namagunga Girls Coding Club
Unleash Your Potential - Namagunga Girls Coding ClubUnleash Your Potential - Namagunga Girls Coding Club
Unleash Your Potential - Namagunga Girls Coding ClubKalema Edgar
 
Unraveling Multimodality with Large Language Models.pdf
Unraveling Multimodality with Large Language Models.pdfUnraveling Multimodality with Large Language Models.pdf
Unraveling Multimodality with Large Language Models.pdfAlex Barbosa Coqueiro
 
From Family Reminiscence to Scholarly Archive .
From Family Reminiscence to Scholarly Archive .From Family Reminiscence to Scholarly Archive .
From Family Reminiscence to Scholarly Archive .Alan Dix
 
Dev Dives: Streamline document processing with UiPath Studio Web
Dev Dives: Streamline document processing with UiPath Studio WebDev Dives: Streamline document processing with UiPath Studio Web
Dev Dives: Streamline document processing with UiPath Studio WebUiPathCommunity
 
Artificial intelligence in cctv survelliance.pptx
Artificial intelligence in cctv survelliance.pptxArtificial intelligence in cctv survelliance.pptx
Artificial intelligence in cctv survelliance.pptxhariprasad279825
 
Story boards and shot lists for my a level piece
Story boards and shot lists for my a level pieceStory boards and shot lists for my a level piece
Story boards and shot lists for my a level piececharlottematthew16
 

Recently uploaded (20)

Are Multi-Cloud and Serverless Good or Bad?
Are Multi-Cloud and Serverless Good or Bad?Are Multi-Cloud and Serverless Good or Bad?
Are Multi-Cloud and Serverless Good or Bad?
 
DSPy a system for AI to Write Prompts and Do Fine Tuning
DSPy a system for AI to Write Prompts and Do Fine TuningDSPy a system for AI to Write Prompts and Do Fine Tuning
DSPy a system for AI to Write Prompts and Do Fine Tuning
 
"LLMs for Python Engineers: Advanced Data Analysis and Semantic Kernel",Oleks...
"LLMs for Python Engineers: Advanced Data Analysis and Semantic Kernel",Oleks..."LLMs for Python Engineers: Advanced Data Analysis and Semantic Kernel",Oleks...
"LLMs for Python Engineers: Advanced Data Analysis and Semantic Kernel",Oleks...
 
DevEX - reference for building teams, processes, and platforms
DevEX - reference for building teams, processes, and platformsDevEX - reference for building teams, processes, and platforms
DevEX - reference for building teams, processes, and platforms
 
E-Vehicle_Hacking_by_Parul Sharma_null_owasp.pptx
E-Vehicle_Hacking_by_Parul Sharma_null_owasp.pptxE-Vehicle_Hacking_by_Parul Sharma_null_owasp.pptx
E-Vehicle_Hacking_by_Parul Sharma_null_owasp.pptx
 
Hyperautomation and AI/ML: A Strategy for Digital Transformation Success.pdf
Hyperautomation and AI/ML: A Strategy for Digital Transformation Success.pdfHyperautomation and AI/ML: A Strategy for Digital Transformation Success.pdf
Hyperautomation and AI/ML: A Strategy for Digital Transformation Success.pdf
 
Advanced Test Driven-Development @ php[tek] 2024
Advanced Test Driven-Development @ php[tek] 2024Advanced Test Driven-Development @ php[tek] 2024
Advanced Test Driven-Development @ php[tek] 2024
 
Anypoint Exchange: It’s Not Just a Repo!
Anypoint Exchange: It’s Not Just a Repo!Anypoint Exchange: It’s Not Just a Repo!
Anypoint Exchange: It’s Not Just a Repo!
 
Tampa BSides - Chef's Tour of Microsoft Security Adoption Framework (SAF)
Tampa BSides - Chef's Tour of Microsoft Security Adoption Framework (SAF)Tampa BSides - Chef's Tour of Microsoft Security Adoption Framework (SAF)
Tampa BSides - Chef's Tour of Microsoft Security Adoption Framework (SAF)
 
SAP Build Work Zone - Overview L2-L3.pptx
SAP Build Work Zone - Overview L2-L3.pptxSAP Build Work Zone - Overview L2-L3.pptx
SAP Build Work Zone - Overview L2-L3.pptx
 
Scanning the Internet for External Cloud Exposures via SSL Certs
Scanning the Internet for External Cloud Exposures via SSL CertsScanning the Internet for External Cloud Exposures via SSL Certs
Scanning the Internet for External Cloud Exposures via SSL Certs
 
Designing IA for AI - Information Architecture Conference 2024
Designing IA for AI - Information Architecture Conference 2024Designing IA for AI - Information Architecture Conference 2024
Designing IA for AI - Information Architecture Conference 2024
 
How AI, OpenAI, and ChatGPT impact business and software.
How AI, OpenAI, and ChatGPT impact business and software.How AI, OpenAI, and ChatGPT impact business and software.
How AI, OpenAI, and ChatGPT impact business and software.
 
Merck Moving Beyond Passwords: FIDO Paris Seminar.pptx
Merck Moving Beyond Passwords: FIDO Paris Seminar.pptxMerck Moving Beyond Passwords: FIDO Paris Seminar.pptx
Merck Moving Beyond Passwords: FIDO Paris Seminar.pptx
 
Unleash Your Potential - Namagunga Girls Coding Club
Unleash Your Potential - Namagunga Girls Coding ClubUnleash Your Potential - Namagunga Girls Coding Club
Unleash Your Potential - Namagunga Girls Coding Club
 
Unraveling Multimodality with Large Language Models.pdf
Unraveling Multimodality with Large Language Models.pdfUnraveling Multimodality with Large Language Models.pdf
Unraveling Multimodality with Large Language Models.pdf
 
From Family Reminiscence to Scholarly Archive .
From Family Reminiscence to Scholarly Archive .From Family Reminiscence to Scholarly Archive .
From Family Reminiscence to Scholarly Archive .
 
Dev Dives: Streamline document processing with UiPath Studio Web
Dev Dives: Streamline document processing with UiPath Studio WebDev Dives: Streamline document processing with UiPath Studio Web
Dev Dives: Streamline document processing with UiPath Studio Web
 
Artificial intelligence in cctv survelliance.pptx
Artificial intelligence in cctv survelliance.pptxArtificial intelligence in cctv survelliance.pptx
Artificial intelligence in cctv survelliance.pptx
 
Story boards and shot lists for my a level piece
Story boards and shot lists for my a level pieceStory boards and shot lists for my a level piece
Story boards and shot lists for my a level piece
 

Cure for Cost and Schedule Growth

  • 1. Page 1 of 13 A Cure For Unanticipated Cost and Schedule Growth Thomas J. Coonce Thomas J. Coonce, LLC tom.coonce@verizon.net +1 703 362 2568 Glen B. Alleman Niwot Ridge LLC glen.alleman@niwotridge.com +1 303 241 9633 ABSTRACT Delivering programs with less capability than promised, while exceeding the cost and planned durations, distorts decision making, contributes to increasing cost growth to other programs, undermines the Federal government’s credibility with taxpayers and contributes to the public’s negative support for these programs. Many reasons have been hypothesized and documented for cost and schedule growth. The authors review some of these reasons, and propose that government and contractors use the historical variability of the past programs to establish cost and schedule estimates at the outset and periodically update these estimates with up-to-date risks, to increase the probability of program success. For this to happen, the authors recommend changes to estimating, acquisition and contracting processes. INTRODUCTION Publically-funded programs have consistently delivered less than originally planned capabilities and cost more than planned and are late. Because public funds are limited, new programs cannot be started, or worse, they are started and then must be stretched out to fund the overruns of programs that are being developed. In short, the entire portfolio of programs is affected when most of the programs require more funds and take longer than planned. Funding authorizers become skeptical of new proposals because the estimates are not deemed credible. Decisions of choice are distorted since the estimates are in error, or worse, decision-makers know the numbers are biased low and make best guesses which result in poor choices. Furthermore, excessive growth in public programs damages the credibility of the estimating community and contributes to the public’s negative support for these programs. This paper discusses the never-ending problem of cost and schedule growth in publically funded programs and offers some recommendations to improve performance within the current Department of Defense (DOD) acquisition environment. This paper highlights the magnitude of cost and schedule growth within the DOD and the National Aeronautics and Space Administration (NASA) and summarizes some of the known and hypothesized reasons for growth. The paper also summarizes some of the initiatives that have been put in place to address estimating issues but suggests more can be done to improve them, effectively communicate them, and set these estimates high enough to reflect the historical experience so as to minimize or eliminate growth in future programs. The authors recommend specific changes to the way initial estimates are created and agreed to. In particular, this paper discusses the value of developing activity-based estimates adjusted to account for issues that have occurred on past similar programs. The authors propose that programs be budgeted at the 70 percent probability of meeting both cost and schedule targets – Joint Confidence Level. 1They show how this can be done, including active input from the contracting community, and how contract management can be improved through the use of risk registers and periodic probability statements about Estimates At Completion (EAC) and Estimated Completion Dates (ECD). They also enumerate the implementation challenges, and how they can be overcome. 1 The Joint Confidence Level connects Schedule, Cost, Risk, and Uncertainty in a single assessment of the probability of program success, http://www.nasa.gov/pdf/724371main_76646-Risk_Analysis_Brochure-Final6.pdf
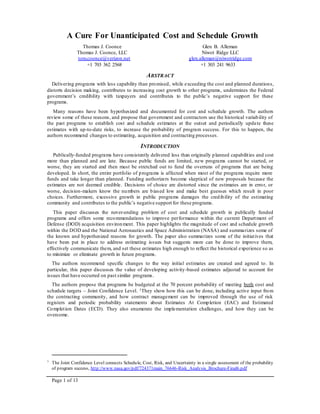
  • 2. Page 2 of 13 COST AND SCHEDULE GROWTH – A PERSISTENT PROBLEM THROUGH THE DECADES “In 1982, an unnamed witness at a House Armed Services Committee stated, ‘enough material has been written on the subject of cost growth during the last ten years to fill a Minuteman silo. Unfortunately, cost growth is still with us. In a decade since that testimony enough additional information on cost growth has been written to fill a second minuteman silo.” 2 Table 1 summarizes cost growth associated with NASA and DOD research programs. 3 Although this information is somewhat dated, the growth trend has not been materially reduced since the time this study was completed. Figure 1.0 below illustrates the cost and schedule growth of 30 NASA missions that were developed in the 2007 – 2009 time frame. 4 Table 1.0. Cost Growth Experience, 2004 NASA Study showing increasing growth over the decades in spite of all efforts to control this growth through improved insight and management processes. Figure 1.0 – Cost and Schedule Growth of 30 NASA Missions, 2007 - 2009 2 Cost Growth in DOD Major Programs: A Historical Perspective, Col. Harry Calcutt, April 1993, http://www.dtic.mil/dtic/tr/fulltext/u2/a276950.pdf 3 Unpublished 2004 NASA study performed by Drs Joseph Hamaker and Mathew Schaffer. 4 Unpublished 2009 NASA study 42% 29% 21% 0% 10% 20% 30% 40% 50% 60% From Phase B Start From PDR From CDR DevelopmentCostGrowth 29% 23% 19% 0% 10% 20% 30% 40% 50% 60% From Phase B Start From PDR From CDR PhaseB/C/DScheduleGrowth Average Median NASA in the 90s 36% 26% 78% NASA in the 70s 43% 26% 75% NASA in the 80s (GAO) 83% 60% 89% DoD RDT&E 45% 27% 76% Cost/Budget Growth Study Percent of Projects Which Experienced
  • 3. Page 3 of 13 Reasons for Cost and Schedule Growth As stated earlier, volumes have been written about programs failing to provide promised capabilities at the agreed cost and projected completion dates. Most of these studies attempted to categorize the root causes, so corrective actions could be taken. Some of the causes are related to estimating and acquisition initiation activities while others focused on issues associated with management and / or contract execution. One of the more comprehensive studies was performed by Colonel Harry Calcutt in 1993. 5 Following are Col. Calcutt’s reasons for growth organized into five categories.  Requirements: o Poor initial requirement definition o Poor performance/cost trade-off during development o Changes in quantity requirements  Estimating: o Errors due to limitation is estimating procedures o Failure to understand and account for technical risks o Poor inflation estimates o Top down pressure to reduce estimates o Lack of valid independent cost estimates  Program Management: o Lack of program management expertise o Mismanagement/human error o Over optimism o Schedule concurrency o Program stretch outs to keep production lines open  Contracting: o Lack of competition o Contractor buy-in o Use of wrong type of contract o Inconsistent contract management/admin procedures o Too much contractoroversight o Waste o Excess profits o Contractors overstaffed o Contractor indirect costs unreasonable o Taking too long to resolve undefinitized contracts  Budgeting: o Funding instabilities caused by trying to fund too many programs o Funding instabilities caused by congressionaldecisions o Inefficient production rates due to stretching out programs o Failure to fund for management reserves o Failure to fund programs at most likely cost 5 Ibid, Calcutt, p.17
  • 4. Page 4 of 13 A second study from DOD’s Office of Program Assessment and Root Cause Analysis (PARCA) published a recent report, which categorized growth into two broad categories:6  Inception: o Unrealistic performance expectations o Unrealistic baseline estimates for cost or schedule o Immature technologies or excessive manufacturing or integration risk  Execution related o Unanticipated design, engineering manufacturing or technology integration issues o Changes in procurement quantities o Inadequate program funding or funding instability o Poor performance by government or contractor personnel INITIATIVES TO REDUCE COST AND SCHEDULE GROWTH Over the last five decades, the DOD, NASA, and other civilian agencies have implemented numerous policy and regulation changes to reduce growth. This paper does not attempt to enumerate all the initiatives nor assess their effectiveness in combating growth. However, this paper does address those initiatives dealing with estimating and the processes used to establish and manage contractor baseline estimates. A few of the more important initiatives to improve the ability of the cost estimating community to produce better estimates were:  Need for independent estimating at all levels;  Standardized Work Breakdown Structures (WBS) for military systems e.g., MIL-STD 881, and similar structures for NASA and the National Reconnaissance Office;  Routine cost collection of analogous historical systems upon which to base future estimates;  Use of a Cost Analysis Requirements Description (CARD) (or similar documents) to be used as a basis for the estimates;  Use of technical and program management subject matter expertise to assist in developing estimates; and  Policy requirements to budget to higher confidence levels (80 percent cost confidence level within DOD and 70 percent joint cost and schedule confidence level for NASA projects). These initiatives are believed to have helped estimators create more credible estimates. Using the actual experience of similar past projects has been particularly useful as it helps estimators explain the basis for their estimates and provides leadership with a reference by which to judge the proposed new systems. However, these data are product-based (based on the systems’ WBS) and Program Management Offices (PMOs) often think in terms of the materiel developers (contractors’) activities so they find the product- based estimates difficult to consume, particularly when the independent estimates are higher than those the PMO receives from one or more contractors. PMOs frequently discount the independent estimates in favor of the contractor-developed estimates they find easier to understand. Figure 2 depicts the traditional method in which the cost estimating community develops its estimates. The chart shows that the cost estimate is a function of the value of the cost driving para meter as well as the variability of the costs that have been incurred for the product in the past. The figure illustrates that the higher the input parameter, the higher the cost, but that the estimated cost also depends on the point within the distribution of cost values that have been incurred on past similar programs. Cost estimators prefer to provide estimates at the mean or higher for a given WBS element. Estimates created in this way are considered to be standard acceptable practice and result in credible estimates. However, as noted earlier, the estimates are not always in the same language as the PMO or the contractors and thus are difficult to consume. 6 Report to Congress on Performance Assessment and Root Cause Analyses, Office of the Under Secretary of Defense for Acquisition, Technology and Logistics, March 2014, p. 7, http://www.acq.osd.mil/parca/docs/2014-parca-report- to-congress.pdf
  • 5. Page 5 of 13 Figure 2.0 – Traditional method of estimating by the WBS product or process defines the variances on the cost estimate compared to the drivers of the cost, in this example the “weight” of the product being produced. The weight becomes a “technical performance measure. Being outside the weight bounds will cost more for the product to be produced.
  • 6. Page 6 of 13 Figure 3 depicts an activity-based estimate built up using the schedule of activities and the resources associated with the activities. This is known as a cost or resource-loaded schedule that is based upon a set of expected activity durations and costs for the resources. This is the type of estimate that contractors submit in response to RFPs and used to set contract baselines for reporting progress to the PMOs. When independent WBS-based estimates are higher than those submitted by contractors, PMOs find it near impossible to analyze where the extra cost should be added to the contractors’ activity-based estimates. Thus, the WBS-based estimates are not as “consumable” as ones that are based on a set of generally agreed activities. Figure 3.0 – Sample Activity-Based Estimate derived from the Integrated Master Schedule (IMS). Costs are assigned for each work element in the IMS, usually within a Work Package, using the WBS number to identify this unique assignment. These costs are then “rolled” up to the Control Account and then the program at the top. These costs are reported in DI-MGMT-81861’s IPMR Format 1. A POSSIBLE SOLUTION TO SOLVE COST AND SCHEDULE GROWTH While activity-based estimates are easier to explain, they still need to be credible and to do so, they too must be informed with the variance of the activity durations and costs fromsimilar historical programs. The variance of the cost associated with an activity-based plan has two components – costs that vary with the passage of time and cost that are independent of time. A good example of a cost that is time independent is material. An example of a cost that is time dependent would be systems engineering or progra m management which must be in place as long as the program is under development. Similar to the variance in the cost of each WBS element, each activity has a variance in duration and the cost associated with those durations (both time dependent and time independent). In the end, the cost and cost variance of a given system that is aggregated by WBS must be the same of the cost and cost variance that is collected by activities. This concept is depicted in Figure 4.0 below. It should be noted that variance of cost and schedules reflect the variation that occur in the “normal” process of developing similar programs. This is referred to as the natural uncertainty that occurs and estimates of future programs must take this into account. Some researchers have labeled this uncertainty as “irreducible” because a manager cannot take specific actions to reduce the “risks”; rather, the manager must just recognize that this variation occurs as part of the normal process of development. 7 The amount of 7 Irreducibility Uncertainty – a Fact of Life for Reserve Estimates, John D. Wright, SPE Annual Technical Conference and Exhibition, 5-8 October, Denver, Colorado, Society of Petroleum Engineers, 2003.
  • 7. Page 7 of 13 uncertainty that “should” be included has been discussed within the community within the past ten years. The Weapon Systems Acquisition Reform Act of 2009 specified that all major programs within DOD should be budgeted at the 80 percent cost confidence level. That policy for the DOD was recently rescinded in favor of point estimates that reflect “… a confidence level such that it provides a high degree of confidence that the program can be completed without the need for significant adjustment to program budgets.”8 NASA requires all programs to be budgeted such that the programs possess a 70 percent probability of achieving both cost and schedule targets. Assuming cost and schedule are independent, identically statisticaldistributions, this implies an 84 percent confidence level for cost separately. Figure 4.0 – Cost Distributions Are The Same Regardless of Estimating Technique Some have advocated that estimates just need to be conservative. Others have argued that probabilistic estimating should not be done at all since the historical data are scant and therefore, assessed values reflect the estimator’s judgment and those could be biased and difficult to explain. Yet still others have advocated budgeting programs a high confidence levels (above 80 percent) and perhaps raise it higher if the growth is not contained. Still others have advocated that budgeting programs at high confidence levels is inefficient as certain programs will be over-budgeted and other worthy programs will not be started. Others have argued that high confidence levels will only result in higher costs over time as program managers will expand requirements to use up any funds that appeared to be in excess of those required. The authors assert that it is not possible to predict in advance which of these scenarios will occur unless setting the budget at some confidence level is tried. The authors observe that the community has never really tried budgeting programs at confidence levels that are based on well-understood historical data. (NASA has only recently done so and it is too early to conclude whether this has had a positive impact on cost and schedule growth). Anecdotal information suggests that some programs within the DOD have been budgeted at a stated 50% confidence level, yet experienced rather significant over runs in costs and Innovative Design Manufacturing Research Center (IdMRC) – Cost Modeling, 24th International Forum on COCOMO – November 2009. A Framework for Considering Uncertainty in Quantitative Life Cycle Cost Estimation, Proceedings of the ASME 2009 Design Engineering Technical Conferences & Computers and Information Engineering Conference, IDETC/CIE 2009, 8 FY2011 Annual Report on Cost Assessment Activities, Director, Cost Assessment and Program Evaluation (CAPE), February 2012, p.7-8.
  • 8. Page 8 of 13 completion dates in excess of plan. The authors take the position that programs should be budgeted at a higher confidence level (above 80 percent for cost and schedule separately) using agreed to historical data and then observe if this controls the unanticipated growth. IMPLEMENTATION DETAILS Setting the budgets at a high confidence level will necessitate modifications in estimating methods (noted above), the contracting process,and implementation. These are described below. The first step requires that government program offices (PMOs) take a more active role in clarifying requirements, and developing the top-level plan (cost-loaded schedule) with an associated statement about the probability of success (technical, cost and schedule). This top-level plan ought to form the basis for the first draft of the annual resources required. The second major step involves getting feedback from the contracting community concerning the probability of delivering program capabilities for the targeted cost and delivery date. The government will do this by issuing a Request for Information (RFI). PMOs will then analyze industry’s feedback, modify the requirements, budget or time (or all three) and then issue a Request for Proposal (RFP). And finally, along with their technical approach, contractors will submit their cost- loaded plans, risk registers, and probability statements in response to RFPs. The processes to complete the first major step – development of the RFI – are depicted in Figure 5.0 below and described in the following paragraphs. Figure 5.0 – Develop draft plan and obtain industry feedback. This feedback will confirm if the government generated cost-phased estimate is credible from the past experience of industry. This approach is used in Japan’s defense acquisition system. It engages the government and the providers in a dialogue in search of a phased plan that can increase the probability of success for the program
  • 9. Page 9 of 13 The first step in this process (1.0) is to develop an Integrated Master Plan (IMP). This is a top-level picture of the general sequence of activities needed in order to mature the capabilities desired. This should be developed per the Department of Defense’s (DOD’s) Integrated Master Plan and Integrated Master Schedule Preparation and Use Guide.9 The second Step is to develop a top-level Integrated Master Schedule. This schedule is notional but reflects the PMO’s thoughts on how the system capabilities ought to be developed. By its nature, the schedule is high level, but still includes a logical structure of activities. It ought to reflect the PMO’s thoughts about which activities can be performed in parallel and which must be serial. The activity durations are based on the amount of time of similar past programs. In Step 3, the PMO adds the resources (costs) associated with the high level schedule developed in step 2. Ideally, the cost associated with the activities will be available from databases. However, if they are unavailable, the PMO should estimate the costs. Some of the cost information could come from the developed independent estimates but transformed into the number of people, labor rates and material costs. Ideally, these discrete estimates ought to be equal to or higher than the mean of the historical data. The forth step is to create a risk register (RR) that will be used along with the top-level cost loaded schedule (developed in step 3) to develop cost and schedule confidence levels (step 5) for the PMO’s draft plan. The risk register should contain, at a minimum, information about the variation of the activity durations and associated costs from the historical database. As discussed earlier, this uncertainty represents the “natural variation” associated with developing similar programs, i.e., the irreducible risks. The risk register should also include the specific discrete risks that the PMO feels is unique to the program. This uncertainty (risk) should have an associated probability of occurrence and a cost and/or schedule consequence if it does occur. In the fifth step, the PMO should use appropriate Monte Carlo simulation software with the Risk Register developed in Step 4 and the top-level cost-loaded plan developed in step 3 to develop cost and schedule confidence levels for the targeted budget and development duration. In sixth step, the PMO adjusts cost and or program duration to achieve a “reasonable” confidence level. The authors believe that PMO should select a targeted cost with at least a 70 percent joint cost and schedule confidence level (above 80 percent for cost and schedule separately). Once the RFI has been issued, contractors are expected to review and comment on the PMO’s draft plan and answer the following questions: 1. Is the top-level plan logical given the technical challenges and capabilities required? If no, a. What other activities should be included or dropped? b. What changes in logic are required? 2. Are activities durations “consistent” (within family) of their experience? 3. Are the costs “consistent” (within family) of their experience? 4. Is the PMO’s perspective on risks realistic? If not, a. Which risks are overstated? b. Which risks are understated? c. Which risks were missed? What is the contractor’s assessment of probabilities and consequences forthose risks? (Included in their risk register). Contractors are expected to provide an updated high-level cost-loaded schedule, updated risk register, and associated probability statement of achieving the desired capabilities within the desired budget and duration. These submissions are not considered proposals; rather, they are considered inputs to the PMO on how the contractor might proceed, along with the associated confidence levels for the stated resources. Upon receipt of the contractors’ responses to the RFI, the PMO modifies the top-level plan and creates a Request for Proposal (RFP) that reflects the contractors’ concerns and notional plans. This process is depicted in Figure 6.0 below. 9 Integrated Master Plan and Integrated Master Schedule Preparation and Use Guide, October 21, 2005
  • 10. Page 10 of 13 Figure 6.0 – The process to improve the Request for Proposals (RFP) starts with an assessment of the responses from the Request for Information, where contractors provided their cost estimates. In step eight, the PMO assesses the contractors’ concerns and evaluates their top-level plans, risk registers, and confidence levels on the risk and their reduction through the handling plans. The PMO evaluates and synthesizes the concerns expressed about the capabilities, top-level plan; the risk registers and revises the PMO plan including the budget profile (step 9). Certain capabilities might be dropped or revised to reduce the development risk. The PMO will re-run their Monte-Carlo simulations to determine the confidence levels for the original budget and duration. PMOs increase the budget and/or development period in order to achieve at least a 70 joint cost and schedule confidence level (step 11). Once this is done, the PMO prepares and issues the RFP. Contractors develop their responses the RFPs in the normal fashion, but will include their final risk registers along with their implantation plans contained in a schedule model instrumented with Monte Carlos Simulation software. The response will include probability statements about the achieving the cost and schedule targets. This response and deliverables should be similar to the cost-loaded schedule submitted in response to the RFI. This process is depicted in Figure 7.0 below. 8.0 Assess Responses to RFI Updated Risk Register (RR) Updated Program Capabilities (Requirements) 10.0 Re-create Joint Probability Distribution Updated Cost-Loaded IMS 11.0 Decide on TargetedCost and Completion Date Multiple responses 12.0 Create Request for Proposal (RFP) 9.0 Update IMP/ IMS, Risk Register, and/or Modify Rqmts
  • 11. Page 11 of 13 Figure 7.0 – Contractor process to generate responses to RFPs using the earlier cost estimates developed and shared by all the participants in the acquisition process. The government now has a credible estimate of the cost, schedule, and technical performance and makes the selection on “Best Value.” The next step is the selection of the winning contractor. In addition to other selection criteria, the government will include “Implementation Plan Realism” as part of its selection criteria. Inclusion of the cost-loaded schedule and the contractors’ risk registers will permit the government evaluators to assess the credibility of the contractors’ plans and perspective on risks. Plans which reflect documented actual historical experience, control for the discrete risks, i.e., include resources in their plans to address or control them, and possess a joint cost and schedule confidence levels in excess of 60 percent, should be awarded higher scores.10 At the Integrated Baseline Review, the contractor will: a) Show how progress will be objectively measured in units of measure meaningful to the decision makers, through Technical Performance Measures derived from the Integrated Master Plan. It is essential that technical progress be the driver of the reported cost and schedule progress. Without progress measures that are meaningful to the PMO, the contractor will be unable to propose corrective actions to keep the contract effort “on-track”; and b) Develop a Performance Management Baseline (PMB) such that it has at least of 50 percent probability of meeting both cost and schedule targets and demonstrate the contractor possesses sufficient Management and Schedule Reserves (schedule margin) to maintain a minimum of a 60 percent joint probability of success. If the contractor proposes a PMB with less than 50 percent joint probability of meeting cost and schedule targets in its baseline, the contract should be amended (reduce capabilities, increase cost and/or schedule), or be cancelled. Contracts should not be started if the PMB has less than a 50/50 change of success. 10 The selection of the joint confidence level could vary, but 60 percent is chosen as an absolute minimum. In order to tame cost and schedule growth, contracted efforts ought to have better than 50/50 change of meeting targets. 13.0 Create Contractor Versionof IMP 14.0 Develop Summary Level IMS 15.0 Develop Detailed Cost or Resource- Loaded IMS Contractor Historical Activity Durations and Associated Costs 17.0 Create Joint Probability Distribution 16.0 Create Updated Risk Register (RR) Contractor Risk Register (RR) 18.0 Specify Joint Confidence Level of Targeted Cost and Completion Date 19.0 Complete Preparation of Proposal Response to RFP Updated Program Capabilities (Requirements)
  • 12. Page 12 of 13 After the contract is awarded, the PMO and the contractor must actively manage the risks and attempt to develop the desired capabilities while maintaining a high probability of meeting cost and schedule targets. The PMO must do its part by holding firm on requirement changes – a well-known cause of cost and schedule growth. The contractor must communicate progress based on the pre-approved TPMs, and evolving risks. The contractor should submit updated plans every six months to the PMO along with his risk register and communicate the probabilities associated with its “Best Case”, “Worst Case” and “Most Likely” Estimates at completion and the Estimated Completion Date. These terms mean little to the PMO or other stakeholders without associated probability statements and the drivers of cost and schedule from the risk register content. This information should allow the contractor and PMO to focus on the future risks and revise their plans to keep the contracts on track. THE CHALLENGES There are several challenges that must be addressed in order to implement these recommendations. These are briefly discussed below. First, the estimating community must broaden its data collection effort to capture the durations and associated costs of common high-level development activities. Some of these data may already exist within the native schedules contained with the Earned Value Management Central Repository (EVM -CR). Comparison of initial and final schedules could provide useful analogies for future systems. All programs, regardless of size, have some form of schedule and the community should make a concerted effort to collect, store and share these data. The authors assert that the contracting communities, particularly those involved in the construction industry, have done a better job of collecting these data and effectively using these data, than the government. Second, PMOs must take more active roles in creating realistic plans for their programs. As noted above, this means PMOs must create Integrated Master Plans – the architectural document to develop the required capabilities. They also need to assure themselves that issued RFPs possess an “achievable” outcome within the resources available. This means that PMOs must develop a top-level cost-loaded plan and compute probabilities for meeting the cost and schedule targets. Given limited internal resources, PMO will likely need to obtain outside assistance to perform this function. This is an additional expense to the PMO, but one that is easily justified. Third, asking the contracting community for their top-level picture of probabilities in advance of the RFP might come at a cost. Serious interested vendors will likely make the investment to develop a summary-level plan, Risk Register, and model to calculate probabilities, but perhaps not. PMOs might have to contract for systems engineering contracts to provide their perspectives, but cost should be minimal – less than four staff months worth of effort, each. This will be a s mall price to pay to obtain FRPs that have a higher probability of success. Forth, the IPMR Data Item Description (DID) will need to be updated to require: a) submission of the IMP in responses to RFPs, b) EAC and ECD probability statements in Format 5, and c) inclusion of risk registers and instrumented schedule models every six months. Requesting the IMP within the RFP should never be optional as it provides the architectural framework for delivering the desired capabilities. As noted earlier, it provides the foundation for the contractors’plans – the cost or resource loaded schedule. Including the probability statements in Format 5 appears to be fairly straightforward and be could be done with minimal expense, but will be of marginal value to the PMO without the accompanying schedule model and associated risk registers. A PMO should be able to see the impact to the cost and schedule outcomes if changes in schedule logic are made of if they have a different perspective on risks. PMOs (or other stakeholders) should be able to independently exercise the contractors’ models. However, this requirement could be negotiated in such a way that the contractor will merely be required to develop the model and be ready to address PMO “what-if” questions.
  • 13. Page 13 of 13 CONCLUSION This paper discusses the perennial problem of cost and schedule growth in publically funded programs and offers recommendations to improve performance within the DOD environment. This paper proposes that programs be budgeted (with active inputs from industry partners) at a 70 percent joint cost and schedule confidence level and that contracts be periodically reassessed to ensure high probabilities of success. The authors observe that few programs have been budgeted for high confidence levels and cost growth continues. They assert that setting a relatively high probability of success is necessary to attempt to control growth and restore credibility with authorizers and taxpayers. The authors also address a number of the challenges to implement their recommendations and offer suggestions to overcome them.