Download to read offline
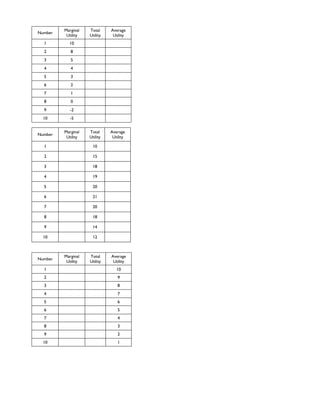

The document contains three tables showing the number, marginal utility, total utility, and average utility values for 10 items. The first table shows decreasing marginal utility, the second shows constant marginal utility, and the third shows decreasing marginal utility that approaches zero.


