SlideShare a Scribd company logo
1 of 5
Download to read offline
October 12, 2010


                                                                                                                                                   Recommendations                                <= 1 year                  1 - 2 yrs                    2 - 5 yrs
     NIIT Technologies Ltd                                                                                                 BUY                     Strong Buy
   NIIT Technologies which was the software development arm of NIIT Ltd. was spun off as an                                                        Buy
                                                                                                                                                   Hold
   independent company in 2004. Over the years, NIIT Technologies has built its expertise,
                                                                                                                                                   Reduce
   enhancing its presence in markets such as Application Development and Management and                                                            Sell
                                                                                                                                                   Strong Buy – Expected Returns > 20% p.a.
   Enterprise Solutions including Managed Services and BPO. NIIT Technologies provides an
                                                                                                                                                   Buy – Expected Returns from 10 to 20% p.a.
   entire gamut of services to its clients including application development and maintenance,                                                      Hold – Expected Returns from 0 % to 10% p.a.
                                                                                                                                                   Reduce – Expected Returns from 0 % to 10% p.a. with possible
   managed services, cloud computing, package implementation and Business Process                                                                  downside risk
                                                                                                                                                   Sell – Returns < 0 %
   outsourcing across multiple verticals including Banking & Financial Services, Insurance,
   Travel Transport & Logistics and Manufacturing & retail vertical.

            For the year ended FY2010, net revenues are down by 6.6% to Rs 9.1bn as compared
                                                                                                                                                   STOCK DATA
            to FY2009. However due to the cost rationalizing exercise done by the company                                                          BSE Code/NSE Code                                                                            532541/NIITTECH
                                                                                                                                                   Bloomberg Code                                                                                       NTEC:IN
            expenditure decreased by 8.6% Y-o-Y to Rs. 7.4bn. EBITDA for the period stood at Rs.
                                                                                                                                                   No. of Shares (Mn)                                                                                       58.8
            1.7bn up by 2.3% Y-o-Y. PAT for the period was up by 8.5% Y-o-Y at Rs. 1.26bn.                                                         Sensex/Nifty                                                                                      20250/6103
                                                                                                                                                   PRICE DATA
            We expect NIIT Technologies net revenues to grow at a CAGR of 19.9% over FY2010-                                                       CMP Rs (11th October '10)                                                                                    209.0
            12E to Rs 13.1bn in FY2012 from Rs 9.1bn in FY2010. We further estimate that the PAT                                                   Beta                                                                                                           0.9
                                                                                                                                                   Market Cap (Rs mn)                                                                                         12,287
            would grow at a CAGR of 10.8% to Rs 1.55bn in FY2012.                                                                                  52 Week High-Low                                                                                      219.3/122.75
                                                                                                                                                   2W Avg Volume                                                                                             134,000
     Based on a PE multiple of 10xFY12E, the fair value for NIIT Technologies
                                                                                                                                                   STOCK RETURN (%)
     works out to Rs 264.                                                                                                                                                        30D        3M                                              6M                           1Y
                                                                                                                                                   NIIT Technologies          12.5% 18.7%                                                 21.3%                       63.6%
                                                                                                                                                   Sensex                      5.9% 13.1%                                                 14.1%                       18.0%
                                                       Financial Snapshot
                                                                                                                                                   Nifty                       6.5% 13.6%                                                 15.3%                       19.9%
           Projections (Rs mn)                      FY08A      FY09A      FY10A                         FY11E             FY12E                    SHARE HOLDER PATTERN (%)
           Net Revenue                              9415.1     9799.4     9137.1                      11421.4           13134.6                    Promoter                                                                                                         39.6%
                                                                                                                                                   Institution                                                                                                      29.3%
           Y-o-Y Growth (%)                                        4.1      -6.8                         25.0              15.0                    Non Institution                                                                                                  31.2%
           EBITDA                                   1762.8     1663.2     1702.5                       1942.3            2328.4                    Total                                                                                                           100.0%
           Y-o-Y Growth (%)                                       -5.7       2.4                         14.1              19.9                    1 Year Price Performance (Rel. to Nifty)

           Profit After Tax                         1371.5     1165.0     1263.7                       1325.3            1552.0                        80%
                                                                                                                                                                                              NIIT Tech                         Sensex


           Y-o-Y Growth (%)                                     -15.1        8.5                          4.9              17.1                        70%
                                                                                                                                                       60%
           EPS Rs                                     23.4        19.8      21.7                         22.5              26.4                        50%

           BVPS Rs                                    73.0        61.8      98.6                        111.9             126.8                        40%
                                                                                                                                                       30%
           EBITDA Margin (%)                          18.7        17.0      18.6                         17.0              17.7                        20%

           PAT Margin (%)                             14.6        11.9      13.8                         11.6              11.8                        10%
                                                                                                                                                        0%
           ROE (%)                                    32.0        32.1      22.0                         20.1              20.8
                                                                                                                                                                                Dec-09
                                                                                                                                                              Oct-09


                                                                                                                                                                                                                                                         Aug-10


                                                                                                                                                                                                                                                                           Oct-10
                                                                                                                                                                                                                    Apr-10
                                                                                                                                                                                         Jan-10
                                                                                                                                                                       Nov-09


                                                                                                                                                                                                  Feb-10


                                                                                                                                                                                                                                                                  Sep-10
                                                                                                                                                                                                                             May-10
                                                                                                                                                                                                                                      Jun-10
                                                                                                                                                                                                                                                Jul-10
                                                                                                                                                                                                           Mar-10


                                                                                                                                                      -10%
                                                                                                                                                      -20%
           PERx                                        8.9        10.5       9.6                          9.3               7.9
           P/B Ratio                                   2.9         3.4       2.1                          1.9               1.6


Disclaimer: This document is prepared by Fullerton Securities & Wealth Advisors Ltd (FSWA). This document is not for public distribution and has been furnished to you solely for your information and you are notified that you
should not further copy, modify, use or distribute the information in any way unless you obtain written consent from FSWA. The information provided in the document is on the "best effort" basis and is subject to change
depending on several factors, including general market conditions. While reasonable care to compile the document but the accuracy and completeness cannot be guaranteed either by FSWA or any other person or entity
associated with it. The returns shown are merely estimates and forecasts and are not necessarily indicative of future performance and can change without notice. The document is prepared only for your information and is not
sufficient for making an investment decision. You should rely on your own investigations and seek professional advice for investment decision. Neither FSWA nor any person connected with it, accepts any liability either arising
from the use of this document or due to any inadvertent error in the information contained in this document. Financial investments carry risks including principal risk and therefore you should seek professional advice prior to
making any investment decision. The risk of any losses occurring by use of this report or document will be entirely yours. The investments covered in this report are not guaranteed. Also past performance of an investment or
fund is not an indication of future performance. FSWA, its affiliates, or associates, or any regulatory or other body or entity assumes no liability or responsibility for investment results or losses arising out of investment decisions
made by you. This document is not to be considered as an offer to sell or a solicitation to buy any security or financial product. FSWA reserves the right to modify or alter the terms and conditions of the use of this service or
discontinue, temporarily or permanently, the information and services provided (or any part thereof) at any time, with or without prior notice and FSWA shall not be liable to you for any suspension, modification, or termination
of the information and services provided herein. www.fullertonsecurities.co.in                                                                                                                                      Page | 1
October 12, 2010


      BUSINESS PROFILE

    NIIT Technologies which was the software development arm of NIIT Ltd. was spun off as an independent company in 2004,
    and has a presence across Banking & Financial Services, Insurance, Travel Transport & Logistics and Manufacturing & retail                                                                  Non Linear initiatives
    verticals. For financial year 2010 the BFSI vertical contributed to 43% of the total revenues followed by the transportation                                                                account for 27% of
                                                                                                                                                                                                revenues which would
    vertical which contributed to 31% of total revenues. Retail & manufacturing vertical contributed to 11% of revenues while                                                                   increase to 35% of
    other verticals accounted for the balance 15% of revenues.                                                                                                                                  revenues byFY12.

    On a Geographical basis EMEA accounted for 43% of revenues while America contributed to 33% of revenues. APAC region
    accounted for 13% of total revenues while India accounted for the balance 11% of revenues. The US, APAC and India markets
    would drive growth while the Europe region is expected to be sluggish. NIIT Technologies has been of late increasing its focus
    on non linear business on account of higher margins. Non linear initiatives account for 27% of revenues which is expected to
    increase to 30% and 35% of revenues in FY11 and FY12 respectively.

    Key Business Areas

    Application Development Management: NIIT Technologies offers a whole range of application development and
    management services including application development, application management, application renewal, application testing,
    data warehousing & business intelligence and application integration.

    Managed Services: NIIT Technologies offers its customers an entire gamut of managed services namely Infrastructure
    management services, production support and managed security services. The company provides a wide variety of services
    for managing IT infrastructure including remote support for systems and databases, network management, managed desktop
    services and data center services.                                                                                                                                                          NIIT technologies cloud
                                                                                                                                                                                                computing      offerings
    Package Implementations: NIIT Tech has over twenty years of experience in global enterprise application deployment and                                                                      include SaaS, PaaS and
                                                                                                                                                                                                IaaS
    management experience across multiple ERP platforms including SAP. The company offers the complete suite of SAP
    implementation services across modules for SAP R/3 and mySAP business suite solutions. The company also provides SAP
    functional support, SAP production support basis and technical consulting.

    BPO: NIIT SmartServe is the BPO arm of NIIT Technologies with broad business expertise in outsourcing. NIIT SmartServe is
    currently providing services across multiple verticals including Insurance, Financial Services, Market Research and Direct
    Marketing, Real Estate, transportation and Technology verticals.

    Cloud Computing: NIIT Technologies offerings in cloud computing offerings can be split across three categories viz. Software
    as a Service (SaaS), Platform as a Service (PaaS) and Infrastructure as a Service (IaaS).


Disclaimer: This document is prepared by Fullerton Securities & Wealth Advisors Ltd (FSWA). This document is not for public distribution and has been furnished to you solely for your information and you are notified that you
should not further copy, modify, use or distribute the information in any way unless you obtain written consent from FSWA. The information provided in the document is on the "best effort" basis and is subject to change
depending on several factors, including general market conditions. While reasonable care to compile the document but the accuracy and completeness cannot be guaranteed either by FSWA or any other person or entity
associated with it. The returns shown are merely estimates and forecasts and are not necessarily indicative of future performance and can change without notice. The document is prepared only for your information and is not
sufficient for making an investment decision. You should rely on your own investigations and seek professional advice for investment decision. Neither FSWA nor any person connected with it, accepts any liability either arising
from the use of this document or due to any inadvertent error in the information contained in this document. Financial investments carry risks including principal risk and therefore you should seek professional advice prior to
making any investment decision. The risk of any losses occurring by use of this report or document will be entirely yours. The investments covered in this report are not guaranteed. Also past performance of an investment or
fund is not an indication of future performance. FSWA, its affiliates, or associates, or any regulatory or other body or entity assumes no liability or responsibility for investment results or losses arising out of investment decisions
made by you. This document is not to be considered as an offer to sell or a solicitation to buy any security or financial product. FSWA reserves the right to modify or alter the terms and conditions of the use of this service or
discontinue, temporarily or permanently, the information and services provided (or any part thereof) at any time, with or without prior notice and FSWA shall not be liable to you for any suspension, modification, or termination
of the information and services provided herein. www.fullertonsecurities.co.in                                                                                                                                      Page | 2
October 12, 2010


    BUSINESS PERFORMANCE
   Strong Growth inQ1FY11…

    NIIT Technologies reported strong numbers for the quarter ended June 2011 with revenues up by 21.8% QoQ and 33.6% YoY
    on account of higher bought out items. Operating profits for the quarter stood at Rs. 541mn an increase of 37.3% YoY. Net                                                                   USD 149mn of total
                                                                                                                                                                                                firm        executable
    profits for the quarter stood at Rs. 408mn up by 131.6% YoY. During the quarter the company reported fresh order intake of                                                                  business over the next
    USD 40mn leading to USD 149mn of firm business executable over the next 12 months. During the quarter the company                                                                           12 months

    added 3 new significant customers in the travel & transport vertical.

                             14000    Annual Revenue & Margins                                        40%                                      3500                                                                   25%
                                                                                                                                                                    Quarterly Performance
                             12000                                                                    35%                                      3000
                                                                                                                                                                                                                      20%
                                                                                                      30%


                                                                                                                           Revenue s (Rs mn)
                             10000                                                                                                             2500
         Revenue s (Rs mn)


                                                                                                                                                                                                                             Margins (%)
                                                                                                      25%                                                                                                             15%
                                                                                                             Margins (%)


                             8000                                                                                                              2000
                                                                                                      20%
                                                                                                                                               1500                                                                   10%
                             6000
                                                                                                      15%
                                                                                                                                               1000
                             4000
                                                                                                      10%                                                                                                             5%
                                                                                                                                                500
                             2000                                                                    5%
                                                                                                                                                  0                                                                   0%
                                0                                                                    0%                                                   Q1FY10     Q2FY10    Q3FY10     Q4FY10       Q1FY11
                                     FY2008      FY2009   FY2010       FY2011E        FY2012E
                              Revenues (Rs mn)        PAT Margin (%)              EBITDA Margin (%)                                                   Revenues (Rs mn)        PAT Margin (%)         EBITDA Margin (%)


     Peer Group Comparison
                                                           Revenues    EBITDA     PAT
                                Companies                                                                                                       P/E                P/B          CMP            ROE %
                                                            (Rs mn)   Margins % Margins %
     NIIT Technologies                                        9,137.1      18.6      13.8                                                             9.6            2.1         209.0           21.8
     Mastek                                                   7,138.2      12.2       9.5                                                             9.9            1.2         249.2           12.4
     Zensar Technologies                                      9,527.6      18.7      13.4                                                             5.9            2.1         160.9           38.7
     FY10 Consolidated Figures Used

    Peer Comparison
                                                                                                                                                                                                Mid Cap IT companies
    We believe that large cap IT stocks have witnessed a sharp run up while the mid cap stocks have underperformed                                                                              are trading at a
    significantly. The valuation gap between the large cap and mid cap IT stocks are too large. We feel that this is likely to                                                                  significant discount
                                                                                                                                                                                                to the large Caps.
    change in the near future on the back of improving outlook for the industry. NIIT Technologies enjoys one of the highest
    operating margins in the mid cap segment and we believe that the stock is due for a re rating in the near future.


Disclaimer: This document is prepared by Fullerton Securities & Wealth Advisors Ltd (FSWA). This document is not for public distribution and has been furnished to you solely for your information and you are notified that you
should not further copy, modify, use or distribute the information in any way unless you obtain written consent from FSWA. The information provided in the document is on the "best effort" basis and is subject to change
depending on several factors, including general market conditions. While reasonable care to compile the document but the accuracy and completeness cannot be guaranteed either by FSWA or any other person or entity
associated with it. The returns shown are merely estimates and forecasts and are not necessarily indicative of future performance and can change without notice. The document is prepared only for your information and is not
sufficient for making an investment decision. You should rely on your own investigations and seek professional advice for investment decision. Neither FSWA nor any person connected with it, accepts any liability either arising
from the use of this document or due to any inadvertent error in the information contained in this document. Financial investments carry risks including principal risk and therefore you should seek professional advice prior to
making any investment decision. The risk of any losses occurring by use of this report or document will be entirely yours. The investments covered in this report are not guaranteed. Also past performance of an investment or
fund is not an indication of future performance. FSWA, its affiliates, or associates, or any regulatory or other body or entity assumes no liability or responsibility for investment results or losses arising out of investment decisions
made by you. This document is not to be considered as an offer to sell or a solicitation to buy any security or financial product. FSWA reserves the right to modify or alter the terms and conditions of the use of this service or
discontinue, temporarily or permanently, the information and services provided (or any part thereof) at any time, with or without prior notice and FSWA shall not be liable to you for any suspension, modification, or termination
of the information and services provided herein. www.fullertonsecurities.co.in                                                                                                                                      Page | 3
October 12, 2010


        VALUATION
      We expect NIIT Technologies net revenues to grow at a CAGR of 19.9% over FY2010-12E to Rs 13.1bn in FY2012
      from Rs 9.1bn in FY2010. We further estimate that the PAT would grow at a CAGR of 10.8% to Rs 1.55bn in                                                                          Based on a PE multiple of
                                                                                                                                                                                       10xFY12E, the fair value
      FY2012.                                                                                                                                                                          for NIIT Technologies
                                                                                                                                                                                       works out to Rs 264.
      We expect margins to contract marginally in FY2011 and then improve in FY12 on the back of increasing share of
      non linear initiatives.


      Based on a PE multiple of 10xFY12E, the fair value for NIIT Technologies works out to Rs 264.

      We recommend a ‘BUY’ rating on the stock.

                                                                          Financial Analysis and Projection
                        Particulars (Rs mn)                                   FY2008       FY2009      FY2010                                   FY2011E              FY2012E
                        Net Revenue                                            9415.1      9799.4      9137.1                                   11421.4              13134.6
                        Expenditure                                            7652.3      8136.2      7434.6                                    9479.1              10806.2
                        EBITDA                                                 1762.8      1663.2      1702.5                                    1942.3               2328.4
                        Interest                                                50.9         31.8        8.4                                       0.0                 0.0
                        PBDT                                                   1711.9      1631.4      1694.1                                    1942.3               2328.4
                        Depreciation                                           388.8        421.7       358.1                                     376.0               413.6
                        Other Income                                           186.1        179.4        84.8                                     50.0                 75.0
                        PBT                                                    1509.2      1389.1      1420.8                                    1616.3               1989.8
                        Less: Tax                                              137.7        224.1       144.2                                     290.9               437.8
                        Profit After Tax                                       1371.5      1165.0      1276.6                                    1325.3               1552.0
                        Minority Interest                                        0.0         0.0         12.9                                      0.0                 0.0
                        PAT after Minority Interest                            1371.5      1165.0      1263.7                                    1325.3               1552.0
                        PAT Margin (%)                                          14.6         11.9        13.8                                     11.6                 11.8
                        EBITDA Margin (%)                                       18.7         17.0        18.6                                     17.0                 17.7
                        ROE (%)                                                 32.0         32.1        22.0                                     20.1                 20.8
                        EPS Rs                                                  23.4         19.8        21.7                                     22.5                 26.4
                        BVPS (Rs.)                                              73.0         61.8        98.6                                     111.9               126.8
                                                                                                                                                FY2011E              FY2012E
                        Valuation Ratios (x)
                        PERx                                                                                                                                9.3                 7.9
                        P/B Ratio                                                                                                                           1.9                 1.6


Disclaimer: This document is prepared by Fullerton Securities & Wealth Advisors Ltd (FSWA). This document is not for public distribution and has been furnished to you solely for your information and you are notified that you
should not further copy, modify, use or distribute the information in any way unless you obtain written consent from FSWA. The information provided in the document is on the "best effort" basis and is subject to change
depending on several factors, including general market conditions. While reasonable care to compile the document but the accuracy and completeness cannot be guaranteed either by FSWA or any other person or entity
associated with it. The returns shown are merely estimates and forecasts and are not necessarily indicative of future performance and can change without notice. The document is prepared only for your information and is not
sufficient for making an investment decision. You should rely on your own investigations and seek professional advice for investment decision. Neither FSWA nor any person connected with it, accepts any liability either arising
from the use of this document or due to any inadvertent error in the information contained in this document. Financial investments carry risks including principal risk and therefore you should seek professional advice prior to
making any investment decision. The risk of any losses occurring by use of this report or document will be entirely yours. The investments covered in this report are not guaranteed. Also past performance of an investment or
fund is not an indication of future performance. FSWA, its affiliates, or associates, or any regulatory or other body or entity assumes no liability or responsibility for investment results or losses arising out of investment decisions
made by you. This document is not to be considered as an offer to sell or a solicitation to buy any security or financial product. FSWA reserves the right to modify or alter the terms and conditions of the use of this service or
discontinue, temporarily or permanently, the information and services provided (or any part thereof) at any time, with or without prior notice and FSWA shall not be liable to you for any suspension, modification, or termination
of the information and services provided herein. www.fullertonsecurities.co.in                                                                                                                                      Page | 4
October 12, 2010


        Board Of Directors
        Director Name                           Current Position                            Description
                                                                                            Rajendra S. Pawar is a well known face in the Indian IT sector. Recognising skilled manpower to be a very
                                                                                            important prerequisite for the survival of the fledgling Indian IT industry, Mr. Pawar helped pioneer the IT
                                                                                            training segment to fuel its growth. Mr. Pawar has won the Ernst & Young Master Entrepreneur of the Year
        Mr. Rajendra S. Pawar                   Chairman & Managing Director
                                                                                            Award in 1999. His contributions to the IT industry in India also earned him the “IT man of the Year” award,
                                                                                            instituted by IT industry journal, Dataquest. Mr. Pawar is a part of a panel of six experts in the newly constituted
                                                                                            Prime Minister’s National Council on Skill Development, chaired by the Prime Minister of India.
                                                                                            Mr. Arvind Thakur is the Chief Executive Officer of NIIT Technologies Ltd., and serves as the Joint Managing
                                                                                            Director on its board. Mr. Thakur graduated in engineering from the Indian Institute of Technology in India.
                                                                                            Thereafter he pursued post graduation in Industrial Engineering from NITIE in Mumbai. He started his career as
        Mr. Arvind Thakur                       Chief Executive Officer
                                                                                            an Industrial Engineer with BHEL, a large engineering corporation with work specialization in systems. He joined
                                                                                            NIIT Ltd. in 1985 as a member of the core team, and has since then been handling key organisational roles. He
                                                                                            was the President of its Software business before it was demerged to form NIIT Technologies Ltd.
                                                                                            Mr. Vijay K. Thadani is a co founder of the NIIT group and is currently the Chief Executive Officer of NIIT Ltd. Mr.
                                                                                            Thadani is currently the Chairman of CII National Committee on Education and also serves as the Chairman of
        Mr. Vijay Thadani                       Director
                                                                                            the National Accreditation Board for Education and Training (NABET). Mr. Thadani is a ‘Distinguished Alumnus’ of
                                                                                            the premier Indian Instituteaof Technology, Delhi. with over 30 years of experience. A specialist in the field of
                                                                                            Mr. Subroto Bharrachrya is Chartered Accountant
                                                                                            Finance and Management Consultancy, he has worked as a part of the core team in several reputed
        Mr. Subroto Bhattachrya                 Director (Independent)
                                                                                            organisations Singh is a retired IAS Officer, who has held very senior positions in the Central and State
                                                                                            Mr. Surendra
                                                                                            Governments. Having joined the Public Service in 1959, Mr. Singh has been Special Secretary to the Prime
                                                                                            Minister of India, responsible for all the economic work in the PMO, Cabinet Secretary to the Government of
                                                                                            India, Secretary to the Council of Ministers and Secretary, Ministry of Industry. He was an Executive Director on
        Mr. Surendra Singh                      Director (Independent)
                                                                                            the board of the World Bank, representing India, Bangladesh, Sri Lanka and Bhutan. He has also held
                                                                                            directorships on the Boards of the International Finance Corporation (IFC) and the Multilateral Investment
                                                                                            Guarantee Agency (MIGA).
                                                                                            Mr. Sharma earned his MBA in International Business from the Wharton School, University of Pennsylvania. Mr.
                                                                                            Sharma also holds a master’s degree in Computer Science from the Moore School, University of Pennsylvania,
        Mr. Amit Sharma                         Executive Vice President
                                                                                            and a Bachelor of Technology in Mechanical Engineering from the Indian Institute of Technology. Mr. Sharma has
                                                                                            previous ly worked with various companies including Motorola, GE Capital, and McKinsey, New York.


Disclaimer: This document is prepared by Fullerton Securities & Wealth Advisors Ltd (FSWA). This document is not for public distribution and has been furnished to you solely for your information and you are notified that you
should not further copy, modify, use or distribute the information in any way unless you obtain written consent from FSWA. The information provided in the document is on the "best effort" basis and is subject to change
depending on several factors, including general market conditions. While reasonable care to compile the document but the accuracy and completeness cannot be guaranteed either by FSWA or any other person or entity
associated with it. The returns shown are merely estimates and forecasts and are not necessarily indicative of future performance and can change without notice. The document is prepared only for your information and is not
sufficient for making an investment decision. You should rely on your own investigations and seek professional advice for investment decision. Neither FSWA nor any person connected with it, accepts any liability either arising
from the use of this document or due to any inadvertent error in the information contained in this document. Financial investments carry risks including principal risk and therefore you should seek professional advice prior to
making any investment decision. The risk of any losses occurring by use of this report or document will be entirely yours. The investments covered in this report are not guaranteed. Also past performance of an investment or
fund is not an indication of future performance. FSWA, its affiliates, or associates, or any regulatory or other body or entity assumes no liability or responsibility for investment results or losses arising out of investment decisions
made by you. This document is not to be considered as an offer to sell or a solicitation to buy any security or financial product. FSWA reserves the right to modify or alter the terms and conditions of the use of this service or
discontinue, temporarily or permanently, the information and services provided (or any part thereof) at any time, with or without prior notice and FSWA shall not be liable to you for any suspension, modification, or termination
of the information and services provided herein. www.fullertonsecurities.co.in                                                                                                                                      Page | 5

More Related Content

More from Fullerton Securities

Daily newsletter - October 24, 2011
Daily newsletter - October 24, 2011Daily newsletter - October 24, 2011
Daily newsletter - October 24, 2011Fullerton Securities
 
Daily newsletter - October 21, 2011
Daily newsletter - October 21, 2011Daily newsletter - October 21, 2011
Daily newsletter - October 21, 2011Fullerton Securities
 
Daily newsletter - October 20, 2011
Daily newsletter - October 20, 2011Daily newsletter - October 20, 2011
Daily newsletter - October 20, 2011Fullerton Securities
 
Daily newsletter - October 19, 2011
Daily newsletter - October 19, 2011Daily newsletter - October 19, 2011
Daily newsletter - October 19, 2011Fullerton Securities
 
Daily newsletter - October 18, 2011
Daily newsletter - October 18, 2011Daily newsletter - October 18, 2011
Daily newsletter - October 18, 2011Fullerton Securities
 
Daily Newsletter - October 17, 2011
Daily Newsletter - October 17, 2011Daily Newsletter - October 17, 2011
Daily Newsletter - October 17, 2011Fullerton Securities
 
Daily Newsletter - October 14, 2011
Daily Newsletter - October 14, 2011Daily Newsletter - October 14, 2011
Daily Newsletter - October 14, 2011Fullerton Securities
 
Daily Newsletter - October 13, 2011
Daily Newsletter - October 13, 2011Daily Newsletter - October 13, 2011
Daily Newsletter - October 13, 2011Fullerton Securities
 
Daily Newsletter - October 12, 2011
Daily Newsletter - October 12, 2011Daily Newsletter - October 12, 2011
Daily Newsletter - October 12, 2011Fullerton Securities
 
Daily Newsletter - October 11, 2011
Daily Newsletter - October 11, 2011Daily Newsletter - October 11, 2011
Daily Newsletter - October 11, 2011Fullerton Securities
 
Daily Newsletter - October 10, 2011
Daily Newsletter - October 10, 2011Daily Newsletter - October 10, 2011
Daily Newsletter - October 10, 2011Fullerton Securities
 
Daily Newsletter - October 7, 2011
Daily Newsletter - October 7, 2011Daily Newsletter - October 7, 2011
Daily Newsletter - October 7, 2011Fullerton Securities
 
Daily Newsletter - October 5, 2011
Daily Newsletter - October 5, 2011Daily Newsletter - October 5, 2011
Daily Newsletter - October 5, 2011Fullerton Securities
 
Daily Newsletter - October 4, 2011
Daily Newsletter - October 4, 2011Daily Newsletter - October 4, 2011
Daily Newsletter - October 4, 2011Fullerton Securities
 
Daily Newsletter - October 3, 2011
Daily Newsletter - October 3, 2011Daily Newsletter - October 3, 2011
Daily Newsletter - October 3, 2011Fullerton Securities
 

More from Fullerton Securities (20)

Daily newsletter - October 24, 2011
Daily newsletter - October 24, 2011Daily newsletter - October 24, 2011
Daily newsletter - October 24, 2011
 
Daily newsletter - October 21, 2011
Daily newsletter - October 21, 2011Daily newsletter - October 21, 2011
Daily newsletter - October 21, 2011
 
Daily newsletter - October 20, 2011
Daily newsletter - October 20, 2011Daily newsletter - October 20, 2011
Daily newsletter - October 20, 2011
 
Daily newsletter - October 19, 2011
Daily newsletter - October 19, 2011Daily newsletter - October 19, 2011
Daily newsletter - October 19, 2011
 
Daily newsletter - October 18, 2011
Daily newsletter - October 18, 2011Daily newsletter - October 18, 2011
Daily newsletter - October 18, 2011
 
Daily Newsletter - October 17, 2011
Daily Newsletter - October 17, 2011Daily Newsletter - October 17, 2011
Daily Newsletter - October 17, 2011
 
Daily Newsletter - October 14, 2011
Daily Newsletter - October 14, 2011Daily Newsletter - October 14, 2011
Daily Newsletter - October 14, 2011
 
Daily Newsletter - October 13, 2011
Daily Newsletter - October 13, 2011Daily Newsletter - October 13, 2011
Daily Newsletter - October 13, 2011
 
D&B Award Ceremony
D&B Award CeremonyD&B Award Ceremony
D&B Award Ceremony
 
Daily Newsletter - October 12, 2011
Daily Newsletter - October 12, 2011Daily Newsletter - October 12, 2011
Daily Newsletter - October 12, 2011
 
Daily Newsletter - October 11, 2011
Daily Newsletter - October 11, 2011Daily Newsletter - October 11, 2011
Daily Newsletter - October 11, 2011
 
Daily Newsletter - October 10, 2011
Daily Newsletter - October 10, 2011Daily Newsletter - October 10, 2011
Daily Newsletter - October 10, 2011
 
Daily Newsletter - October 7, 2011
Daily Newsletter - October 7, 2011Daily Newsletter - October 7, 2011
Daily Newsletter - October 7, 2011
 
Daily Newsletter - October 5, 2011
Daily Newsletter - October 5, 2011Daily Newsletter - October 5, 2011
Daily Newsletter - October 5, 2011
 
Daily Newsletter - October 4, 2011
Daily Newsletter - October 4, 2011Daily Newsletter - October 4, 2011
Daily Newsletter - October 4, 2011
 
Daily Newsletter - October 3, 2011
Daily Newsletter - October 3, 2011Daily Newsletter - October 3, 2011
Daily Newsletter - October 3, 2011
 
Daily Newsletter - Sep 30, 2011
Daily Newsletter - Sep 30, 2011Daily Newsletter - Sep 30, 2011
Daily Newsletter - Sep 30, 2011
 
Daily Newsletter - Sep 29, 2011
Daily Newsletter - Sep 29, 2011Daily Newsletter - Sep 29, 2011
Daily Newsletter - Sep 29, 2011
 
Daily Newsletter - Sep 28, 2011
Daily Newsletter - Sep 28, 2011Daily Newsletter - Sep 28, 2011
Daily Newsletter - Sep 28, 2011
 
Daily Newsletter - Sep 27, 2011
Daily Newsletter - Sep 27, 2011Daily Newsletter - Sep 27, 2011
Daily Newsletter - Sep 27, 2011
 

Recently uploaded

VIP Call Girls LB Nagar ( Hyderabad ) Phone 8250192130 | ₹5k To 25k With Room...
VIP Call Girls LB Nagar ( Hyderabad ) Phone 8250192130 | ₹5k To 25k With Room...VIP Call Girls LB Nagar ( Hyderabad ) Phone 8250192130 | ₹5k To 25k With Room...
VIP Call Girls LB Nagar ( Hyderabad ) Phone 8250192130 | ₹5k To 25k With Room...Suhani Kapoor
 
Solution Manual for Financial Accounting, 11th Edition by Robert Libby, Patri...
Solution Manual for Financial Accounting, 11th Edition by Robert Libby, Patri...Solution Manual for Financial Accounting, 11th Edition by Robert Libby, Patri...
Solution Manual for Financial Accounting, 11th Edition by Robert Libby, Patri...ssifa0344
 
20240417-Calibre-April-2024-Investor-Presentation.pdf
20240417-Calibre-April-2024-Investor-Presentation.pdf20240417-Calibre-April-2024-Investor-Presentation.pdf
20240417-Calibre-April-2024-Investor-Presentation.pdfAdnet Communications
 
Best VIP Call Girls Noida Sector 18 Call Me: 8448380779
Best VIP Call Girls Noida Sector 18 Call Me: 8448380779Best VIP Call Girls Noida Sector 18 Call Me: 8448380779
Best VIP Call Girls Noida Sector 18 Call Me: 8448380779Delhi Call girls
 
The Economic History of the U.S. Lecture 17.pdf
The Economic History of the U.S. Lecture 17.pdfThe Economic History of the U.S. Lecture 17.pdf
The Economic History of the U.S. Lecture 17.pdfGale Pooley
 
The Economic History of the U.S. Lecture 20.pdf
The Economic History of the U.S. Lecture 20.pdfThe Economic History of the U.S. Lecture 20.pdf
The Economic History of the U.S. Lecture 20.pdfGale Pooley
 
Malad Call Girl in Services 9892124323 | ₹,4500 With Room Free Delivery
Malad Call Girl in Services  9892124323 | ₹,4500 With Room Free DeliveryMalad Call Girl in Services  9892124323 | ₹,4500 With Room Free Delivery
Malad Call Girl in Services 9892124323 | ₹,4500 With Room Free DeliveryPooja Nehwal
 
(DIYA) Bhumkar Chowk Call Girls Just Call 7001035870 [ Cash on Delivery ] Pun...
(DIYA) Bhumkar Chowk Call Girls Just Call 7001035870 [ Cash on Delivery ] Pun...(DIYA) Bhumkar Chowk Call Girls Just Call 7001035870 [ Cash on Delivery ] Pun...
(DIYA) Bhumkar Chowk Call Girls Just Call 7001035870 [ Cash on Delivery ] Pun...ranjana rawat
 
VVIP Pune Call Girls Katraj (7001035870) Pune Escorts Nearby with Complete Sa...
VVIP Pune Call Girls Katraj (7001035870) Pune Escorts Nearby with Complete Sa...VVIP Pune Call Girls Katraj (7001035870) Pune Escorts Nearby with Complete Sa...
VVIP Pune Call Girls Katraj (7001035870) Pune Escorts Nearby with Complete Sa...Call Girls in Nagpur High Profile
 
Log your LOA pain with Pension Lab's brilliant campaign
Log your LOA pain with Pension Lab's brilliant campaignLog your LOA pain with Pension Lab's brilliant campaign
Log your LOA pain with Pension Lab's brilliant campaignHenry Tapper
 
Dharavi Russian callg Girls, { 09892124323 } || Call Girl In Mumbai ...
Dharavi Russian callg Girls, { 09892124323 } || Call Girl In Mumbai ...Dharavi Russian callg Girls, { 09892124323 } || Call Girl In Mumbai ...
Dharavi Russian callg Girls, { 09892124323 } || Call Girl In Mumbai ...Pooja Nehwal
 
Q3 2024 Earnings Conference Call and Webcast Slides
Q3 2024 Earnings Conference Call and Webcast SlidesQ3 2024 Earnings Conference Call and Webcast Slides
Q3 2024 Earnings Conference Call and Webcast SlidesMarketing847413
 
(ANIKA) Budhwar Peth Call Girls Just Call 7001035870 [ Cash on Delivery ] Pun...
(ANIKA) Budhwar Peth Call Girls Just Call 7001035870 [ Cash on Delivery ] Pun...(ANIKA) Budhwar Peth Call Girls Just Call 7001035870 [ Cash on Delivery ] Pun...
(ANIKA) Budhwar Peth Call Girls Just Call 7001035870 [ Cash on Delivery ] Pun...ranjana rawat
 
Instant Issue Debit Cards - High School Spirit
Instant Issue Debit Cards - High School SpiritInstant Issue Debit Cards - High School Spirit
Instant Issue Debit Cards - High School Spiritegoetzinger
 
The Economic History of the U.S. Lecture 19.pdf
The Economic History of the U.S. Lecture 19.pdfThe Economic History of the U.S. Lecture 19.pdf
The Economic History of the U.S. Lecture 19.pdfGale Pooley
 
VIP Kolkata Call Girl Jodhpur Park 👉 8250192130 Available With Room
VIP Kolkata Call Girl Jodhpur Park 👉 8250192130  Available With RoomVIP Kolkata Call Girl Jodhpur Park 👉 8250192130  Available With Room
VIP Kolkata Call Girl Jodhpur Park 👉 8250192130 Available With Roomdivyansh0kumar0
 
Pooja 9892124323 : Call Girl in Juhu Escorts Service Free Home Delivery
Pooja 9892124323 : Call Girl in Juhu Escorts Service Free Home DeliveryPooja 9892124323 : Call Girl in Juhu Escorts Service Free Home Delivery
Pooja 9892124323 : Call Girl in Juhu Escorts Service Free Home DeliveryPooja Nehwal
 
The Economic History of the U.S. Lecture 23.pdf
The Economic History of the U.S. Lecture 23.pdfThe Economic History of the U.S. Lecture 23.pdf
The Economic History of the U.S. Lecture 23.pdfGale Pooley
 
05_Annelore Lenoir_Docbyte_MeetupDora&Cybersecurity.pptx
05_Annelore Lenoir_Docbyte_MeetupDora&Cybersecurity.pptx05_Annelore Lenoir_Docbyte_MeetupDora&Cybersecurity.pptx
05_Annelore Lenoir_Docbyte_MeetupDora&Cybersecurity.pptxFinTech Belgium
 
VIP Call Girls Service Dilsukhnagar Hyderabad Call +91-8250192130
VIP Call Girls Service Dilsukhnagar Hyderabad Call +91-8250192130VIP Call Girls Service Dilsukhnagar Hyderabad Call +91-8250192130
VIP Call Girls Service Dilsukhnagar Hyderabad Call +91-8250192130Suhani Kapoor
 

Recently uploaded (20)

VIP Call Girls LB Nagar ( Hyderabad ) Phone 8250192130 | ₹5k To 25k With Room...
VIP Call Girls LB Nagar ( Hyderabad ) Phone 8250192130 | ₹5k To 25k With Room...VIP Call Girls LB Nagar ( Hyderabad ) Phone 8250192130 | ₹5k To 25k With Room...
VIP Call Girls LB Nagar ( Hyderabad ) Phone 8250192130 | ₹5k To 25k With Room...
 
Solution Manual for Financial Accounting, 11th Edition by Robert Libby, Patri...
Solution Manual for Financial Accounting, 11th Edition by Robert Libby, Patri...Solution Manual for Financial Accounting, 11th Edition by Robert Libby, Patri...
Solution Manual for Financial Accounting, 11th Edition by Robert Libby, Patri...
 
20240417-Calibre-April-2024-Investor-Presentation.pdf
20240417-Calibre-April-2024-Investor-Presentation.pdf20240417-Calibre-April-2024-Investor-Presentation.pdf
20240417-Calibre-April-2024-Investor-Presentation.pdf
 
Best VIP Call Girls Noida Sector 18 Call Me: 8448380779
Best VIP Call Girls Noida Sector 18 Call Me: 8448380779Best VIP Call Girls Noida Sector 18 Call Me: 8448380779
Best VIP Call Girls Noida Sector 18 Call Me: 8448380779
 
The Economic History of the U.S. Lecture 17.pdf
The Economic History of the U.S. Lecture 17.pdfThe Economic History of the U.S. Lecture 17.pdf
The Economic History of the U.S. Lecture 17.pdf
 
The Economic History of the U.S. Lecture 20.pdf
The Economic History of the U.S. Lecture 20.pdfThe Economic History of the U.S. Lecture 20.pdf
The Economic History of the U.S. Lecture 20.pdf
 
Malad Call Girl in Services 9892124323 | ₹,4500 With Room Free Delivery
Malad Call Girl in Services  9892124323 | ₹,4500 With Room Free DeliveryMalad Call Girl in Services  9892124323 | ₹,4500 With Room Free Delivery
Malad Call Girl in Services 9892124323 | ₹,4500 With Room Free Delivery
 
(DIYA) Bhumkar Chowk Call Girls Just Call 7001035870 [ Cash on Delivery ] Pun...
(DIYA) Bhumkar Chowk Call Girls Just Call 7001035870 [ Cash on Delivery ] Pun...(DIYA) Bhumkar Chowk Call Girls Just Call 7001035870 [ Cash on Delivery ] Pun...
(DIYA) Bhumkar Chowk Call Girls Just Call 7001035870 [ Cash on Delivery ] Pun...
 
VVIP Pune Call Girls Katraj (7001035870) Pune Escorts Nearby with Complete Sa...
VVIP Pune Call Girls Katraj (7001035870) Pune Escorts Nearby with Complete Sa...VVIP Pune Call Girls Katraj (7001035870) Pune Escorts Nearby with Complete Sa...
VVIP Pune Call Girls Katraj (7001035870) Pune Escorts Nearby with Complete Sa...
 
Log your LOA pain with Pension Lab's brilliant campaign
Log your LOA pain with Pension Lab's brilliant campaignLog your LOA pain with Pension Lab's brilliant campaign
Log your LOA pain with Pension Lab's brilliant campaign
 
Dharavi Russian callg Girls, { 09892124323 } || Call Girl In Mumbai ...
Dharavi Russian callg Girls, { 09892124323 } || Call Girl In Mumbai ...Dharavi Russian callg Girls, { 09892124323 } || Call Girl In Mumbai ...
Dharavi Russian callg Girls, { 09892124323 } || Call Girl In Mumbai ...
 
Q3 2024 Earnings Conference Call and Webcast Slides
Q3 2024 Earnings Conference Call and Webcast SlidesQ3 2024 Earnings Conference Call and Webcast Slides
Q3 2024 Earnings Conference Call and Webcast Slides
 
(ANIKA) Budhwar Peth Call Girls Just Call 7001035870 [ Cash on Delivery ] Pun...
(ANIKA) Budhwar Peth Call Girls Just Call 7001035870 [ Cash on Delivery ] Pun...(ANIKA) Budhwar Peth Call Girls Just Call 7001035870 [ Cash on Delivery ] Pun...
(ANIKA) Budhwar Peth Call Girls Just Call 7001035870 [ Cash on Delivery ] Pun...
 
Instant Issue Debit Cards - High School Spirit
Instant Issue Debit Cards - High School SpiritInstant Issue Debit Cards - High School Spirit
Instant Issue Debit Cards - High School Spirit
 
The Economic History of the U.S. Lecture 19.pdf
The Economic History of the U.S. Lecture 19.pdfThe Economic History of the U.S. Lecture 19.pdf
The Economic History of the U.S. Lecture 19.pdf
 
VIP Kolkata Call Girl Jodhpur Park 👉 8250192130 Available With Room
VIP Kolkata Call Girl Jodhpur Park 👉 8250192130  Available With RoomVIP Kolkata Call Girl Jodhpur Park 👉 8250192130  Available With Room
VIP Kolkata Call Girl Jodhpur Park 👉 8250192130 Available With Room
 
Pooja 9892124323 : Call Girl in Juhu Escorts Service Free Home Delivery
Pooja 9892124323 : Call Girl in Juhu Escorts Service Free Home DeliveryPooja 9892124323 : Call Girl in Juhu Escorts Service Free Home Delivery
Pooja 9892124323 : Call Girl in Juhu Escorts Service Free Home Delivery
 
The Economic History of the U.S. Lecture 23.pdf
The Economic History of the U.S. Lecture 23.pdfThe Economic History of the U.S. Lecture 23.pdf
The Economic History of the U.S. Lecture 23.pdf
 
05_Annelore Lenoir_Docbyte_MeetupDora&Cybersecurity.pptx
05_Annelore Lenoir_Docbyte_MeetupDora&Cybersecurity.pptx05_Annelore Lenoir_Docbyte_MeetupDora&Cybersecurity.pptx
05_Annelore Lenoir_Docbyte_MeetupDora&Cybersecurity.pptx
 
VIP Call Girls Service Dilsukhnagar Hyderabad Call +91-8250192130
VIP Call Girls Service Dilsukhnagar Hyderabad Call +91-8250192130VIP Call Girls Service Dilsukhnagar Hyderabad Call +91-8250192130
VIP Call Girls Service Dilsukhnagar Hyderabad Call +91-8250192130
 

Fullerton Securities' Investment Idea, NIIT Technologies - BUY

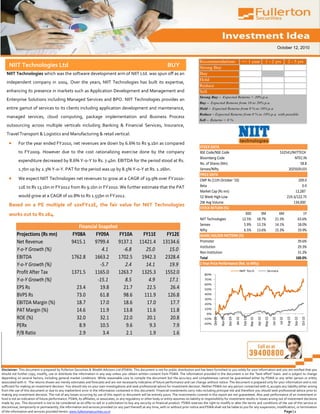
  • 1. October 12, 2010 Recommendations <= 1 year 1 - 2 yrs 2 - 5 yrs NIIT Technologies Ltd BUY Strong Buy NIIT Technologies which was the software development arm of NIIT Ltd. was spun off as an Buy Hold independent company in 2004. Over the years, NIIT Technologies has built its expertise, Reduce enhancing its presence in markets such as Application Development and Management and Sell Strong Buy – Expected Returns > 20% p.a. Enterprise Solutions including Managed Services and BPO. NIIT Technologies provides an Buy – Expected Returns from 10 to 20% p.a. entire gamut of services to its clients including application development and maintenance, Hold – Expected Returns from 0 % to 10% p.a. Reduce – Expected Returns from 0 % to 10% p.a. with possible managed services, cloud computing, package implementation and Business Process downside risk Sell – Returns < 0 % outsourcing across multiple verticals including Banking & Financial Services, Insurance, Travel Transport & Logistics and Manufacturing & retail vertical. For the year ended FY2010, net revenues are down by 6.6% to Rs 9.1bn as compared STOCK DATA to FY2009. However due to the cost rationalizing exercise done by the company BSE Code/NSE Code 532541/NIITTECH Bloomberg Code NTEC:IN expenditure decreased by 8.6% Y-o-Y to Rs. 7.4bn. EBITDA for the period stood at Rs. No. of Shares (Mn) 58.8 1.7bn up by 2.3% Y-o-Y. PAT for the period was up by 8.5% Y-o-Y at Rs. 1.26bn. Sensex/Nifty 20250/6103 PRICE DATA We expect NIIT Technologies net revenues to grow at a CAGR of 19.9% over FY2010- CMP Rs (11th October '10) 209.0 12E to Rs 13.1bn in FY2012 from Rs 9.1bn in FY2010. We further estimate that the PAT Beta 0.9 Market Cap (Rs mn) 12,287 would grow at a CAGR of 10.8% to Rs 1.55bn in FY2012. 52 Week High-Low 219.3/122.75 2W Avg Volume 134,000 Based on a PE multiple of 10xFY12E, the fair value for NIIT Technologies STOCK RETURN (%) works out to Rs 264. 30D 3M 6M 1Y NIIT Technologies 12.5% 18.7% 21.3% 63.6% Sensex 5.9% 13.1% 14.1% 18.0% Financial Snapshot Nifty 6.5% 13.6% 15.3% 19.9% Projections (Rs mn) FY08A FY09A FY10A FY11E FY12E SHARE HOLDER PATTERN (%) Net Revenue 9415.1 9799.4 9137.1 11421.4 13134.6 Promoter 39.6% Institution 29.3% Y-o-Y Growth (%) 4.1 -6.8 25.0 15.0 Non Institution 31.2% EBITDA 1762.8 1663.2 1702.5 1942.3 2328.4 Total 100.0% Y-o-Y Growth (%) -5.7 2.4 14.1 19.9 1 Year Price Performance (Rel. to Nifty) Profit After Tax 1371.5 1165.0 1263.7 1325.3 1552.0 80% NIIT Tech Sensex Y-o-Y Growth (%) -15.1 8.5 4.9 17.1 70% 60% EPS Rs 23.4 19.8 21.7 22.5 26.4 50% BVPS Rs 73.0 61.8 98.6 111.9 126.8 40% 30% EBITDA Margin (%) 18.7 17.0 18.6 17.0 17.7 20% PAT Margin (%) 14.6 11.9 13.8 11.6 11.8 10% 0% ROE (%) 32.0 32.1 22.0 20.1 20.8 Dec-09 Oct-09 Aug-10 Oct-10 Apr-10 Jan-10 Nov-09 Feb-10 Sep-10 May-10 Jun-10 Jul-10 Mar-10 -10% -20% PERx 8.9 10.5 9.6 9.3 7.9 P/B Ratio 2.9 3.4 2.1 1.9 1.6 Disclaimer: This document is prepared by Fullerton Securities & Wealth Advisors Ltd (FSWA). This document is not for public distribution and has been furnished to you solely for your information and you are notified that you should not further copy, modify, use or distribute the information in any way unless you obtain written consent from FSWA. The information provided in the document is on the "best effort" basis and is subject to change depending on several factors, including general market conditions. While reasonable care to compile the document but the accuracy and completeness cannot be guaranteed either by FSWA or any other person or entity associated with it. The returns shown are merely estimates and forecasts and are not necessarily indicative of future performance and can change without notice. The document is prepared only for your information and is not sufficient for making an investment decision. You should rely on your own investigations and seek professional advice for investment decision. Neither FSWA nor any person connected with it, accepts any liability either arising from the use of this document or due to any inadvertent error in the information contained in this document. Financial investments carry risks including principal risk and therefore you should seek professional advice prior to making any investment decision. The risk of any losses occurring by use of this report or document will be entirely yours. The investments covered in this report are not guaranteed. Also past performance of an investment or fund is not an indication of future performance. FSWA, its affiliates, or associates, or any regulatory or other body or entity assumes no liability or responsibility for investment results or losses arising out of investment decisions made by you. This document is not to be considered as an offer to sell or a solicitation to buy any security or financial product. FSWA reserves the right to modify or alter the terms and conditions of the use of this service or discontinue, temporarily or permanently, the information and services provided (or any part thereof) at any time, with or without prior notice and FSWA shall not be liable to you for any suspension, modification, or termination of the information and services provided herein. www.fullertonsecurities.co.in Page | 1
  • 2. October 12, 2010 BUSINESS PROFILE NIIT Technologies which was the software development arm of NIIT Ltd. was spun off as an independent company in 2004, and has a presence across Banking & Financial Services, Insurance, Travel Transport & Logistics and Manufacturing & retail Non Linear initiatives verticals. For financial year 2010 the BFSI vertical contributed to 43% of the total revenues followed by the transportation account for 27% of revenues which would vertical which contributed to 31% of total revenues. Retail & manufacturing vertical contributed to 11% of revenues while increase to 35% of other verticals accounted for the balance 15% of revenues. revenues byFY12. On a Geographical basis EMEA accounted for 43% of revenues while America contributed to 33% of revenues. APAC region accounted for 13% of total revenues while India accounted for the balance 11% of revenues. The US, APAC and India markets would drive growth while the Europe region is expected to be sluggish. NIIT Technologies has been of late increasing its focus on non linear business on account of higher margins. Non linear initiatives account for 27% of revenues which is expected to increase to 30% and 35% of revenues in FY11 and FY12 respectively. Key Business Areas Application Development Management: NIIT Technologies offers a whole range of application development and management services including application development, application management, application renewal, application testing, data warehousing & business intelligence and application integration. Managed Services: NIIT Technologies offers its customers an entire gamut of managed services namely Infrastructure management services, production support and managed security services. The company provides a wide variety of services for managing IT infrastructure including remote support for systems and databases, network management, managed desktop services and data center services. NIIT technologies cloud computing offerings Package Implementations: NIIT Tech has over twenty years of experience in global enterprise application deployment and include SaaS, PaaS and IaaS management experience across multiple ERP platforms including SAP. The company offers the complete suite of SAP implementation services across modules for SAP R/3 and mySAP business suite solutions. The company also provides SAP functional support, SAP production support basis and technical consulting. BPO: NIIT SmartServe is the BPO arm of NIIT Technologies with broad business expertise in outsourcing. NIIT SmartServe is currently providing services across multiple verticals including Insurance, Financial Services, Market Research and Direct Marketing, Real Estate, transportation and Technology verticals. Cloud Computing: NIIT Technologies offerings in cloud computing offerings can be split across three categories viz. Software as a Service (SaaS), Platform as a Service (PaaS) and Infrastructure as a Service (IaaS). Disclaimer: This document is prepared by Fullerton Securities & Wealth Advisors Ltd (FSWA). This document is not for public distribution and has been furnished to you solely for your information and you are notified that you should not further copy, modify, use or distribute the information in any way unless you obtain written consent from FSWA. The information provided in the document is on the "best effort" basis and is subject to change depending on several factors, including general market conditions. While reasonable care to compile the document but the accuracy and completeness cannot be guaranteed either by FSWA or any other person or entity associated with it. The returns shown are merely estimates and forecasts and are not necessarily indicative of future performance and can change without notice. The document is prepared only for your information and is not sufficient for making an investment decision. You should rely on your own investigations and seek professional advice for investment decision. Neither FSWA nor any person connected with it, accepts any liability either arising from the use of this document or due to any inadvertent error in the information contained in this document. Financial investments carry risks including principal risk and therefore you should seek professional advice prior to making any investment decision. The risk of any losses occurring by use of this report or document will be entirely yours. The investments covered in this report are not guaranteed. Also past performance of an investment or fund is not an indication of future performance. FSWA, its affiliates, or associates, or any regulatory or other body or entity assumes no liability or responsibility for investment results or losses arising out of investment decisions made by you. This document is not to be considered as an offer to sell or a solicitation to buy any security or financial product. FSWA reserves the right to modify or alter the terms and conditions of the use of this service or discontinue, temporarily or permanently, the information and services provided (or any part thereof) at any time, with or without prior notice and FSWA shall not be liable to you for any suspension, modification, or termination of the information and services provided herein. www.fullertonsecurities.co.in Page | 2
  • 3. October 12, 2010 BUSINESS PERFORMANCE Strong Growth inQ1FY11… NIIT Technologies reported strong numbers for the quarter ended June 2011 with revenues up by 21.8% QoQ and 33.6% YoY on account of higher bought out items. Operating profits for the quarter stood at Rs. 541mn an increase of 37.3% YoY. Net USD 149mn of total firm executable profits for the quarter stood at Rs. 408mn up by 131.6% YoY. During the quarter the company reported fresh order intake of business over the next USD 40mn leading to USD 149mn of firm business executable over the next 12 months. During the quarter the company 12 months added 3 new significant customers in the travel & transport vertical. 14000 Annual Revenue & Margins 40% 3500 25% Quarterly Performance 12000 35% 3000 20% 30% Revenue s (Rs mn) 10000 2500 Revenue s (Rs mn) Margins (%) 25% 15% Margins (%) 8000 2000 20% 1500 10% 6000 15% 1000 4000 10% 5% 500 2000 5% 0 0% 0 0% Q1FY10 Q2FY10 Q3FY10 Q4FY10 Q1FY11 FY2008 FY2009 FY2010 FY2011E FY2012E Revenues (Rs mn) PAT Margin (%) EBITDA Margin (%) Revenues (Rs mn) PAT Margin (%) EBITDA Margin (%) Peer Group Comparison Revenues EBITDA PAT Companies P/E P/B CMP ROE % (Rs mn) Margins % Margins % NIIT Technologies 9,137.1 18.6 13.8 9.6 2.1 209.0 21.8 Mastek 7,138.2 12.2 9.5 9.9 1.2 249.2 12.4 Zensar Technologies 9,527.6 18.7 13.4 5.9 2.1 160.9 38.7 FY10 Consolidated Figures Used Peer Comparison Mid Cap IT companies We believe that large cap IT stocks have witnessed a sharp run up while the mid cap stocks have underperformed are trading at a significantly. The valuation gap between the large cap and mid cap IT stocks are too large. We feel that this is likely to significant discount to the large Caps. change in the near future on the back of improving outlook for the industry. NIIT Technologies enjoys one of the highest operating margins in the mid cap segment and we believe that the stock is due for a re rating in the near future. Disclaimer: This document is prepared by Fullerton Securities & Wealth Advisors Ltd (FSWA). This document is not for public distribution and has been furnished to you solely for your information and you are notified that you should not further copy, modify, use or distribute the information in any way unless you obtain written consent from FSWA. The information provided in the document is on the "best effort" basis and is subject to change depending on several factors, including general market conditions. While reasonable care to compile the document but the accuracy and completeness cannot be guaranteed either by FSWA or any other person or entity associated with it. The returns shown are merely estimates and forecasts and are not necessarily indicative of future performance and can change without notice. The document is prepared only for your information and is not sufficient for making an investment decision. You should rely on your own investigations and seek professional advice for investment decision. Neither FSWA nor any person connected with it, accepts any liability either arising from the use of this document or due to any inadvertent error in the information contained in this document. Financial investments carry risks including principal risk and therefore you should seek professional advice prior to making any investment decision. The risk of any losses occurring by use of this report or document will be entirely yours. The investments covered in this report are not guaranteed. Also past performance of an investment or fund is not an indication of future performance. FSWA, its affiliates, or associates, or any regulatory or other body or entity assumes no liability or responsibility for investment results or losses arising out of investment decisions made by you. This document is not to be considered as an offer to sell or a solicitation to buy any security or financial product. FSWA reserves the right to modify or alter the terms and conditions of the use of this service or discontinue, temporarily or permanently, the information and services provided (or any part thereof) at any time, with or without prior notice and FSWA shall not be liable to you for any suspension, modification, or termination of the information and services provided herein. www.fullertonsecurities.co.in Page | 3
  • 4. October 12, 2010 VALUATION We expect NIIT Technologies net revenues to grow at a CAGR of 19.9% over FY2010-12E to Rs 13.1bn in FY2012 from Rs 9.1bn in FY2010. We further estimate that the PAT would grow at a CAGR of 10.8% to Rs 1.55bn in Based on a PE multiple of 10xFY12E, the fair value FY2012. for NIIT Technologies works out to Rs 264. We expect margins to contract marginally in FY2011 and then improve in FY12 on the back of increasing share of non linear initiatives. Based on a PE multiple of 10xFY12E, the fair value for NIIT Technologies works out to Rs 264. We recommend a ‘BUY’ rating on the stock. Financial Analysis and Projection Particulars (Rs mn) FY2008 FY2009 FY2010 FY2011E FY2012E Net Revenue 9415.1 9799.4 9137.1 11421.4 13134.6 Expenditure 7652.3 8136.2 7434.6 9479.1 10806.2 EBITDA 1762.8 1663.2 1702.5 1942.3 2328.4 Interest 50.9 31.8 8.4 0.0 0.0 PBDT 1711.9 1631.4 1694.1 1942.3 2328.4 Depreciation 388.8 421.7 358.1 376.0 413.6 Other Income 186.1 179.4 84.8 50.0 75.0 PBT 1509.2 1389.1 1420.8 1616.3 1989.8 Less: Tax 137.7 224.1 144.2 290.9 437.8 Profit After Tax 1371.5 1165.0 1276.6 1325.3 1552.0 Minority Interest 0.0 0.0 12.9 0.0 0.0 PAT after Minority Interest 1371.5 1165.0 1263.7 1325.3 1552.0 PAT Margin (%) 14.6 11.9 13.8 11.6 11.8 EBITDA Margin (%) 18.7 17.0 18.6 17.0 17.7 ROE (%) 32.0 32.1 22.0 20.1 20.8 EPS Rs 23.4 19.8 21.7 22.5 26.4 BVPS (Rs.) 73.0 61.8 98.6 111.9 126.8 FY2011E FY2012E Valuation Ratios (x) PERx 9.3 7.9 P/B Ratio 1.9 1.6 Disclaimer: This document is prepared by Fullerton Securities & Wealth Advisors Ltd (FSWA). This document is not for public distribution and has been furnished to you solely for your information and you are notified that you should not further copy, modify, use or distribute the information in any way unless you obtain written consent from FSWA. The information provided in the document is on the "best effort" basis and is subject to change depending on several factors, including general market conditions. While reasonable care to compile the document but the accuracy and completeness cannot be guaranteed either by FSWA or any other person or entity associated with it. The returns shown are merely estimates and forecasts and are not necessarily indicative of future performance and can change without notice. The document is prepared only for your information and is not sufficient for making an investment decision. You should rely on your own investigations and seek professional advice for investment decision. Neither FSWA nor any person connected with it, accepts any liability either arising from the use of this document or due to any inadvertent error in the information contained in this document. Financial investments carry risks including principal risk and therefore you should seek professional advice prior to making any investment decision. The risk of any losses occurring by use of this report or document will be entirely yours. The investments covered in this report are not guaranteed. Also past performance of an investment or fund is not an indication of future performance. FSWA, its affiliates, or associates, or any regulatory or other body or entity assumes no liability or responsibility for investment results or losses arising out of investment decisions made by you. This document is not to be considered as an offer to sell or a solicitation to buy any security or financial product. FSWA reserves the right to modify or alter the terms and conditions of the use of this service or discontinue, temporarily or permanently, the information and services provided (or any part thereof) at any time, with or without prior notice and FSWA shall not be liable to you for any suspension, modification, or termination of the information and services provided herein. www.fullertonsecurities.co.in Page | 4
  • 5. October 12, 2010 Board Of Directors Director Name Current Position Description Rajendra S. Pawar is a well known face in the Indian IT sector. Recognising skilled manpower to be a very important prerequisite for the survival of the fledgling Indian IT industry, Mr. Pawar helped pioneer the IT training segment to fuel its growth. Mr. Pawar has won the Ernst & Young Master Entrepreneur of the Year Mr. Rajendra S. Pawar Chairman & Managing Director Award in 1999. His contributions to the IT industry in India also earned him the “IT man of the Year” award, instituted by IT industry journal, Dataquest. Mr. Pawar is a part of a panel of six experts in the newly constituted Prime Minister’s National Council on Skill Development, chaired by the Prime Minister of India. Mr. Arvind Thakur is the Chief Executive Officer of NIIT Technologies Ltd., and serves as the Joint Managing Director on its board. Mr. Thakur graduated in engineering from the Indian Institute of Technology in India. Thereafter he pursued post graduation in Industrial Engineering from NITIE in Mumbai. He started his career as Mr. Arvind Thakur Chief Executive Officer an Industrial Engineer with BHEL, a large engineering corporation with work specialization in systems. He joined NIIT Ltd. in 1985 as a member of the core team, and has since then been handling key organisational roles. He was the President of its Software business before it was demerged to form NIIT Technologies Ltd. Mr. Vijay K. Thadani is a co founder of the NIIT group and is currently the Chief Executive Officer of NIIT Ltd. Mr. Thadani is currently the Chairman of CII National Committee on Education and also serves as the Chairman of Mr. Vijay Thadani Director the National Accreditation Board for Education and Training (NABET). Mr. Thadani is a ‘Distinguished Alumnus’ of the premier Indian Instituteaof Technology, Delhi. with over 30 years of experience. A specialist in the field of Mr. Subroto Bharrachrya is Chartered Accountant Finance and Management Consultancy, he has worked as a part of the core team in several reputed Mr. Subroto Bhattachrya Director (Independent) organisations Singh is a retired IAS Officer, who has held very senior positions in the Central and State Mr. Surendra Governments. Having joined the Public Service in 1959, Mr. Singh has been Special Secretary to the Prime Minister of India, responsible for all the economic work in the PMO, Cabinet Secretary to the Government of India, Secretary to the Council of Ministers and Secretary, Ministry of Industry. He was an Executive Director on Mr. Surendra Singh Director (Independent) the board of the World Bank, representing India, Bangladesh, Sri Lanka and Bhutan. He has also held directorships on the Boards of the International Finance Corporation (IFC) and the Multilateral Investment Guarantee Agency (MIGA). Mr. Sharma earned his MBA in International Business from the Wharton School, University of Pennsylvania. Mr. Sharma also holds a master’s degree in Computer Science from the Moore School, University of Pennsylvania, Mr. Amit Sharma Executive Vice President and a Bachelor of Technology in Mechanical Engineering from the Indian Institute of Technology. Mr. Sharma has previous ly worked with various companies including Motorola, GE Capital, and McKinsey, New York. Disclaimer: This document is prepared by Fullerton Securities & Wealth Advisors Ltd (FSWA). This document is not for public distribution and has been furnished to you solely for your information and you are notified that you should not further copy, modify, use or distribute the information in any way unless you obtain written consent from FSWA. The information provided in the document is on the "best effort" basis and is subject to change depending on several factors, including general market conditions. While reasonable care to compile the document but the accuracy and completeness cannot be guaranteed either by FSWA or any other person or entity associated with it. The returns shown are merely estimates and forecasts and are not necessarily indicative of future performance and can change without notice. The document is prepared only for your information and is not sufficient for making an investment decision. You should rely on your own investigations and seek professional advice for investment decision. Neither FSWA nor any person connected with it, accepts any liability either arising from the use of this document or due to any inadvertent error in the information contained in this document. Financial investments carry risks including principal risk and therefore you should seek professional advice prior to making any investment decision. The risk of any losses occurring by use of this report or document will be entirely yours. The investments covered in this report are not guaranteed. Also past performance of an investment or fund is not an indication of future performance. FSWA, its affiliates, or associates, or any regulatory or other body or entity assumes no liability or responsibility for investment results or losses arising out of investment decisions made by you. This document is not to be considered as an offer to sell or a solicitation to buy any security or financial product. FSWA reserves the right to modify or alter the terms and conditions of the use of this service or discontinue, temporarily or permanently, the information and services provided (or any part thereof) at any time, with or without prior notice and FSWA shall not be liable to you for any suspension, modification, or termination of the information and services provided herein. www.fullertonsecurities.co.in Page | 5