Using Reliability Modeling and Accelerated Life Testing to Estimate Solar Inverter Useful Life

Three-phase inverters are physically large, complex and expensive elements of major solar power generation systems. The inverter converts DC power created by the photovoltaic (PV) panels to AC power suitable for adding to the power grid. The inverters’ reliability testing is a complex task and relies on reliability block diagrams (RBD), vendor and field data, plus selecting accelerated life tests (ALT) based on critical elements of the product. This paper illustrates a case study that developed an RBD, used field and vendor data, and includes the design and use of two ALTs. The result is a working framework or model that provides a reasonable estimate of the expected lifetime performance of the inverter. While any project similar to this, is always a work in progress, the examination of the decisions and inputs for the model proves valuable for the continued improvement of the model and resulting life predictions. This project provides an excellent real life example of reliability estimation having multitude of constraints including sample size, test duration, and field data and thus having to rely on all sources of available data starting from field and vendor data to theoretical component reliability calculations, ALT plan execution, failure analysis, and finally summarizing the results using RBD to estimate product expected lifetime. At the time of writing this paper, based on completion of system level ALT, an availability of 99.97% is valid over a 10 year period according to Ontario weather as the main installation base. This will be revisited once subsystem ALT is completed.
![ReliaSoft BlockSim 7 - www.ReliaSoft.com
Reliability vs Time
1. 0 00
Reliability
GT500
Reliability Line
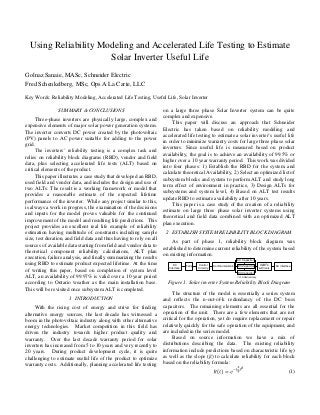
Also, to calculate availability, mean time-to-repair for
0. 8 00
each block was captured from field data. Then, by entering
both reliability and time-to-repair for each block in ReliaSoft’s
BlockSim tool and assuming inverter operation of 8 hours per
R e lia b ilit y , R ( t )
0. 6 00
day, a mean availability of 99.97% was calculated over a 10
year period. The mean availability is the proportion of 0. 4 00
time during a mission or time period that the system is
producing power.
(2) 0. 2 00
where A(t) is calculated based on reliability, R(t) and Golnaz Sanaie
schneider-electric
7/30/2012
mean time to repair, m(u): 0. 0 00
0. 0 00 12 00 0. 00 0 24 00 0. 00 0 36 00 0. 00 0 48 00 0. 00 0 60 00 0. 00 0
8:12:39 PM
T ime, (t)
(3)
Figure 2. System RBD reliability versus time
The following figure provides the reliability graph as a
function of time, R(t) based on using BlockSim RBD 3 SELECT AN OPTIMIZED LIST TO PERFORM ALT
simulations.
Note that in all calculations throughout this study, To evaluate long term outdoor performance of solar
conditions of 45°C, 480Vdc, and full power were used as the inventers, we would really need the outdoor field performance
baseline which provide conservative theoretical calculations. data; however, practically we cannot wait for 10 years to
determine warranty costs. Given the 85 fielded system as on
2.1 Vendor data reliability calculation example average less than a year of operation time, the field data does
As an example of the calculations based on vendor data, not represent the end of life characteristics of the design.
let us review the fan calculations, which are used in the RBD Therefore, ALT is used to predict what will happen in the field
at this point. There are three types of fans in the inverter; here in the long run and ALT plans should be performed such that
we only consider one of the three. field failure modes due to degradation are replicated. Ideally,
The most likely failure mechanism for a properly each subsystem as well as the entire system as the integration
constructed and installed fan is the failure of the bearing of subsystems would need a specific ALT, but due to high cost
grease which leads to eventual increase in bearing friction and of such test plans, optimization was made in selecting ALT
the loss of fan operation. The work of Xjin [1] on cooling fan plans. In the following, we will first discuss a review of field
reliability modeling we can translate the provided vendor data data followed by parts stress analysis to design ALT plans.
to a Weibull life distribution.
Equation 4 has an AF formula suitable for cooling fans. 3.1 Field Data Analysis
(4) To determine failure modes due to degradation, field data
Where, Ttest is from the data sheet and Tuse is the expected was analyzed based on time to failure (TTF) of a fleet of 85
use condition temperature. The fan data sheet also provides an systems with close to one year age. The analysis on the data
ReliaSoft Weibull++ 7 - www.ReliaSoft.com
Probability Density Function
L10 value of 57,323 hours, which represented the expected set using ReliaSoft Weibull tool included using both non-
0.300
Pdf
L1 Repair
duration until 10% of units are expected to fail at 40°C. Using repairable systems and repairable systems as described below. Lognormal-2P
RRX SRM MED FM
F=24/S=0
Pdf Line
equation 4, we determine the AF to convert the L10 duration Non repairable systems- In this analysis, we used
0.240
to the value corresponding to 45°C, which is 45,310 hours. Weibull distribution models with the assumption that multiple
With the L10 at the appropriate temperature we then failures cannot happen on the same unit, hence, consecutive
0.180
conduct some algebra to determine the eta, η, value for the failures are assumed to belong to a brand new unit. Also, each
f(t)
Weibull distribution. Equation 5 shows the Reliability unit is considered separately as a censored data point. Based
on Weibull analysis of “Time to Failures”, a β value of less
0.120
function of the Weibull distribution solved for eta. Inputting
the known R(t) of 0.10 and including the L10 duration of at than 1 indicated that all these failures are indications of early
45°C for time, t, we can calculate the characteristic life of the life failure i.e. no sign of degradation. Additionally, “Time to
0.060
Weibull distribution for the fan operated at 45°C. Repair” data was analyzed using Lognormal models and fit Golnaz Sanaie
schneider-electric
(5) well. The plot of the time to repair data is in
0.000
0.000 4.000 8.000 12.000 16.000 20.000
7/30/2012
5:15:29 PM
Time, (t)
The one missing element is the beta, β, which Xijin Figure 3.
recommends the use of a value of 3.0. Therefore, with beta of
3.0 we can calculate the eta value using the adjusted vendor
L10 data at the expected use temperature as 95,933 hours.
The fan Weibull values for the expected use temperature
of 45°C are then input for the fan within the RBD using
Reliasoft’s BlockSim software package.](data:image/gif;base64,R0lGODlhAQABAIAAAAAAAP///yH5BAEAAAAALAAAAAABAAEAAAIBRAA7)
Recommended
Recommended
More Related Content
More from Accendo Reliability
More from Accendo Reliability (20)
Recently uploaded
Recently uploaded (20)
Using Reliability Modeling and Accelerated Life Testing to Estimate Solar Inverter Useful Life
- 1. Using Reliability Modeling and Accelerated Life Testing to Estimate Solar Inverter Useful Life Golnaz Sanaie, MASc, Schneider Electric Fred Schenkelberg, MSc, Ops A La Carte, LLC Key Words: Reliability Modeling, Accelerated Life Testing, Useful Life, Solar Inverter SUMMARY & CONCLUSIONS on a large three phase Solar Inverter system can be quite complex and expensive. Three-phase inverters are physically large, complex and This paper will discuss an approach that Schneider expensive elements of major solar power generation systems. Electric has taken based on reliability modeling and The inverter converts DC power created by the photovoltaic accelerated life testing to estimate a solar inverter’s useful life (PV) panels to AC power suitable for adding to the power in order to minimize warranty costs for large three phase solar grid. inverters. Since useful life is measured based on product The inverters’ reliability testing is a complex task and availability, the goal is to achieve an availability of 99.5% or relies on reliability block diagrams (RBD), vendor and field higher over a 10 year warranty period. This work was divided data, plus selecting accelerated life tests (ALT) based on into four phases: 1) Establish the RBD for the system and critical elements of the product. calculate theoretical Availability, 2) Select an optimized list of This paper illustrates a case study that developed an RBD, subsystem blocks and system to perform ALT and study long used field and vendor data, and includes the design and use of term effect of environment in practice, 3) Design ALTs for two ALTs. The result is a working framework or model that subsystems and system level, 4) Based on ALT test results provides a reasonable estimate of the expected lifetime update RBD to estimate availability after 10 years. performance of the inverter. While any project similar to this, This paper is a case study of the creation of a reliability is always a work in progress, the examination of the decisions estimate on large three phase solar inverter systems using and inputs for the model proves valuable for the continued theoretical and field data combined with an optimized ALT improvement of the model and resulting life predictions. This plan execution. project provides an excellent real life example of reliability estimation having multitude of constraints including sample 2 ESTABLISH SYSTEM RELIABILITY BLOCK DIAGRAM size, test duration, and field data and thus having to rely on all As part of phase 1, reliability block diagram was sources of available data starting from field and vendor data to established to determine current reliability of the system based theoretical component reliability calculations, ALT plan on existing information. execution, failure analysis, and finally summarizing the results DC Capacitor using RBD to estimate product expected lifetime. At the time DC Fans Control Communications DC Capacitor IGBT’s AC interface Interface Circuitry & Drivers of writing this paper, based on completion of system level DC Capacitor ALT, an availability of 99.97% is valid over a 10 year period 7 of 9 Redundancy according to Ontario weather as the main installation base. Figure 1. Solar inverter System Reliability Block Diagram This will be revisited once subsystem ALT is completed. The structure of the model is essentially a series system 1 INTRODUCTION and reflects the n-out-of-k redundancy of the DC buss With the rising cost of energy and strive for finding capacitors. The remaining elements are all essential for the alternative energy sources, the last decade has witnessed a operation of the unit. There are a few elements that are not boom in the photovoltaic industry along with other alternative critical for the operation, yet do require replacement or repair energy technologies. Market competition in this field has relatively quickly for the safe operation of the equipment, and driven the industry towards higher product quality and are included in the series model. warranty. Over the last decade warranty period for solar Based on source information we have a mix of inverters has increased from 5 to 10 years and very recently to distributions describing the data. The existing reliability 20 years. During product development cycle, it is quite information include predictions based on characteristic life (η) challenging to estimate useful life of the product to optimize as well as the slope (β) to calculate reliability for each block warranty costs. Additionally, planning accelerated life testing based on the reliability formula: (1)
- 2. ReliaSoft BlockSim 7 - www.ReliaSoft.com Reliability vs Time 1. 0 00 Reliability GT500 Reliability Line Also, to calculate availability, mean time-to-repair for 0. 8 00 each block was captured from field data. Then, by entering both reliability and time-to-repair for each block in ReliaSoft’s BlockSim tool and assuming inverter operation of 8 hours per R e lia b ilit y , R ( t ) 0. 6 00 day, a mean availability of 99.97% was calculated over a 10 year period. The mean availability is the proportion of 0. 4 00 time during a mission or time period that the system is producing power. (2) 0. 2 00 where A(t) is calculated based on reliability, R(t) and Golnaz Sanaie schneider-electric 7/30/2012 mean time to repair, m(u): 0. 0 00 0. 0 00 12 00 0. 00 0 24 00 0. 00 0 36 00 0. 00 0 48 00 0. 00 0 60 00 0. 00 0 8:12:39 PM T ime, (t) (3) Figure 2. System RBD reliability versus time The following figure provides the reliability graph as a function of time, R(t) based on using BlockSim RBD 3 SELECT AN OPTIMIZED LIST TO PERFORM ALT simulations. Note that in all calculations throughout this study, To evaluate long term outdoor performance of solar conditions of 45°C, 480Vdc, and full power were used as the inventers, we would really need the outdoor field performance baseline which provide conservative theoretical calculations. data; however, practically we cannot wait for 10 years to determine warranty costs. Given the 85 fielded system as on 2.1 Vendor data reliability calculation example average less than a year of operation time, the field data does As an example of the calculations based on vendor data, not represent the end of life characteristics of the design. let us review the fan calculations, which are used in the RBD Therefore, ALT is used to predict what will happen in the field at this point. There are three types of fans in the inverter; here in the long run and ALT plans should be performed such that we only consider one of the three. field failure modes due to degradation are replicated. Ideally, The most likely failure mechanism for a properly each subsystem as well as the entire system as the integration constructed and installed fan is the failure of the bearing of subsystems would need a specific ALT, but due to high cost grease which leads to eventual increase in bearing friction and of such test plans, optimization was made in selecting ALT the loss of fan operation. The work of Xjin [1] on cooling fan plans. In the following, we will first discuss a review of field reliability modeling we can translate the provided vendor data data followed by parts stress analysis to design ALT plans. to a Weibull life distribution. Equation 4 has an AF formula suitable for cooling fans. 3.1 Field Data Analysis (4) To determine failure modes due to degradation, field data Where, Ttest is from the data sheet and Tuse is the expected was analyzed based on time to failure (TTF) of a fleet of 85 use condition temperature. The fan data sheet also provides an systems with close to one year age. The analysis on the data ReliaSoft Weibull++ 7 - www.ReliaSoft.com Probability Density Function L10 value of 57,323 hours, which represented the expected set using ReliaSoft Weibull tool included using both non- 0.300 Pdf L1 Repair duration until 10% of units are expected to fail at 40°C. Using repairable systems and repairable systems as described below. Lognormal-2P RRX SRM MED FM F=24/S=0 Pdf Line equation 4, we determine the AF to convert the L10 duration Non repairable systems- In this analysis, we used 0.240 to the value corresponding to 45°C, which is 45,310 hours. Weibull distribution models with the assumption that multiple With the L10 at the appropriate temperature we then failures cannot happen on the same unit, hence, consecutive 0.180 conduct some algebra to determine the eta, η, value for the failures are assumed to belong to a brand new unit. Also, each f(t) Weibull distribution. Equation 5 shows the Reliability unit is considered separately as a censored data point. Based on Weibull analysis of “Time to Failures”, a β value of less 0.120 function of the Weibull distribution solved for eta. Inputting the known R(t) of 0.10 and including the L10 duration of at than 1 indicated that all these failures are indications of early 45°C for time, t, we can calculate the characteristic life of the life failure i.e. no sign of degradation. Additionally, “Time to 0.060 Weibull distribution for the fan operated at 45°C. Repair” data was analyzed using Lognormal models and fit Golnaz Sanaie schneider-electric (5) well. The plot of the time to repair data is in 0.000 0.000 4.000 8.000 12.000 16.000 20.000 7/30/2012 5:15:29 PM Time, (t) The one missing element is the beta, β, which Xijin Figure 3. recommends the use of a value of 3.0. Therefore, with beta of 3.0 we can calculate the eta value using the adjusted vendor L10 data at the expected use temperature as 95,933 hours. The fan Weibull values for the expected use temperature of 45°C are then input for the fan within the RBD using Reliasoft’s BlockSim software package.
- 3. ReliaSoft Weibull++ 7 - www.ReliaSoft.com 0.300 Probability Density Function Pdf 3.2 Review list of critical parts and initial calculations L1 Repair Lognormal-2P RRX SRM MED FM F=24/S=0 Pdf Line Since the results from field data indicated early life 0.240 failures, no aging trends or degradation signs could be extracted to design ALT. Therefore, to optimize ALT plans, a 0.180 list of critical parts in the system was reviewed and component stress level and aging mechanism were studied. List of critical f(t) 0.120 parts included: IGBT’s, DC Buss capacitors, Inverter bridge fans, Inductor fans, AC filter capacitors, Circulation fans. 0.060 Based on, derating analysis on the list of critical parts, IGBT’s and DC Buss capacitors were selected to focus ALT plans on. Golnaz Sanaie schneider-electric 7/30/2012 The selection was done based on reviewing design 5:15:29 PM 0.000 0.000 4.000 8.000 Time, (t) 12.000 16.000 20.000 FMEA, component derating, and reliability predictions. In the Figure 3. Failure Rate versus time case of fans, AC filter and DC Buss Capacitors additional reliability calculation was done based on characteristic life The plot indicates the build of the repair do not take very from vendor data, electrical and thermal stress conditions, and much time with majority of probability density function (PDF) (η) and slope (β). being below 3 hours, whereas a few may take significant time 4 ALT TESTING to implement. Repairable systems- This method uses Weibull general Based on the reliability calculations, discussions with renewal process (GRP) 6], which considers multiple failures engineering and component vendors, IGBT and DC Buss for a single Inverter and hence should provide a more realistic capacitor aging were identified as the main drivers of product approach for this data analysis. Both parametric and aging. Thus, bridge ALT plan was designed as a subsystem nonparametric analyses were considered here. level ALT to address IGBT aging and the system level ALT In the parametric RDA analysis we chose “Type I” since plan designed to address DC Buss capacitor aging. In both it was known that repairs did not make the system any ALT plans, we chose a reliability goal of 80% and had sample younger. Similar to analysis based on non repairable systems, size limitation of 6 for bridge and 2 for system. a β value of less than 1 indicates infant mortality. In nonparametric RDA analysis a plot of failure history as 4.1 Inverter Bridge subsystem ALT number of failures versus time for each inverter is generated. As IGBT’s are designed with thermal margin in our Solar As can be observed in the Figure 4, the Mean Cumulative Inverters, thermal cycling is the main stress factor to cause Function (MCF) shows the increasing time between failures aging. The two most likely thermal cycling induced failure over time; which indicates that time between failures is mechanisms are bond wire fatigue and solder attach fatigue. increasing and again representing infant mortality. The high operating temperatures increase the relative motion The early life failures may represent the first year of of the assembled materials leading to material fatigue and operation of a unit well, and not represent the expected eventual crack propagation. performance from 10 years and beyond at all. Therefore, field Bridge test plan was created primarily based on data is not directly useful for the RBD when considering temperature cycling as the main stress factor causing IGBT reliability beyond the first year. aging. Bond wire fatigue is more prevalent with rapid ReliaSoft Weibull++ 7 - www.ReliaSoft.com Mean Cumulative Function switching applications which is not the use here. Thus, solder 0.500 MCF CB@95% attach failure is expected to be the driving factor. To MCF Lower Limit Upper Limit determine duration of test in this study, weather data for 0.400 Ontario was studied and acceleration factor (AF) for ALT plan was calculated based on Coffin-Manson equation and parameters provided from the vendor. 0.300 (6) M C F where, Tc is the temperature of IGBT copper baseplate 0.201 and N is the number of cycles to 1% failure. Using this number combined with the assumption of β value of 2.3 (assuming a gradual metal fatigue wear out over time for 0.101 planning purposes and based on a study [3] and using Weibull distribution, we can estimate population time to failure 8/5/2010 0.001 0.400 1400.320 2800.240 4200.160 5600.080 7000.000 15:18:33 distribution. To calculate Acceleration Factor (AF) using Measurement equation (4) and (6), we have: Figure 4. Multiple Cumulative Function versus Time (7)
- 4. where N is number of cycles at u (use level) and t (test Test hours for Ontario Weather AF level) temperature, ΔT is temperature cycling at u (use level) 10 years and t (test level) conditions. Based on 20 year weather data 90th percentile, 30°C/90% RH 19 4,660 gathered over the past 20 years at Ontario weather station, th 50 percentile, 15°C/70% RH 241 364 which is used as the main environment for this pilot study, we Based on Table 2 and considering the cost of test calculated environmental data as summarized below. execution, test hours for ALT plan was calculated based on Table 1.Calculation of AF based on Ontario weather ΔT 50th percentile weather data. The system will not experience steady values of temperature nor humidity, and exposure to Test cycles for Environment ΔTc at 480Vdc AF B=-3.831 the highest rated values is limited in time with daily and 10 years seasonal variations. Testing to meet the higher values for Ontario ΔTc 90th percentile, 69.6°C 34 107 these two stresses does provide additional margin for the Ontario ΔTc 50th percentile, 63.5°C 48.6 75 translation of the test results to the use conditions. Also, planning to run environmental chamber from -40°C The primary constraint is the number of samples for (powered off) to +90°C (at full power), the IGBT case testing due to high cost of entire system. The systems are also temperature will cycle from -40°C to 135°C. Therefore, we large physically plus require significant resources to simulate will have AF value of 34 for the 90th percentile Ontario actual operation voltage and currents. The testing was thus weather data. Note that a recalculation of acceleration factor limited to two systems. Using a large walk-in environmental was made to take into account the effect of mini temperature chamber which can provide controlled ambient temperature cycling of IGBT’s due to cloud coverage, however, the overall and humidity level an ALT plan was designed to run at 60°C effect proved to be minimal. To calculate confidence level for and 85%RH. The duration of this test is calculated based on the ALT plan, making the assumption of failure free operation acceleration factor (AF) as follows. Assuming the dominant over the test period for the Inverter Bridges, we can use the failure mechanism is electro-migration throughout this test, extended success testing exponential distribution based sample permits us to use Peck’s relationship to calculate the size formula: acceleration factor. (8) (9) where n is sample size, C is sampling confidence (type I where RH is relative humidity at u (use conditions) and t error or alpha statistical error), m is number of lifetimes the (test conditions), Ea is the activation energy and is equal to 0.9 sample experience in the test, R is the reliability or probability eV based on Peck’s equation [4] and his work to fit numerous of successfully operating over the time period. Having the past studies and results experience, k is the Boltzman’s limit of 6 samples due to cost, we can demonstrate 80% constant or 8.617385x10⁻⁵ eV/k, T is temperature in Kelvin at reliability, and have 74% confidence level for our ALT plan. u (use conditions) and t (test conditions). Using equation (8) Thus, ALT plan is summarized as: testing 6 Inverter to calculate confidence level based on a sample size of only 2 Bridges within a test chamber set to cycle from -40°C to 90°C and a reliability goal of 80% the confidence level is limited to for 108 cycles simulates 10 years of temperature cycling at 36%. Thus, ALT plan for the Inverter System is summarized Ontario’s 90th percentile weather conditions, which if the unit as: testing 2 samples of Inverter Systems at 60°C and 85%RH operates without failure would demonstrate 80% reliability for 326 hours simulates 10 years (8 hours per day) usage at with 74% confidence. Ontario’s nominal weather conditions, which if the unit operates without failure would demonstrate a 80% system 4.2 Inverter Bridge System ALT reliability with 36% confidence. Given the constraint of Many failure mechanisms are competing to cause the system level sample size of 2, the confidence level is very low, system to fail. The most likely set of failure mechanisms thus the system level ALT plan is to explore any failure given the stress of high temperatures, humidity, current and mechanism within the expected nominal life span of the unit voltage bias include the following: metal migration, corrosion, assuming aging of critical components follow Peck’s equation. electro-migration, and time dependent dielectric breakdown 5 RESULTS AND LIFE CALCULATIONS among others. As discussed earlier in the paper, system level ALT plan was designed to address the most likely aging of DC At the time of writing this paper, the ALT plans are under buss capacitors but Inverter bridge fans, Inductor fans, AC execution. Once tests are completed, whether no failure is filter capacitors, Circulation fans would also age throughout observed or we have some failures, the results will be used to this test. For a complex system like the inverter, there is most recalculate reliability of blocks in the system ALT. Then likely a dominant failure mechanism that limits the system BlockSim tool will be used to recalculate Availability and operating life. This test is aimed at providing evidence of that estimate system Availability over the 10 year life period. failure mechanism if failure during planned testing or if the So far, system level testing has been completed which test duration is extending until failure occurs. confirms a minimum of 80% reliability over 10 years of use. Table 2. Calculation of AF based on Ontario weather data Since system ALT was designed based on accelerating failure modes of DC buss capacitors and no failure was observed
- 5. throughout the test, original reliability calculations based on 4. Peck, D.S., “Comprehensive Model for Humidity Testing vendor data and life calculations can be trusted and there is no Correlation,” IEEE IRPS Proceedings, 1986. pp. 44 – 50. need to update RBD. In subsystem testing, out of the 4 5. Condra, L. W. (2001). Reliability Improvement with samples tested so far, we have had 1 bridge failing within the Deisgn of Experiments. New York, Marcel Dekker. total 108 cycles. This means that if this failure is proven to be due to aging mechanism of IGBT’s and not due to test setup, 6. Mettas, A. and Z. Wenbiao (2005). Modeling and analysis we should continue testing all samples for longer cycles to get of repairable systems with general repair. Reliability and failures and update RBD based on new reliability calculations Maintainability Symposium, 2005. Proceedings. Annual. for IGBT’s. 7. Parler, Sam G., Jr., 2004. Deriving Life Multipliers for This project demonstrates a pilot project and provides the Electrolytic Capacitors. IEEE Power Electronics Society steps to calculate useful life based on field data and ALT Newsletter 16 (1):11-12. plans. Although having more field data and using more samples and longer test duration provide more accurate 8. Newcombe, D R, D Chamund, C Bailey, and H Lu. estimations, this project provides a real life example of "Reliability Metrics for IGBT Power Modules." In reliability estimation having multitude of constraints including Electronic Packaging Technology & High Density sample size, test duration, and field data and thus having to Packaging (ICEPT-HDP), 2010 11th International make optimization based on multiple sources of data from Conference. field, to vendor and ALT results. 9. Trinidade, D. and S. Nathan, (2006). Simple plots for 6 APPENDIX- WEATHER DATA monitoring the field reliability of repairable systems. Reliabilty and Maintainability Symposium, 2006. The expected storage environment is indoor sheltered Proceedings, Annual. conditions that may or may not have temperature control. In some situations the storage temperatures may match the BIOGRAPHIES outdoor ambient temperatures. The unit’s storage is expected Golnaz Sanaie to be in populated areas of the world. Rather than use rated 1541 Foster Ave limits or absolute maximum storage temperature expectations Coquitlam, BC, V3J 2N3, Canada which would only apply to a very few situations and units, we will use the 50th percentile (nominal) or 90th percentile values e-mail: golnaz.sanaie@schneider-electric.com for daily average temperature and daily average temperature Golnaz Sanaie is a reliability manager with Schneider Electric range. The National Climatic Data Center [2] has available Solar Business. She has been in the field of reliability since worldwide weather station daily data readings. 2006 starting with Cisco Systems in San Jose, CA and joined The weather data is from 20 randomly selected weather Schneider Electric reliability Solar Business in 2008 and has stations with data from July 1st, 2005 to July 1st, 2010 from been managing the reliability team since 2010. Golnaz holds the worldwide list of stations within the database. The Bachelor and Master’s degree in electronics engineering from resulting 162,000 lines of daily data readings include Simon Fraser University in Vancouver, BC and is an ASQ minimum, maximum, and average temperatures. certified reliability engineer. The maximum temperature is generally only obtained for an hour or so per day. Calculating the difference between daily Fred Schenkelberg minimum and maximum temperatures provides the daily 15466 Los Gatos Blvd #109-371 temperature range. Then, using the Excel percentile function Los Gatos, CA, 95032, USA the 90th percentile and nominal data will be as shown in Table e-mail: fms@opsalacarte.com 1 and Table 2. REFERENCES Fred Schenkelberg is a reliability engineering and management consultant with Ops A La Carte, LLC, with areas 1. T. Xijin, "Cooling fan reliability: failure criteria, of focus including reliability engineering management training accelerated life testing, modeling and qualification." and accelerated life testing. Previously, he co-founded and Reliability and Maintainability Symposium, 2006. RAMS built the HP corporate reliability program, including '06. Annual: 380-384. consulting on a broad range of HP products. He is a lecturer 2. National Climatic Data Center, U.S. Department of with the University of Maryland teaching a graduate level Commerce, as of July 6th 2012, course on reliability engineering management. He earned a http://www7.ncdc.noaa.gov/CDO/cdoselect.cmd?dataseta Master of Science degree in statistics at Stanford University in bby=GSOD&countryabby=&georegionabby= 1996. He earned his bachelors degrees in Physics at the 3. Micol, A, C Martin, O Dalverny, M Mermet-Guyennet, United State Military Academy in 1983. Fred is the and M Karama. "Reliability of Lead-Free Solder in Power immediate Past-Chair of the American Society of Quality Module with Stochastic Uncertainty." Microelectronics Reliability Division, active with IEEE and IEC reliability and Reliability 49, no. 6 (2009). standards development teams. Fred is also the founder of the
- 6. No MTBF movement and website nomtbf.com. He is a Senior Member of ASQ and IEEE. He is an ASQ Certified Quality and Reliability Engineer.