Enumeration technique- McFarland standards- Serial dilution- Spread pl.pdf
estimate a linear regression equation using the El Paso vehicle regis.pdf
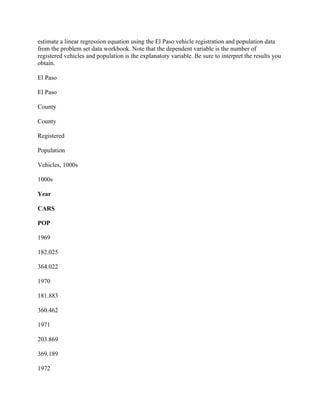
1. estimate a linear regression equation using the El Paso vehicle registration and population data
from the problem set data workbook. Note that the dependent variable is the number of
registered vehicles and population is the explanatory variable. Be sure to interpret the results you
obtain.
El Paso
El Paso
County
County
Registered
Population
Vehicles, 1000s
1000s
Year
CARS
POP
1969
182.025
364.022
1970
181.883
360.462
1971
203.869
369.189
1972