The document provides a financial discussion and analysis of the company's performance in the fourth quarter of 2008 compared to the fourth quarter of 2007. It summarizes that net sales decreased 24% due to weak consumer spending and a slowing global economy. Gross profit declined due to unfavorable price/mix and lower sales volumes. The company also expects to record material non-cash impairment charges based on goodwill and asset testing.
1. Page 1
FINANCIAL DISCUSSION DOCUMENT
The Company has three reportable segments: Consumer Digital Imaging Group (CDG), Film,
Photofinishing and Entertainment Group (FPEG), and Graphic Communications Group (GCG).
Within each of the Company’s reportable segments are various components, or Strategic Product
Groups (SPGs). Throughout the remainder of this document, references to the segments’ SPGs are
indicated in italics. The balance of the Company’s continuing operations, which individually and in
the aggregate do not meet the criteria of a reportable segment, are reported in All Other.
2008 COMPARED WITH 2007
Fourth Quarter
RESULTS OF OPERATIONS – CONTINUING OPERATIONS
CONSOLIDATED
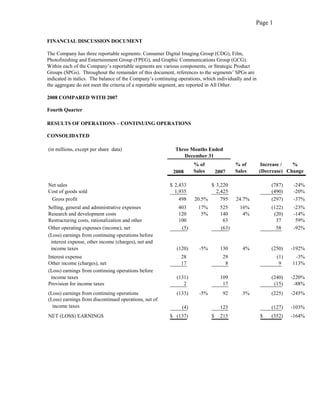
(in millions, except per share data) Three Months Ended
December 31
% of % of Increase / %
Sales Sales (Decrease) Change
2008 2007
Net sales $ 2,433 $ 3,220 (787) -24%
Cost of goods sold 1,935 2,425 (490) -20%
Gross profit 498 20.5% 795 24.7% (297) -37%
Selling, general and administrative expenses 403 17% 525 16% (122) -23%
Research and development costs 120 5% 140 4% (20) -14%
Restructuring costs, rationalization and other 100 63 37 59%
Other operating expenses (income), net (5) (63) 58 -92%
(Loss) earnings from continuing operations before
interest expense, other income (charges), net and
income taxes (120) -5% 130 4% (250) -192%
Interest expense 28 29 (1) -3%
Other income (charges), net 17 8 9 113%
(Loss) earnings from continuing operations before
income taxes (131) 109 (240) -220%
Provision for income taxes 2 17 (15) -88%
(Loss) earnings from continuing operations (133) -5% 92 3% (225) -245%
(Loss) earnings from discontinued operations, net of
income taxes (4) 123 (127) -103%
NET (LOSS) EARNINGS $ (137) $ 215 $ (352) -164%
2. Page 2
Three Months Ended
December 31 Change vs. 2007
Change vs. Foreign Manufacturing
2008 2007 Volume Price/Mix Exchange and Other Costs
Total net sales $ 2,433 -24.4% -13.3% -8.5% -2.6% n/a
Gross profit margin 20.5% -4.2pp n/a -5.6pp -1.7pp 3.1pp
The Company’s operating results in the fourth quarter of 2008 were negatively impacted by a dramatic
decline in demand as a result of the global economic slowdown. The demand for the Company’s consumer
products is largely discretionary in nature, and sales and earnings of the Company’s consumer businesses
are linked to the timing of holidays, vacations, and other leisure or gifting seasons. The fourth quarter of
2008 was marked by weak consumer holiday spending, the impacts of which were significant in the
Company’s digital camera and digital picture frame businesses in the CDG segment. In the GCG segment,
tightening credit availability, combined with the weak economy, resulted in a reduction of capital spending,
negatively impacting equipment sales as well. The reduction of global print demand had a negative impact
on GCG consumables sales. The weak economy also accelerated the decline of Film Capture and
Traditional Photofinishing within the FPEG segment in the fourth quarter.
The Company is currently performing impairment testing of its goodwill and long-lived assets. It is likely
that non-cash impairment charges, which could be material, will be recorded in the fourth quarter of 2008
based on these analyses. Therefore, the fourth quarter results are preliminary, subject to the completion of
these analyses.
Worldwide Revenues
For the three months ended December 31, 2008, net sales decreased by 24% compared with the same
period in 2007 primarily due to the economic factors discussed above and their resulting impact on
sales volume and price/mix, as well as the foreign exchange effects of a strengthening U.S. dollar in
the quarter. CDG and GCG revenue combined, also known as Digital revenue, declined by 23% to
$1,779 million, largely attributable to Digital Capture and Devices in CDG, although all digital
businesses saw revenue declines in the quarter compared with the same period in 2007. FPEG
revenues declined by 27% as compared with the prior year, largely on the volume deterioration in
Film Capture and, to a lesser extent, in Traditional Photofinishing.
Gross Profit
Gross profit declined in the fourth quarter of 2008 in both dollars and as a percentage of sales,
primarily due to unfavorable price/mix across all segments, lower sales volumes and unfavorable
foreign exchange, partially offset by modest reductions in manufacturing and other costs in FPEG and
CDG. The improvements in manufacturing and other costs were driven by lower benefit costs
(including other postemployment benefits), lower depreciation expense due to the change in useful
lives executed in the first quarter of 2008 that benefited FPEG, manufacturing efficiencies within
CDG, and lower restructuring-related charges.
Included in gross profit for the quarter is a new non-recurring intellectual property licensing agreement
within Digital Capture and Devices. The impact of this licensing agreement contributed approximately
4.7% of consolidated revenue to consolidated gross profit dollars in the current quarter, as compared with
5.2% of consolidated revenue to consolidated gross profit dollars for a non-recurring arrangement in the
prior year quarter. The new agreement in the current quarter also provides the Company with an
opportunity for continued collaboration with the licensee.
3. Page 3
In the first quarter of 2008, the Company performed an updated analysis of expected industry-wide declines
in the traditional film and paper businesses and its useful lives on related assets. This analysis indicated
that the assets will continue to be used in these businesses for a longer period than previously anticipated.
As a result, the Company revised the useful lives of certain existing production machinery and equipment,
and manufacturing-related buildings effective January 1, 2008. These assets, which were previously set to
fully depreciate by mid-2010, are now being depreciated with estimated useful lives ending from 2011 to
2015. The change in useful lives reflects the Company’s estimate of future periods to be benefited from the
use of the property, plant, and equipment. As a result of these changes, for full year 2008 the Company
reduced depreciation expense by approximately $107 million, of which approximately $95 million
benefited pretax earnings from continuing operations. The net impact of the change in estimate to earnings
from continuing operations for the three months ended December 31, 2008 was an increase of $26 million,
or $.09 on a fully-diluted earnings per share basis.
Selling, General and Administrative Expenses
The decrease in consolidated selling, general and administrative expenses (SG&A) was a result of
company-wide cost reduction actions, and favorable foreign exchange.
Research and Development Costs
The decrease in consolidated research and development costs (R&D) was primarily the result of
company-wide cost reduction actions and a tighter focus on core priorities.
Restructuring Costs, Rationalization and Other
These costs, as well as the restructuring and rationalization-related costs reported in cost of goods
sold, are discussed under quot;RESTRUCTURING COSTS, RATIONALIZATION AND OTHERquot;
section.
Other Operating (Income) Expenses, Net
This category includes gains and losses on sales of capital assets and certain asset impairment
charges. The year-over-year change was largely driven by significant one-time gains in the 2007
quarter on numerous sales of capital assets, while there were fewer such transactions in the 2008
quarter.
As discussed above, the Company is currently performing impairment testing of its goodwill and
long-lived assets. It is likely that non-cash impairment charges, which could be material, will be
recorded in the fourth quarter of 2008 based on these analyses. Therefore, the fourth quarter results
presented here are preliminary, subject to the completion of these analyses.
Other Income (Charges), Net
This category includes interest income, income and losses from equity investments, and foreign
exchange gains and losses. The increase compared with the prior year was primarily attributable to
the 2007 impairment of an equity method investment and current quarter gains on foreign exchange
transactions. These increases were partially offset by lower interest income due to lower year-over-
year cash balances and lower interest rates.
4. Page 4
Income Tax Provision
(dollars in millions) Three Months Ended
December 31
2008 2007
(Loss) earnings from continuing operations before
income taxes ($131) $109
Provision for income taxes $2 $17
Effective tax rate (1.5)% 15.6%
The change in the Company’s effective tax rate from continuing operations is primarily attributable to:
(1) earnings generated within the U.S. in the fourth quarter of 2008 that were not taxed due to the
impact of valuation allowances, (2) a tax benefit recorded in continuing operations in 2007 for losses
in certain jurisdictions where historically there have been valuation allowances due to the recognition
of the pre-tax gain in discontinued operations, (3) the increase, release or establishment of valuation
allowances in certain jurisdictions outside the U.S. that are evaluated separately by jurisdiction and
dependent on its specific circumstances, (4) the mix of earnings from operations in foreign
jurisdictions that have different income tax rates and are not in a valuation allowance position, and (5)
adjustments relating to 2007 tax rate changes in certain jurisdictions outside the U.S.
CONSUMER DIGITAL IMAGING GROUP
(dollars in millions) Three Months Ended
December 31
% of % of Increase / %
Sales Sales (Decrease) Change
2008 2007
Total net sales $ 958 $ 1,372 (414) -30%
Cost of goods sold 796 1,013 (217) -21%
Gross profit 162 16.9% 359 26.2% (197) -55%
Selling, general and administrative expenses 152 16% 203 15% (51) -25%
Research and development costs 50 5% 65 5% (15) -23%
(Loss) earnings from continuing operations
before interest expense, other income
(charges), net and income taxes $ (40) -4% $ 91 7% $ (131) -144%
Three Months Ended
December 31 Change vs. 2007
2008 Change vs. Foreign Manufacturing
Amount 2007 Volume Price/Mix Exchange and Other Costs
Total net sales $ 958 -30.2% -12.1% -16.1% -2.0% n/a
Gross profit margin 16.9% -9.3pp n/a -11.0pp -1.9pp 3.6pp
5. Page 5
Worldwide Revenues
Net sales for CDG decreased 30% in the current quarter primarily as a result of the sharp decline in
consumer demand globally. The economic downturn experienced in the fourth quarter is
unprecedented and has impacted all industries that rely on consumer discretionary spending. CDG
net sales in the fourth quarter declined from 42% of CDG’s full-year revenue for 2007 to only 31%
of full-year revenue for 2008. However, Kodak has continued to maintain or increase its market
share position in key product categories in which it participates.
Net sales of Digital Capture and Devices, which includes consumer digital still and video cameras,
digital picture frames, accessories, memory products, snapshot printers and related media, and
intellectual property royalties, decreased 36% in the fourth quarter of 2008 as compared with the
prior year quarter, primarily reflecting unfavorable price/mix experienced in digital cameras and
digital picture frames, decreased volumes of digital cameras and snapshot printing, lower total
intellectual property royalties (see gross profit discussion below), and unfavorable foreign
exchange.
Net worldwide sales of Consumer Inkjet Systems, which includes inkjet printers and related
consumables, decreased slightly, primarily due to lower printer sales into retail locations,
unfavorable price/mix and foreign exchange. Sell through of inkjet printers for the full year more
than doubled compared with the prior year, resulting in an estimated installed base of more than 1
million printers as of December 31, 2008.
Net sales of Retail Systems Solutions, which includes kiosks and related media and APEX drylab
systems, decreased 9% in the fourth quarter of 2008, reflecting volume declines and unfavorable
foreign exchange, partially offset by favorable price/mix in kiosk media.
Gross Profit
The decrease in gross profit dollars and margin for CDG was primarily attributable to unfavorable
price/mix within Digital Capture and Devices, lower intellectual property royalties and unfavorable foreign
exchange, partially offset by reduced manufacturing and other costs, primarily in digital picture frames.
Included in gross profit for the quarter is a new non-recurring intellectual property licensing agreement.
The impact of this licensing agreement contributed approximately 12.0% of segment revenue to segment
gross profit dollars in the current quarter, as compared with 12.2% of segment revenue to segment gross
profit dollars for a non-recurring arrangement in the prior year quarter. The new agreement in the current
quarter provides the Company with an opportunity for continued collaboration with the licensee.
The current quarter results also include approximately $32 million related to intellectual property licensing
arrangements under which the Company’s continuing obligations have been fulfilled as of the end of 2008.
The Company expects to secure other new licensing arrangements, the timing and amounts of which are
difficult to predict. These types of arrangements provide the Company with a return on portions of
historical R&D investments and new licensing opportunities are expected to have a continuing impact on
the results of operations.
Selling, General and Administrative Expenses
The decrease in SG&A expenses for CDG was driven by ongoing efforts to achieve target cost models,
including lower and more efficient advertising spend.
6. Page 6
Research and Development Costs
The decrease in R&D costs for CDG was primarily due to reduced spending in 2008 related to the
introduction of consumer inkjet printers in 2007, as well as focused cost reduction actions.
FILM, PHOTOFINISHING AND ENTERTAINMENT GROUP
(dollars in millions) Three Months Ended
December 31
% of % of Increase / %
Sales Sales (Decrease) Change
2008 2007
Total net sales $ 652 $ 894 $ (242) -27%
Cost of goods sold 512 726 (214) -29%
Gross profit 140 21.5% 168 18.8% (28) -17%
Selling, general and administrative expenses 91 14% 138 15% (47) -34%
Research and development costs 10 2% 13 1% (3) -23%
Earnings from continuing operations before
interest expense, other income (charges),
net and income taxes $ 39 6% $ 17 2% $ 22 129%
Three Months Ended
December 31 Change vs. 2007
2008 Change vs. Foreign Manufacturing
Amount 2007 Volume Price/Mix Exchange and Other Costs
Total net sales $ 652 -27.1% -23.8% -0.5% -2.8% n/a
Gross profit margin 21.5% 2.7pp n/a -2.9pp -1.0pp 6.6pp
Worldwide Revenues
Net sales for FPEG decreased 27% primarily reflecting continuing declines in the consumer film
industry and reduced demand due to the global economic slowdown. Net worldwide sales of Film
Capture and Traditional Photofinishing decreased 56% and 27%, respectively, in the fourth quarter
of 2008 as compared with the fourth quarter of 2007.
Net worldwide sales for Entertainment Imaging decreased 10% compared with the prior year,
reflecting volume declines and unfavorable foreign exchange, partially offset by favorable price/mix.
The volume declines are primarily due to the delay in creation of feature films resulting from the
uncertainty surrounding the industry threat of a labor strike, as well as the weak economy.
Gross Profit
FPEG gross profit margin increased in the current quarter led by improvement in Entertainment
Imaging and Traditional Photofinishing. Manufacturing and other costs decreased due to the benefit
of lower depreciation expense as a result of the change in useful lives executed during the first quarter
of this year, and lower benefit costs (including other postemployment benefits), partially offset by
7. Page 7
increased silver costs. The primary drivers of unfavorable price/mix were within Film Capture and
Traditional Photofinishing.
The decrease in FPEG gross profit dollars is primarily a result of declines in sales volume within Film
Capture, unfavorable price/mix within Film Capture and Traditional Photofinishing, and unfavorable
foreign exchange in Entertainment Imaging.
Selling, General and Administrative Expenses
The decline in SG&A expenses for FPEG was attributable to lower benefit costs (including other
postemployment benefits), ongoing efforts to achieve target cost models, as well as favorable foreign
exchange.
GRAPHIC COMMUNICATIONS GROUP
(dollars in millions) Three Months Ended
December 31
% of % of Increase / %
Sales Sales (Decrease) Change
2008 2007
Total net sales $ 821 $ 953 (132) -14%
Cost of goods sold 631 685 (54) -8%
Gross profit 190 23.1% 268 28.1% (78) -29%
Selling, general and administrative expenses 139 17% 183 19% (44) -24%
Research and development costs 55 7% 55 6% - 0%
(Loss) earnings from continuing operations
before interest, other income (charges), net
and income taxes $ (4) 0% $ 30 3% $ (34) -113%
Three Months Ended
December 31 Change vs. 2007
2008 Change vs. Foreign Manufacturing
Amount 2007 Volume Price/Mix Exchange and Other Costs
Total net sales $ 821 -13.9% -5.1% -5.3% -3.5% n/a
Gross profit margin 23.1% -5.0pp n/a -1.9pp -2.0pp -1.1pp
Worldwide Revenues
GCG net sales for the quarter decreased 14% as compared with the prior-year quarter primarily as a
result of volume declines within Prepress Solutions, unfavorable price/mix within Document Imaging
and Digital Printing Solutions, and unfavorable foreign exchange.
Net worldwide sales of Prepress Solutions decreased 15%, primarily driven by volume declines and
unfavorable foreign exchange. Volume declines occurred across most product lines as the decline in
global print demand translated into decreased demand for consumables.
8. Page 8
Net worldwide sales of Digital Printing Solutions decreased 15%, primarily driven by unfavorable
price/mix and foreign exchange. Commercial equipment purchases were negatively impacted by the
global economic issues. General price erosion and a mix shift toward units requiring lower levels of
capital investment also contributed to the fourth quarter sales performance. Page volume growth in
the color electrophotographic space grew 5% in spite of economic conditions.
Net worldwide sales of Document Imaging decreased 17%, primarily due to unfavorable price/mix,
which was driven by a shift toward low-page volume product lines for both production and
distributed scanners.
Net worldwide sales of Enterprise Solutions decreased 9%, primarily due to a decline in workflow
volumes and unfavorable foreign exchange.
Gross Profit
The decline in gross profit dollars was primarily attributable to unfavorable foreign exchange,
unfavorable price/mix, and lower volumes in Prepress Solutions due to market softness for
consumables. The decline in gross profit margin was driven by unfavorable price/mix in Digital
Printing and Document Imaging related to newly-introduced digital printers and scanners, and
weakened demand for equipment, as well as unfavorable foreign exchange.
Selling, General and Administrative Expenses
SG&A expenses decreased by 24%, reflecting lower benefit costs (including postemployment
benefits), favorable foreign exchange, and the ongoing efforts to achieve target cost models.
RESULTS OF OPERATIONS - DISCONTINUED OPERATIONS
The decrease in earnings from discontinued operations was due to the sale of Hermes Precisa Pty. Ltd.
(“HPA”) in the fourth quarter of 2007. HPA was a majority-owned subsidiary of Kodak (Australasia) Pty.
Ltd., a wholly owned subsidiary of the Company.
RESTRUCTURING COSTS, RATIONALIZATION AND OTHER
The Company recognizes the need to continually rationalize its workforce and streamline its
operations to remain competitive in the face of an ever-changing business and economic climate. In
the fourth quarter of 2008, the Company recorded rationalization charges, net of reversals, of $103
million.
9. Page 9
The Company’s rationalization charges and utilization for 2008 were as follows:
Long-lived Asset
Exit Impairments
Severance Costs and Inventory Accelerated
(in millions) Reserve Reserve Write-downs Depreciation Total
Balance as of 12/31/07 $ 129 $ 35 $ - $ - $164
Q1 2008 charges (11) 2 - - (9)
Q1 2008 utilization/cash payments (44) (6) - - (50)
Q1 2008 other adjustments & reclasses 6 (1) - - 5
Balance as of 3/31/08 80 30 - - 110
Q2 2008 charges - 2 2 2 6
Q2 2008 reversals - (3) - - (3)
Q2 2008 utilization/cash payments (24) (6) (2) (2) (34)
Q2 2008 other adjustments & reclasses - 2 - - 2
Balance as of 6/30/08 56 25 - - 81
Q3 2008 charges 45 3 5 2 55
Q3 2008 reversals (3) - - - (3)
Q3 2008 utilization/cash payments (16) (5) (5) (2) (28)
Q3 2008 other adjustments & reclasses (3) (1) - - (4)
Balance as of 9/30/08 79 22 - - 101
Q4 2008 charges 88 7 9 2 106
Q4 2008 reversals (3) - - - (3)
Q4 2008 utilization/cash payments (27) (5) (9) (2) (43)
Q4 2008 other adjustments & reclasses (1) (28) (3) - - (31)
Balance as of 12/31/08 $ 109 $ 21 $ - $ - $130
(1) Reclassification of $31 million primarily for pension related special termination benefit charges,
as well as foreign exchange.
During the three and twelve months ended December 31, 2008, the Company made cash payments
of approximately $32 million and $133 million, respectively, related to rationalization.
The $103 million of charges, net of reversals, for the fourth quarter of 2008 includes $2 million of
charges for accelerated depreciation and $1 million of charges for inventory write-downs, which were
reported in cost of goods sold in the accompanying Consolidated Statement of Operations for the
three months ended December 31, 2008. The remaining costs incurred, net of reversals, of $100
million were reported as restructuring costs, rationalization and other in the accompanying
Consolidated Statement of Operations for the three months ended December 31, 2008. The severance
and exit costs reserves require the outlay of cash, while long-lived asset impairments, accelerated
depreciation and inventory write-downs represent non-cash items.
The charges, net of reversals, of $103 million recorded in the fourth quarter of 2008 included $26
million applicable to FPEG, $16 million applicable to CDG, $34 million applicable to GCG, and $27
10. Page 10
million that was applicable to manufacturing, research and development, and administrative functions,
which are shared across all segments.
The ongoing rationalization actions implemented in the fourth quarter of 2008 are expected to generate
future annual cash savings of approximately $128 million. These savings are expected to reduce future
cost of goods sold, SG&A, and R&D expenses by $56 million, $59 million, and $13 million,
respectively. On a year-to-date basis, the ongoing rationalization actions implemented during the year
2008 are expected to generate future annual cash savings of approximately $196 million. These
savings are expected to reduce future cost of goods sold, SG&A, and R&D expenses by $97 million,
$79 million, and $20 million, respectively. The Company began realizing these savings in the first
quarter of 2008, and expects the savings to be fully realized by the end of the second quarter of 2009 as
most of the actions and severance payouts are completed.
Restructuring and rationalization charges are expected beyond 2008, as the Company is taking a
number of specific actions to strengthen its operations and become more competitive in the face of the
continuing global economic downturn. These actions, which will be announced later today, include
more tightly focusing its portfolio of investments, intensifying its emphasis on generating cash, and
further streamlining its cost structure.
CASH FLOW ACTIVITY
For the Year Ended
(in millions) December 31,
2008 2007 Change
Cash flows from operating activities:
Net cash (used in) provided by continuing operations $ (143) $ 351 $ (494)
Net cash provided by (used in) discontinued operations 296 (37) 333
Net cash provided by operating activities 153 314 (161)
Cash flows from investing activities:
Net cash used in continuing operations (188) (41) (147)
Net cash provided by discontinued operations - 2,449 (2,449)
Net cash (used in) provided by investing activities (188) 2,408 (2,596)
Cash flows from financing activities:
Net cash used in continuing operations (731) (1,324) 593
Net cash provided by discontinued operations - 44 (44)
Net cash used in financing activities (731) (1,280) 549
Effect of exchange rate changes on cash (36) 36 (72)
Net (decrease) increase in cash and cash equivalents $ (802) $1,478 $(2,280)
Operating Activities
Net cash used in continuing operations from operating activities increased $494 million for the year
ended December 31, 2008 as compared with the prior year primarily as a result of the overall decline
in earnings for the year, notably in the 4th quarter as a consequence of the global economic downturn.
Also, while the Company's cash from operating activities did benefit from lower restructuring
payments in 2008 and receipt of the previously disclosed tax refund from the U.S. Internal Revenue
Service of $581 million, of which $270 million was reflected in earnings from continuing operations
during the year, the Company also recognized income during the year which was non-cash in nature,
11. Page 11
or for which cash will be received in 2009. Furthermore, the Company expended cash in 2008 to
reduce liabilities recorded as of the prior year end, which were not recorded at comparable levels as of
December 31, 2008, due to the weak economic environment. The combination of these, and other,
factors led to the use of cash in continuing operations from operating activities of $143 million in
2008, as compared with cash provided on the same basis of $351 million in 2007. Net cash provided
by (used in) discontinued operations increased $333 million as compared with the prior year period
due primarily to the receipt, in the second quarter of 2008, of the refund of past federal income taxes
referred to above.
Investing Activities
Net cash used in continuing operations from investing activities increased $147 million for the year
ended December 31, 2008 as compared with the corresponding period in 2007 due primarily to lower
cash proceeds received from sales of assets and businesses. Net cash provided by discontinued
operations for the year ended December 31, 2007 of $2,449 million represents the proceeds received
from the sale of the Health Group in the second quarter of 2007 and the sale of the Company’s shares
of Hermes Precisa Pty. Limited (HPA) in the fourth quarter of 2007.
Financing Activities
Net cash used in financing activities decreased $549 million for the year ended December 31, 2008 as
compared with the corresponding period in 2007 due to lower repayments of borrowings, mainly due
to the repayment of the Company’s Secured Term Debt in the second quarter of 2007 that was
required as a result of the sale of the Health Group. These reductions in cash usage were partially
offset by repurchases of the Company’s common stock of $301 million.
On June 24, 2008, the Company announced that its Board of Directors authorized a new share
repurchase program allowing the Company, at management’s determination, to purchase up to $1.0
billion of its common stock. The program will expire at the earlier of December 31, 2009 or when the
Company has used all authorized funds for the repurchase of shares. Through December 31, 2008,
the Company repurchased approximately 20 million shares at an average price of $15.01 per share, for
a total cost of $301 million under this program. While the share repurchase authorization remains in
effect through the end of 2009, Kodak is not currently repurchasing any of its shares.
It is the Company’s practice to make semi-annual dividend payments which, when declared by its
Board of Directors, will be paid on the Company’s 10th business day each July and December to
shareholders of record on the close of the first business day of the preceding month. On May 14, 2008,
the Board of Directors declared a semi-annual cash dividend of $.25 per share payable to shareholders
of record at the close of business on June 1, 2008. This dividend, which amounted to $72 million, was
paid on July 16, 2008. On October 14, 2008, the Board of Directors declared a semi-annual cash
dividend of $.25 per share payable to shareholders of record at the close of business on November 3,
2008. This dividend, which amounted to $67 million, was paid on December 12, 2008.
The Company’s Secured Credit Agreement contains various affirmative and negative covenants customary
in a facility of this type, including two quarterly financial covenants: (1) a consolidated debt for borrowed
money to a rolling four-quarter sum of consolidated earnings before interest, taxes, depreciation and
amortization (EBITDA) (subject to adjustments to exclude any extraordinary income or losses, as defined
by the Secured Credit Agreement, interest income and certain non-cash items of income and expense) ratio
of not greater than: 3.50 to 1 as of December 31, 2006 and thereafter, and (2) a consolidated EBITDA to
consolidated interest expense (subject to adjustments to exclude interest expense not related to borrowed
money) ratio, on a rolling four-quarter basis, of no less than 3 to 1. As of December 31, 2008, the
Company maintained a substantial cash balance and was in full compliance with all of the financial
covenants associated with its revolving credit agreement. The Company maintains this credit arrangement
in order to provide additional financial flexibility and currently has no funds drawn in connection with this
arrangement, other than a modest amount of outstanding letters of credit issued under the agreement. In the
12. Page 12
current environment, the Company continues to experience an earnings impact as a result of the economic
downturn and also expects its earnings to be seasonal in nature, as is typical. The Company also expects to
incur significant restructuring charges in the first half of 2009. The combination of these factors has an
impact on the metrics used to determine financial covenant compliance. For this reason, management is
engaged in dialogue with its agent and other key banks to ensure that the Company continues to have
access to a revolving credit agreement.
CAUTIONARY STATEMENT PURSUANT TO SAFE HARBOR PROVISIONS OF THE
PRIVATE SECURITIES LITIGATION REFORM ACT OF 1995
Certain statements in this report may be forward-looking in nature, or quot;forward-looking statementsquot;
as defined in the United States Private Securities Litigation Reform Act of 1995. For example,
references to the Company's expectations regarding the following are forward-looking statements:
its ability to address the impact of the economic downturn; its employment reductions, costs, cash
payments and savings under its restructuring program and other rationalization activities; new
intellectual property licensing arrangements; the seasonality of its earnings; its expectations
regarding the completion of its goodwill and long-lived asset impairment analyses; and its ability to
have continued access to a secured credit facility.
Actual results may differ from those expressed or implied in forward-looking statements. In
addition, any forward-looking statements represent the Company's estimates only as of the date
they are made, and should not be relied upon as representing the Company's estimates as of any
subsequent date. While the Company may elect to update forward-looking statements at some
point in the future, the Company specifically disclaims any obligation to do so, even if its estimates
change. The forward-looking statements contained in this report are subject to a number of factors
and uncertainties, including the successful:
• execution of the digital growth and profitability strategies, business model and cash plan;
• alignment of the Company’s cost structure to the new economic realities;
• execution of the Company’s restructuring and rationalization activities;
• implementation of the Company’s plans to tighten its focus on its portfolio of investments;
• implementation of, and performance under, the debt management program, including
compliance with the Company's debt covenants and the ability to obtain amendments to, or
waivers of, these covenants, if necessary;
• development and implementation of product go-to-market and e-commerce strategies;
• protection, enforcement and defense of the Company's intellectual property, including
defense of its products against the intellectual property challenges of others;
• execution of intellectual property licensing programs and other strategies;
• integration of the Company's businesses to SAP, the Company's enterprise system
software;
• execution of the Company’s planned process driven productivity gains;
• commercialization of the Company’s breakthrough technologies;
• ability to accurately predict product, customer and geographic sales mix and seasonal sales
trends;
• management of inventories, capital expenditures, working capital and cash conversion
cycle;
• integration of acquired businesses and consolidation of the Company's subsidiary
structure;
• improvement in manufacturing productivity and techniques;
• performance under the Company’s share repurchase program;
• conclusion of the Company’s goodwill and long-lived asset impairment analyses;
• improvement in supply chain efficiency and continued availability of essential components
and services from concentrated sources of supply; and
13. Page 13
• implementation of the strategies designed to address the decline in the Company's
traditional businesses.
The forward-looking statements contained in this report are subject to the following additional risk
factors:
• inherent unpredictability of currency fluctuations, commodity prices and raw material
costs;
• competitive actions, including pricing;
• uncertainty generated by volatility in the financial markets and the ability of our customers
to obtain financing;
• the nature and pace of technology evolution;
• changes to accounting rules and tax laws, as well as other factors which could impact the
Company's reported financial position or effective tax rate;
• pension and other postretirement benefit cost factors such as actuarial assumptions, market
performance, and employee retirement decisions;
• general economic, business, geo-political and regulatory conditions or unanticipated
environmental liabilities or costs;
• the severity of the economic downturn and its effect upon customer spending;
• changes in market growth;
• ability to maintain adequate liquidity and financing sources and an appropriate level of
debt;
• possible impairment of goodwill and other assets;
• continued effectiveness of internal controls; and
• other factors and uncertainties disclosed from time to time in the Company's filings with
the Securities and Exchange Commission.
Any forward-looking statements in this report should be evaluated in light of these important
factors and uncertainties.
14. Page 14
Eastman Kodak Company
CONSOLIDATED STATEMENT OF OPERATIONS - UNAUDITED
Three Months Ended Twelve Months Ended
December 31 December 31
(in millions, except per share data) 2008 2007 2008 2007
Net sales $ 2,433 $ 3,220 $ 9,416 $ 10,301
Cost of goods sold 1,935 2,425 7,247 7,757
Gross profit 498 795 2,169 2,544
Selling, general and administrative expenses 403 525 1,583 1,778
Research and development costs 120 140 501 549
Restructuring costs, rationalization and other 100 63 140 543
Other operating (income) expenses, net (5) (63) (19) (96)
(Loss) earnings from continuing operations before interest
expense, other income (charges), net and income taxes (120) 130 (36) (230)
Interest expense 28 29 108 113
Other income (charges), net 17 8 55 87
(Loss) earnings from continuing operations before
income taxes (131) 109 (89) (256)
Provision (benefit) for income taxes 2 17 (143) (51)
(Loss) earnings from continuing operations (133) 92 54 (205)
(Loss) earnings from discontinued operations, net of
income taxes (4) 123 285 881
NET (LOSS) EARNINGS $ (137) $ 215 $ 339 $ 676
Basic net (loss) earnings per share:
Continuing operations $ (0.50) $ 0.32 $ 0.19 $ (0.71)
Discontinued operations (0.01) 0.43 1.01 3.06
Total $ (0.51) $ 0.75 $ 1.20 $ 2.35
Diluted net (loss) earnings per share:
Continuing operations $ (0.50) $ 0.31 $ 0.19 $ (0.71)
Discontinued operations (0.01) 0.40 1.01 3.06
Total $ (0.51) $ 0.71 $ 1.20 $ 2.35
Number of common shares used in basic net (loss) earnings
per share 268.6 288.0 281.8 287.7
Incremental shares from assumed issuance of unvested share-
based awards - 0.4 0.2 -
Convertible securities - 18.6 - -
Number of common shares used in diluted net (loss) earnings
per share 268.6 307.0 282.0 287.7
Cash dividends paid per share $ 0.25 $ 0.25 $ 0.50 $ 0.50
15. Page 15
Eastman Kodak Company
CONSOLIDATED STATEMENT OF FINANCIAL POSITION - UNAUDITED
(in millions, except share and per share data) As of December 31,
2008 2007
ASSETS
CURRENT ASSETS
Cash and cash equivalents $ 2,145 $ 2,947
Receivables, net 1,716 1,939
Inventories, net 948 943
Other current assets 174 224
Total current assets 4,983 6,053
Property, plant and equipment, net 1,551 1,811
Goodwill 1,681 1,657
Other long-term assets 1,745 4,138
TOTAL ASSETS $ 9,960 $ 13,659
LIABILITIES AND SHAREHOLDERS’ EQUITY
CURRENT LIABILITIES
Accounts payable and other current liabilities $ 3,267 $ 3,794
Short-term borrowings and current portion of long-term debt 51 308
Accrued income and other taxes 144 344
Total current liabilities 3,462 4,446
Long-term debt, net of current portion 1,252 1,289
Pension and other postretirement liabilities 2,382 3,444
Other long-term liabilities 1,122 1,451
Total liabilities 8,218 10,630
Commitments and Contingencies
SHAREHOLDERS’ EQUITY
Common stock, $2.50 par value, 950,000,000 shares authorized; 391,292,760
shares issued as of December 31, 2008 and 2007; 268,169,055 and
287,999,830 shares outstanding as of December 31, 2008 and 2007 978 978
Additional paid in capital 901 889
Retained earnings 6,660 6,474
Accumulated other comprehensive (loss) income (749) 452
7,790 8,793
Treasury stock, at cost 123,123,705 shares as of December 31, 2008 and
103,292,930 shares as of December 31, 2007 6,048 5,764
Total shareholders’ equity 1,742 3,029
$ 9,960 $ 13,659
TOTAL LIABILITIES AND SHAREHOLDERS' EQUITY
16. Page 16
Eastman Kodak Company
CONSOLIDATED STATEMENT OF CASH FLOWS - UNAUDITED
Twelve Months Ended
December 31
2008 2007
Cash flows from operating activities:
Net earnings $ 339 $ 676
Adjustments to reconcile to net cash provided by operating activities:
Earnings from discontinued operations, net of income taxes (285) (881)
Depreciation and amortization 500 785
Gain on sales of businesses/assets (14) (157)
Non-cash restructuring and rationalization costs, asset impairments and
other charges 16 336
Provision for deferred income taxes 20 54
Decrease in receivables 148 161
(Increase) decrease in inventories (20) 108
Decrease in liabilities excluding borrowings (720) (624)
Other items, net (127) (107)
Total adjustments (482) (325)
Net cash (used in) provided by continuing operations (143) 351
Net cash provided by (used in) discontinued operations 296 (37)
Net cash provided by operating activities 153 314
Cash flows from investing activities:
Additions to properties (254) (259)
Net proceeds from sales of businesses/assets 92 227
Acquisitions, net of cash acquired (38) (2)
Marketable securities - sales 162 166
Marketable securities - purchases (150) (173)
Net cash used in continuing operations (188) (41)
Net cash provided by discontinued operations - 2,449
Net cash (used in) provided by investing activities (188) 2,408
Cash flows from financing activities:
Stock repurchases (301) -
Proceeds from borrowings 155 177
Repayment of borrowings (446) (1,363)
Dividends to shareholders (139) (144)
Exercise of employee stock options - 6
Net cash used in continuing operations (731) (1,324)
Net cash provided by discontinued operations - 44
Net cash used in financing activities (731) (1,280)
Effect of exchange rate changes on cash (36) 36
Net (decrease) increase in cash and cash equivalents (802) 1,478
Cash and cash equivalents, beginning of year 2,947 1,469
Cash and cash equivalents, end of year $ 2,145 $ 2,947
17. Page 17
Net Sales from Continuing Operations by Reportable Segment and All Other - Unaudited
(in millions) Three Months Ended December 31, Twelve Months Ended December 31,
Foreign Foreign
Currency Currency
Change Impact* Change Impact*
2008 2007 2008 2007
Consumer Digital Imaging Group
Inside the U.S. $ 643 $ 890 -28% 0% $ 1,811 $ 2,012 -10% 0%
Outside the U.S. 315 482 -35 -6 1,277 1,235 +3 +3
Total Consumer Digital Imaging Group 958 1,372 -30 -2 3,088 3,247 -5 +1
Film, Photofinishing and Entertainment
Group
Inside the U.S. 188 251 -25 0 835 1,054 -21 0
Outside the U.S. 464 643 -28 -4 2,152 2,578 -17 +3
Total Film, Photofinishing and
Entertainment Group 652 894 -27 -3 2,987 3,632 -18 +2
Graphic Communications Group
Inside the U.S. 253 302 -16 0 1,036 1,178 -12 0
Outside the U.S. 568 651 -13 -5 2,298 2,235 +3 +5
Total Graphic Communications Group 821 953 -14 -4 3,334 3,413 -2 +3
All Other
Inside the U.S. 1 2 7 10
Outside the U.S. 1 (1) - (1)
Total All Other 2 1 7 9
Consolidated
Inside the U.S. 1,085 1,445 -25 0 3,689 4,254 -13 0
Outside the U.S. 1,348 1,775 -24 -5 5,727 6,047 -5 +4
Consolidated Total $ 2,433 $ 3,220 -24% -3% $ 9,416 $ 10,301 -9% +2%
* Represents the percentage point change in segment net sales for the period that is attributable to foreign
currency fluctuations
18. Page 18
(Loss) Earnings from Continuing Operations Before Interest Expense, Other Income (Charges), Net
and Income Taxes - Unaudited
Three Months Ended Twelve Months Ended
(in millions) December 31, December 31,
2008 2007 Change 2008 2007 Change
Consumer Digital Imaging Group $ (40) $ 91 -144% $ (177) $ (17) -941%
Film, Photofinishing and Entertainment
Group 39 17 +129 196 281 -30
Graphic Communications Group (4) 30 -113 31 104 -70
All Other (4) (8) +50 (17) (25) +32
Total of segments (9) 130 -107 33 343 -90
Restructuring costs, rationalization and
other (103) (68) (149) (662)
Postemployment benefit changes - - 94 -
Other operating income (expenses), net 5 63 19 96
Legal contingency (16) - (26) -
Legal settlement - 5 (10) (7)
Brazil export credit DHL reversal 3 - 3 -
Interest expense (28) (29) (108) (113)
Other income (charges), net 17 8 55 87
Consolidated (loss) earnings from
continuing operations before income
taxes $ (131) $ 109 -220% $ (89) $ (256) +65%