SlideShare a Scribd company logo
1 of 11
Download to read offline
IJRET: International Journal of Research in Engineering and Technology eISSN: 2319-1163 | pISSN: 2321-7308
__________________________________________________________________________________________
Volume: 03 Issue: 02 | Feb-2014, Available @ http://www.ijret.org 204
TREATMENT OF DISTILLERIES AND BREWERIES SPENT WASH
WASTEWATER
Sohail Ayub1
, Shoebuddin Usmani2
1
Associate Professor, Civil Engg. Dept. Aligarh Muslim University (AMU), Aligarh
2
Assistant Professor CED, Integral University, Lucknow
Abstract
The distillery sector is one of the seventeen categories of major polluting industries in India. These units generate large volume of
dark brown colored wastewater, which is known as “spent wash”. Liquid wastes from breweries and distilleries possess a
characteristically high pollution load and have continued to pose a critical problem of environmental pollution in many countries. The
principal pollution effects of the wastewaters of these fermentation industries on a water course are multiple in natures. An attempt
has been made to high light the treatment of distillery spent wash by using natural adsorbent. The results obtained herein indicate the
feasibility of activated carbon used as an adsorbent for removal of pollutants from distillery spent wash. The results show the
significant amount of reduction of pollutants by activated carbon. The study concluded that adsorbent dosage, contact time and
effluent dilutions all the three are important parameters affecting the pollutants removal by adsorption.
Keywords: Distillery waste water, treatment, activated carbon
----------------------------------------------------------------------***-----------------------------------------------------------------------
1. INTRODUCTION
1.1 The Need for Treating Distillery Effluent
The distillery sector is one of the seventeen categories of
major polluting industries in India. These units generate large
volume of dark brown coloured wastewater, which is known
as “spent wash”. (MoEF).Liquid wastes from breweries and
distilleries possess a characteristically high pollution load and
have continued to pose a critical problem of environmental
pollution in many countries. The principal pollution effects of
the wastewaters of these fermentation industries on a water
course are multiple in natures. High temperature of the
wastewaters may instantaneously kill fish and other aquatic
organisms, thus destroying the flora and fauna of a river, when
the wastewaters are discharged into it. The most damaging
effect of the wastewaters of the fermentation industries,
especially distillery, on a stream is caused by high
concentration of readily decomposable organic matters present
in the waste waters. Due to decomposition of soluble and
suspended organic matters present in the wastewaters, high
BOD (Biochemical Oxygen Demand) and COD (Chemical
Oxygen Demand) of the wastewaters results, causing rapid
depletion of the oxygen content of the water, thus creating a
foul smell. This further promotes growth of nuisance
organisms and can render the stream totally unfit for
propagating fish life and for the purpose of drinking, personal
hygiene, recreation and other purposes. The distillery
effluents, when drained into a water source, make it
susceptible for the propagation of harmful microbes. Thus
creating serious biological hazards like the generation and
propagation of the water borne diseases. This required that the
effluents of the distillery are either treated or utilized
profitably.
2. IMPACT OF DISTILLERY EFFLUENT ON
ENVIRONMENT
Following are the impacts of distillery effluent on
environment.
 Discharge of wastewater with high TDS would have
adverse impact on aquatic life and to make unsuitable
water for drinking purpose, if used for irrigation
reduce the crop yield ,corrosion in water system and
pipe line.
 Suspended solids in wastewater reduce the light
penetration and plant production as a result in
receiving water by increasing turbidity it can also
clog the fish gills.
 High amount of BOD in the wastewater leads to the
decomposition of organic matter under the anaerobic
condition that produces highly objectionable products
including Methane (CH4), Ammonia (NH3), and
Hydrogen Sulphide (H2S) gas.
 Low Dissolved Oxygen (DO) in water bodies affect
the aquatic life as DO drops fish and other species are
threatened and may get killed.
 Fall in DO levels causes undesirable odours, tastes
and reduce the acceptability of water for domestic
purpose.
 In steam generation, DO is one of the most important
factors causing corrosion of the boiler material.
IJRET: International Journal of Research in Engineering and Technology eISSN: 2319-1163 | pISSN: 2321-7308
__________________________________________________________________________________________
Volume: 03 Issue: 02 | Feb-2014, Available @ http://www.ijret.org 205
 Generally, industrial wastewater changes pH level of
the receiving water body. Such changes can affect
ecological aquatic system; excessive acidity
particularly can result in release of hydrogen sulphide
(H2S) to air.
 Alkaline nature of wastewater causes declination in
plant growth and crop growth.
 Colour and odour of the effluent of distillery was red
brown in colour with unpleasant odour of Indol,
Sketol and other sulphur compounds.
 Spent wash is a complex, multi component stream
that is known to cause considerable fouling.
3. ADSORPTION FOR DISTILLERY
WASTEWATER TREATMENT
Adsorption of an adsorbent from a solution is caused by
physical and chemical forces. The physical background is
produced mainly by Van Der Waals and electrostatic forces,
between an adsorbate and the atoms conforming the adsorbate
surface. Chemical adsorption generally involves electron
transfer between solid and liquid phases. Adsorption from
solutions occurs because of differences in concentration
(activities) in solution, and in the carbon pores. The adsorption
process comprehends four steps. Three of these steps involve
diffusion and the fourth one is adsorption:
 The molecule to be removed migrates from the bulk
of the solution to the liquid layer surrounding the AC
particle.
 The material has to migrate through the surface film
to reach the outer surface of the carbon.
 Then, it must diffuse into the pores.
 Finally, the material will be adsorbed deep in the
micropore region of the activated carbon.
 The experimental methodology adopted in the
present study. It includes adsorption to evaluate the
pollutants from distillery spent wash (wastewater).
Activated carbon has been used as an adsorbent for
the removal of COD, TDS, pH, DO.
3.1 Sampling Location
The water samples were brought from the industry “Wave
distilleries and breweries private limited” located at village
Ahmadpura, kali nadi, harduagunj, 16 km from Aligarh and
analyzed for different parameters in the environmental
engineering laboratory of civil engineering department,
Z.H.C.E.T, Aligarh Muslim University, Aligarh, Uttar
Pradesh, India. Dark plastic bottles of 2 liters capacity each
with a stopper were used for collecting samples. Each bottle
was washed with 2% nitric acid and then rinsed three times
with distilled water. The bottles were then preserved in a clean
place. The bottles were filled leaving no air space, and then
the bottle was sealed to prevent any leakage and stored in a
cool place. Each container was clearly marked with the name,
location and date of sampling.
3.2 Sample Characteristics
The sample was collected directly from distillery effluent
outlet pipe which is discharging the effluent into Kali nadi.
Sample which was collected is colour less giving an
unpleasant smell of like burnt sugar the temperature of the
sample is high around 30° C.
3.3 Preparation of Sample Dilutions
In order to check the effect of different dilutions of spent wash
on removal efficiency of different pollutants and different type
of heavy metals from the wastewater the spent wash has been
diluted to three different dilutions i.e. 25% of sample, 50% of
sample and 100% pure sample. Each dilution sample of 600ml
quantity has been prepared taking 25% and 50% sample and
diluting it to 600 ml with distilled water. Third sample is pure
spent wash of 600 ml quantity.
4. EXPERIMENTAL WORK AND ANALYSIS
Experiment consists of adsorption carried out with different
adsorbent dosage and contact time with the three different
dilutions of sample as shown in Table1.
Adsorbent dosage of 2g, 5g, and 10g with the corresponding
contact time of 6hr, 12hr and 24hr for each sample was used
with each dilution. Each diluted sample of 600ml quantity is
divided into three parts of 200ml quantity each. There are total
nine samples three from each diluted sample of 200ml
quantity each. Each concentrations each sample is taken in a
volumetric flask of 250ml and added with a desired adsorbent
dose. Each flask was shaken for one hour and the samples was
filtered and collected for analysis after desired contact time.
Whole adsorption test was performed at room temperature.
Table 1 Showing varying adsorbent dose with contact time at different dilutions
Sample no. 25% dilution Sample no. 50% dilution Sample no. 100% sample
Ad(g) Ct(hr) Ad(g) Ct(hr) Ad(g) Ct(hr)
1 1 6 1 1 6 1 1 6
2 5 12 2 5 12 2 5 12
3 10 24 3 10 24 3 10 24
Ad: adsorbent dose (gram) Ct: contact time (hour)
IJRET: International Journal of Research in Engineering and Technology eISSN: 2319-1163 | pISSN: 2321-7308
__________________________________________________________________________________________
Volume: 03 Issue: 02 | Feb-2014, Available @ http://www.ijret.org 206
4.1 ANALYSIS OF SPENT WASH BEFORE
ADSORPTION
Following are the parameters in a tabular form (Table 2)
which were analyzed initially i.e. before adsorption for the
three dilutions of 25%, 50% and 100% pure sample and with
different adsorbent dose and contact time.
Table 2: Showing parameter analyzed before adsorption.
Parameters For 25%
sample
dilution
For 50%
sample
dilution
For
100%
pure
sample
pH 5.4 5.99 4.29
COD(mg/l) 1200 2560 3200
TDS(mg/l) 361 491 675
DO(mg/l) 3.0 1.7 1.2
5. RESULTS AND DISCUSSION
5.1 Graphs after Adsorption
The following graphs will give better illustration of the results
obtained following the analysis of spent wash. Here the results
obtained are graphically represented for various wastewater
quality parameters.
For 25% Effluent Dilution
Fig 1: variation of COD with adsorbent dose and contact time
In Figure 1 COD decreases with increase in adsorbent dose up
to 10gm and contact time of 24hr and then attains a constant
value with increase in adsorbent dose and contact time. The
maximum percent removal 93.33% has been observed at an
adsorbent dose of 10gm/200ml, contact time of 24hr with 25%
diluted sample. The result can also be summarized in Table 3.
1200
480
160
80
0
6
12
18
24
30
0
200
400
600
800
1000
1200
1400
0 1 2 3 4 5 6 7 8 9 10 11
Contacttime(hr)
COD(mg/l)
Adsorbent dose (grm)
variation of COD with adsorbent
dose and contact time
COD
contact time
IJRET: International Journal of Research in Engineering and Technology eISSN: 2319-1163 | pISSN: 2321-7308
__________________________________________________________________________________________
Volume: 03 Issue: 02 | Feb-2014, Available @ http://www.ijret.org 207
Fig 2: Variation of TDS with adsorbent dose and contact time
In Figure 2 TDS decreases with increase in adsorbent dose up
to 10gm and contact time of 24hr. The maximum percent
removal 70.6% has been observed at an adsorbent dose of
10gm/200ml, contact time of 24hr with 25% diluted sample.
Fig 3: Variation of pH with adsorbent dose and contact time
In Figure 3 pH increases with increase in adsorbent dose up to
2gm and contact time of 6hr and then decreases with increase
in adsorbent dose and contact time. The maximum percent
removal 25.31% has been observed at an adsorbent dose of
2gm/200ml and contact time of 6hr with 25% diluted sample.
361
276
210
106
0
6
12
18
24
30
0
50
100
150
200
250
300
350
400
0 1 2 3 4 5 6 7 8 9 10 11
Contacttime(hr)
TDS(mg/l)
Adsorbent dose (grm)
Variation of TDS with adsorbent dose
and contact time
TDS
contact time
5.4
7.23 6.87 6.75
0
6
12
18
24
30
0
2
4
6
8
0 2 4 6 8 10 12
Contacttime(hr)
pH
Adsorbent dose (grm)
Variation of pH with adsorbent dose
and contact time
Ph
contact time
IJRET: International Journal of Research in Engineering and Technology eISSN: 2319-1163 | pISSN: 2321-7308
__________________________________________________________________________________________
Volume: 03 Issue: 02 | Feb-2014, Available @ http://www.ijret.org 208
Fig 4: Variation of DO with adsorbent dose and contact time
In Figure 4 DO increases up to a maximum value of 9.2 with
increase in adsorbent dose up to 10gm and contact time of
24hr. The maximum percent removal 67.39% has been
observed at an adsorbent dose of 10gm/200ml, contact time of
24hr with 25% diluted sample.
For 50% Effluent Dilution
Fig 5: Variation of DO with adsorbent dose and contact time
In Figure 5 DO increases up to a maximum value of 8.5 with
increase in adsorbent dose up to 10gm and contact time of
24hr. The maximum percent removal 80% has been observed
at an adsorbent dose of 10gm/200ml, contact time of 24hr with
50% diluted sample. The result can also be summarized in
Table 4.
3
4.9
6.3
9.2
0
6
12
18
24
30
0
2
4
6
8
10
0 2 4 6 8 10 12
Contacttime(hr)
DO(mg/l)
Adsorbent dose (grm)
variation of DO with adsorbent
dose and contact time
DO
contact time
1.7
2.76
4.6
8.5
0
6
12
18
24
30
0
1
2
3
4
5
6
7
8
9
0 2 4 6 8 10 12
Contacttime(hr)
DO(mg/l)
Adsorbent dose (grm)
Variation of DO with adsorbent
dose and contact time
DO
contact time
IJRET: International Journal of Research in Engineering and Technology eISSN: 2319-1163 | pISSN: 2321-7308
__________________________________________________________________________________________
Volume: 03 Issue: 02 | Feb-2014, Available @ http://www.ijret.org 209
Fig 6: Variation of pH with adsorbent dose and contact time
In figure 6 pH increases with increase in adsorbent dose up to
5gm and contact time of 12hr and then decreases with increase
in adsorbent dose and contact time. The maximum percent
removal 20.13% has been observed at an adsorbent dose of
5gm/200ml, contact time of 12hr with 50% diluted sample.
Fig 7: Variation of COD with adsorbent dose and contact time
In Figure 7 COD decreases with increase in adsorbent dose up
to 10gm and contact time of 24hr and then attains a constant
value with increase in adsorbent dose and contact time. The
maximum percent removal 75% has been observed at an
adsorbent dose of 10gm/200ml, contact time of 24hr with 50%
diluted sample.
5.99
6.95
7.5
6.75
0
6
12
18
24
30
0
1
2
3
4
5
6
7
8
0 1 2 3 4 5 6 7 8 9 10 11
Contacttime(hr)
pH
Adsorbent dose (grm)
Variation of pH with adsorbent
dose and contact time
Ph
contact time
2560
1920
960
640
0
6
12
18
24
30
0
500
1000
1500
2000
2500
3000
0 2 4 6 8 10 12
Contacttime(hr)
COD(mg/l)
Adsorbent dose (grm)
Variation of COD with adsorbent
dose and contact time
COD
contact time
IJRET: International Journal of Research in Engineering and Technology eISSN: 2319-1163 | pISSN: 2321-7308
__________________________________________________________________________________________
Volume: 03 Issue: 02 | Feb-2014, Available @ http://www.ijret.org 210
Fig 8: Variation of TDS with adsorbent dose and contact time
In Figure 8 TDS increases with increase in adsorbent dose up
to 2gm and contact time of 6hr and then decreases with
increase in adsorbent dose and contact time. The maximum
percent removal 45.21% has been observed at an adsorbent
dose of 10gm/200ml, contact time of 24hr with 50% diluted
sample.
For 100% Effluent Dilution
Fig 9: Variation of pH with adsorbent dose and contact time
In Figure 9 pH increases with increase in adsorbent dose up to
5gm and contact time of 12hr and then there is not much effect
with increase in adsorbent dose and contact time. The
maximum percent removal 42.95% has been observed at an
adsorbent dose of 10gm/200ml, contact time of 24hr with
100% pure sample. The result can also be summarized in
Table 5.
491
675
308 269
0
6
12
18
24
30
0
100
200
300
400
500
600
700
800
0 2 4 6 8 10 12
Contacttime(hr)
TDS(mg/l)
Adsorbent dose (grm)
Variation of TDS with adsorbent
dose and contact time
TDS
contact time
4.29
6.47
7.41 7.52
0
6
12
18
24
30
0
1
2
3
4
5
6
7
8
0 1 2 3 4 5 6 7 8 9 10 11
Contacttime(hr)
pH
Adsorbent dose (grm)
Variation of pH with adsorbent
dose and contact time
Ph
contact time
IJRET: International Journal of Research in Engineering and Technology eISSN: 2319-1163 | pISSN: 2321-7308
__________________________________________________________________________________________
Volume: 03 Issue: 02 | Feb-2014, Available @ http://www.ijret.org 211
Fig 10: variation of COD with adsorbent dose and contact time
In Figure 10 COD decreases with increase in adsorbent dose
up to 10gm and contact time of 24hr and then attains a
constant value with increase in adsorbent dose and contact
time. The maximum percent removal 40% has been observed
at an adsorbent dose of 10gm/200ml, contact time of 24hr with
100% diluted sample.
Fig 11: variation of TDS with adsorbent dose and contact time
In Figure 11 TDS decreases with increase in adsorbent dose
up to 10gm and contact time of 24hr and then attains a
constant value with increase in adsorbent dose and contact
time. The maximum percent removal 39.85% has been
observed at an adsorbent dose of 10gm/200ml, contact time of
24hr with 100% diluted sample.
3200
2560
2240
1920
0
6
12
18
24
30
0
500
1000
1500
2000
2500
3000
3500
0 2 4 6 8 10 12
Contacttime(hr)
COD(mg/l)
Adsorbent dose (grm)
Variation of COD with adsorbent
dose and contact time
COD
contact time
675
561 535
406
0
6
12
18
24
30
0
100
200
300
400
500
600
700
800
0 2 4 6 8 10 12
Contacttime(hr)
TDS(mg/l)
Adsorbent dose (grm)
Variation of TDS with adsorbent
dose and contact time
TDS
contact time
IJRET: International Journal of Research in Engineering and Technology eISSN: 2319-1163 | pISSN: 2321-7308
__________________________________________________________________________________________
Volume: 03 Issue: 02 | Feb-2014, Available @ http://www.ijret.org 212
Fig 12: Variation of DO with adsorbent dose and contact time
In Figure 12 DO increases up to a maximum value of 7.9 with
increase in adsorbent dose up to 10gm and contact time of
24hr. The maximum percent removal 84.8% has been
observed at an adsorbent dose of 10gm/200ml, contact time of
24hr with 100% diluted sample.
Table 3: Results analyzed from graphs for 25% sample dilution after adsorption
Parameters For 25% effluent dilution
Initial concentration Final concentration after Removal(%) after
6hr 12hr 24hr 6hr 12hr 24hr
pH 5.4 7.23 6.87 6.75 25.31 21.39 20
COD(mg) 1200 480 160 80 60 86.66 93.33
TDS(mg/) 361 276 210 106 23.54 41.82 70.6
DO(mg/l) 3.0 4.9 6.3 9.2 38.77 52.38 67.39
Table 4: Results analyzed from graphs for 50% sample dilution after adsorption
Parameters For 50% effluent dilution
Initial concentration Final concentration after Removal(%) after
6hr 12hr 24hr 6hr 12hr 24hr
pH 5.99 6.95 7.5 6.75 13.81 20.13 11.25
COD(mg/l) 2560 1920 960 640 25 62.5 75
TDS(mg/l) 491 675 308 269 27.25 37.27 45.21
DO(mg/l) 1.7 2.76 4.6 8.5 38.4 63.04 80
1.2
1.9
3.4
7.9
0
6
12
18
24
30
0
2
4
6
8
10
0 2 4 6 8 10 12
Contacttime(hr)
DO(mg/l)
Adsorbent dose (grm)
Variation of DO with adsorbent
dose and contact time
DO
contact time
IJRET: International Journal of Research in Engineering and Technology eISSN: 2319-1163 | pISSN: 2321-7308
__________________________________________________________________________________________
Volume: 03 Issue: 02 | Feb-2014, Available @ http://www.ijret.org 213
Table5: Results analyzed from graphs for 100% pure sample after adsorption
Parameters For 100% sample
Initial concentration Final concentration after Removal(%) after
6hr 12hr 24hr 6hr 12hr 24hr
pH 4.29 6.47 7.41 7.52 33.69 42.10 42.9
COD(mg/l) 3200 2560 2240 1920 20 30 40
TDS(mg/l) 675 561 535 406 16.88 20.74 39.8
DO(mg/l) 1.2 1.9 3.4 7.9 36.84 64.70 84.8
5.2 Discussion
The results which are obtained after treatment of distillery
spent wash most of which are within the permissible limits.
The characteristic of spent wash do not allow its discharge
into a water body, hence it requires treatment. Biological
treatment, especially with pure cultures, appears promising
and possibly cost-effective for color removal; however, the
initiatives are mainly confined to laboratory trials. Adsorbents
like activated carbon that result in almost complete
decolourisation are not cost effective for treating the enormous
volumes of spent wash typically generated in a distillery.
Thus, there is scope for examining low cost adsorbents,
including wastes generated in other industrial processes /
operations. The production of distillery must be incorporated
in the design to accommodate the increased amount of
effluent. Extensive research has been conceded out on healing
of distillery wastes in many parts of the world. Effluent in an
organic nutrient solution, it has a wide spectrum of utility.
There have been some attempts to use spent wash as substrate
for yeast growth or for biochemical production.
Table 6: Final results in a tabular form
Pollutants Sample Dilution% Adsorbent dose (gram) Contact time (hr) % Removal
pH 100% 10 24 42.95
COD 25% 10 24 93.33
TDS 25% 10 24 70.6
DO 100% 10 24 84.8
6. BASED ON THE EXPERIMENTS
PERFORMED, THE FOLLOWING
CONCLUSIONS ARE DRAWN
1. The activated carbon is found to be effective adsorbent.
2. It has been observed that adsorbent dose of 10 gram
and contact time of 24 hr for 200ml of sample is found
to be most effective for different dilutions for removal
of most pollutants.
3. While for removal of heavy metals, adsorbent dose of 5
gram and contact time of 12 hr found to be most
effective.
4. On increasing the adsorbent dose and contact time after
this limit there is not much effect on the removal of
pollutants and heavy metals.
5. This is because of the adsorptive capacity of the
adsorbent is reached to an end.
6. The adsorbent dosage, pH, contact time and initial
concentration of organic matter have significant effect
on the COD removal and dissolved oxygen.
7. The maximum removal (42.95%) of pH has been
observed at 10gm/200ml of adsorbent dose and a
contact time of 24hr for 100% pure sample.
8. The maximum removal (93.33%) of COD has been
observed at 10gm/200ml of adsorbent dose and a
contact time of 24hr for 25% diluted sample.
9. The maximum removal (70.6%) of TDS has been
observed at 10gm/200ml of adsorbent dose and a
contact time of 24hr for 25% diluted sample.
10. The maximum removal (84.8%) of DO has been
observed at 10gm/200ml of adsorbent dose and a
contact time of 24hr for 100% pure sample.
11. It is also found that there is a certain limit for
increasing the adsorbent doses for given amount of
effluent. This has to be carefully controlled. An excess
use can leads to uneconomical process. The initial
IJRET: International Journal of Research in Engineering and Technology eISSN: 2319-1163 | pISSN: 2321-7308
__________________________________________________________________________________________
Volume: 03 Issue: 02 | Feb-2014, Available @ http://www.ijret.org 214
concentration plays an important role throughout the
adsorption.
12. Regeneration and disposal depends on the amount and
the availability of the adsorbent.
REFERENCES
[1] Sunil J. Kulkarni, Suhas V Patil, and Y. P. Bhalerao
“Fly ash adsorption studies for organic matter removal
accompanying increase in dissolved oxygen”.
[2] Vernon L. Snoeyink, Ph.D. & R. Scott Summers, Ph.D.
“adsorption of organic compounds”.
[3] European business and technology centre: European
Union: association of European chambers of commerce
and industry.
[4] J.S. Kamyotra and R.M. Bhardwaj “Municipal
wastewater management in India”.
[5] Milind R.Gidde, Julie Dutta', Snehal Jadhav
“Comparative adsorption studies on activated rice husk
and rice husk ash by using methylene blue as dye”.
[6] Technologies for the treatment of molasses based
distillery effluents.
[7] Technical EIA guidance manual for distilleries.
[8] Keith R. du Plessis “Community-level analysis of the
microbiology in constructed wetlands treating distillery
effluent”.
[9] Lt Col Mantha Nagaraj, Dr Arvind Kumar “distillery
wastewater treatment and disposal”.
[10] Z.V.P. murthy, L.B. chaudhari “Treatment of distillery
spent wash by combined UF AND RO process”.
[11] Namita Tewari, V K Verma and J P N Rai
“Comparative evaluation of natural adsorbent for
pollutants removal from distillery spent wash”
[12] Dinesh Mohan, Charles U. Pittman Jr. “Arsenic
removal from water/wastewater using adsorbents—A
critical review”.
[13] Sunil J. Kulkarni, Suhas V Patil, and Y. P. Bhalerao
“Flyash adsorption studies for organic Matter Removal
Accompanying Increase in dissolved oxygen”
[14] Mojtaba Hadavifar, Habibollah Younesi, Aliakbar
Zinatizadeh “Application of ozone and granular
activated carbon for distillery effluent treatment”.
[15] Bhise R.M., Patil A.A., Raskar A.R., Patil P.J. and
Deshpande D.P. “Removal of colour of spent wash by
activated charcoal adsorption and electro coagulation”.
[16] Pawar Avinash Shivajirao “Treatment of distillery
waste water using membrane technology”.
[17] Sandeep K. Pandey, Anil K. Gupta, M. Yunus
“Physico-chemical analysis of treated distillery effluent
irrigation responses on crop plants pea (Pisum sativum)
and wheat (Triticum aestivum)”.
[18] Gupta, Sunil Kumara, Gupta, S. K.b, Singh, Gurdeep
“Biodegradation of distillery spent wash in anaerobic
hybrid reactor”.
[19] C.B. Shivayogimath, T.K. Ramanujam “Treatment of
distillery spent wash by hybrid UASB reactor”.
[20] Parmesh Kumar Chaudhari, Indra Mani Mishra, Shri
Chand “Decolourization and removal of chemical
oxygen demand (COD) with energy recovery
Treatment of biodigester effluent of a molasses-based
alcohol distillery using inorganic coagulants”.
[21] Y. Satyawali, M. Balakrishnan “Wastewater treatment
in molasses-based alcohol distilleries for COD and
colour removal”.
[22] Deepak Pant a, Alok Adholeya “Biological approaches
for treatment of distillery wastewater”.
[23] William Camargo N. “Evaluation of Activated Carbon
for Treating Heavy Metals in Aquaculture”.
[24] S.N. Pandey, B.D. Nautiyal and C.P. Sharma
“Pollution level in distillery effluent and its phototoxic
effect on seed germination and early growth of maize
and rice”.
[25] Xolisa Lorraine Melamane 2006 “treatment of wine
distillery wastewaters by high rate anaerobic digestion
and submerged membrane systems”
[26] Technology information, forecasting and assessment
council: department of science and technology govt. of
India.
[27] P j strong “fungal remediation of distillery and winery
wastewater”.
[28] K. Vasanth Kumar, K. Subanandam, V. Ramamurthi
and S. Sivanesan “solid liquid adsorption for
wastewater treatment: principle design and operation”.

More Related Content

What's hot

Textile Wastewater Treatment Methods
Textile Wastewater Treatment Methods Textile Wastewater Treatment Methods
Textile Wastewater Treatment Methods Uroosa Samman
 
Removal of fluoride from synthetic waste water by using “bio adsorbents”
Removal of fluoride from synthetic waste water by using “bio adsorbents”Removal of fluoride from synthetic waste water by using “bio adsorbents”
Removal of fluoride from synthetic waste water by using “bio adsorbents”eSAT Publishing House
 
DEFLUORIDATION BY BIOADSORBENTS
DEFLUORIDATION BY BIOADSORBENTSDEFLUORIDATION BY BIOADSORBENTS
DEFLUORIDATION BY BIOADSORBENTSNayana 54321
 
Defluoridation of drinking water using low cost bioadsorbents
Defluoridation of drinking water using low cost bioadsorbentsDefluoridation of drinking water using low cost bioadsorbents
Defluoridation of drinking water using low cost bioadsorbentsDayal Kurian
 
Total dissolved solids
Total dissolved solidsTotal dissolved solids
Total dissolved solidsRaz Azad
 
Ecomix Presentation 2014 (EN)
Ecomix Presentation 2014 (EN)Ecomix Presentation 2014 (EN)
Ecomix Presentation 2014 (EN)Ecosoft
 
Textile effulent treatment, Waste water treatment
Textile effulent treatment, Waste water treatmentTextile effulent treatment, Waste water treatment
Textile effulent treatment, Waste water treatmentKarcahi university
 
Textile effluents dbt meeting 16.1.2006
Textile effluents dbt meeting 16.1.2006Textile effluents dbt meeting 16.1.2006
Textile effluents dbt meeting 16.1.2006Adane Nega
 
Environment issues in dyeing, priniting, finishing of textiles
Environment issues in dyeing, priniting, finishing of textilesEnvironment issues in dyeing, priniting, finishing of textiles
Environment issues in dyeing, priniting, finishing of textilesAdane Nega
 
Water treatment and Analysis
Water treatment and AnalysisWater treatment and Analysis
Water treatment and AnalysisAzmir Latif Beg
 
Final Year Project Proposal-Water purification System
Final Year Project Proposal-Water purification SystemFinal Year Project Proposal-Water purification System
Final Year Project Proposal-Water purification SystemWickramarathne GT
 
water treatment slides
water treatment slideswater treatment slides
water treatment slidesAnand Keshri
 

What's hot (20)

Textile Wastewater Treatment Methods
Textile Wastewater Treatment Methods Textile Wastewater Treatment Methods
Textile Wastewater Treatment Methods
 
Removal of fluoride from synthetic waste water by using “bio adsorbents”
Removal of fluoride from synthetic waste water by using “bio adsorbents”Removal of fluoride from synthetic waste water by using “bio adsorbents”
Removal of fluoride from synthetic waste water by using “bio adsorbents”
 
DEFLUORIDATION BY BIOADSORBENTS
DEFLUORIDATION BY BIOADSORBENTSDEFLUORIDATION BY BIOADSORBENTS
DEFLUORIDATION BY BIOADSORBENTS
 
Textile Effluent Process
Textile Effluent ProcessTextile Effluent Process
Textile Effluent Process
 
Defluoridation of drinking water using low cost bioadsorbents
Defluoridation of drinking water using low cost bioadsorbentsDefluoridation of drinking water using low cost bioadsorbents
Defluoridation of drinking water using low cost bioadsorbents
 
drinking water treatment process
drinking water treatment processdrinking water treatment process
drinking water treatment process
 
Total dissolved solids
Total dissolved solidsTotal dissolved solids
Total dissolved solids
 
Ecomix Presentation 2014 (EN)
Ecomix Presentation 2014 (EN)Ecomix Presentation 2014 (EN)
Ecomix Presentation 2014 (EN)
 
Waste water from textile industry
Waste water from textile industryWaste water from textile industry
Waste water from textile industry
 
Textile effulent treatment, Waste water treatment
Textile effulent treatment, Waste water treatmentTextile effulent treatment, Waste water treatment
Textile effulent treatment, Waste water treatment
 
Biochemical etp
Biochemical etpBiochemical etp
Biochemical etp
 
civil enigneeing
civil enigneeingcivil enigneeing
civil enigneeing
 
Etp
EtpEtp
Etp
 
Textile effluents dbt meeting 16.1.2006
Textile effluents dbt meeting 16.1.2006Textile effluents dbt meeting 16.1.2006
Textile effluents dbt meeting 16.1.2006
 
Effluent treatment
Effluent treatmentEffluent treatment
Effluent treatment
 
Environment issues in dyeing, priniting, finishing of textiles
Environment issues in dyeing, priniting, finishing of textilesEnvironment issues in dyeing, priniting, finishing of textiles
Environment issues in dyeing, priniting, finishing of textiles
 
Water treatment and Analysis
Water treatment and AnalysisWater treatment and Analysis
Water treatment and Analysis
 
Design of a defluoridizing unit
Design of a defluoridizing unitDesign of a defluoridizing unit
Design of a defluoridizing unit
 
Final Year Project Proposal-Water purification System
Final Year Project Proposal-Water purification SystemFinal Year Project Proposal-Water purification System
Final Year Project Proposal-Water purification System
 
water treatment slides
water treatment slideswater treatment slides
water treatment slides
 

Viewers also liked

Indpro Introduction
Indpro IntroductionIndpro Introduction
Indpro Introductionindpro
 
Efficient disposal of harmful effluents from Sugar Industry
Efficient disposal of harmful effluents from Sugar IndustryEfficient disposal of harmful effluents from Sugar Industry
Efficient disposal of harmful effluents from Sugar IndustryChhavi Bansal
 
Sugar inds efluent ppt
Sugar inds efluent pptSugar inds efluent ppt
Sugar inds efluent pptR.K. JAIN
 
INDUSTRAIL WASTE WATER FOR SUGAR CANE INDUSTRY
INDUSTRAIL WASTE WATER FOR SUGAR CANE INDUSTRYINDUSTRAIL WASTE WATER FOR SUGAR CANE INDUSTRY
INDUSTRAIL WASTE WATER FOR SUGAR CANE INDUSTRYSampath Kumar
 
Sugarcane industry waste utilization
Sugarcane industry waste utilizationSugarcane industry waste utilization
Sugarcane industry waste utilizationTamanna Agarwal
 
Characteristics of Waste-Water (Unit-I)
Characteristics of Waste-Water (Unit-I)Characteristics of Waste-Water (Unit-I)
Characteristics of Waste-Water (Unit-I)GAURAV. H .TANDON
 

Viewers also liked (7)

Diageo
DiageoDiageo
Diageo
 
Indpro Introduction
Indpro IntroductionIndpro Introduction
Indpro Introduction
 
Efficient disposal of harmful effluents from Sugar Industry
Efficient disposal of harmful effluents from Sugar IndustryEfficient disposal of harmful effluents from Sugar Industry
Efficient disposal of harmful effluents from Sugar Industry
 
Sugar inds efluent ppt
Sugar inds efluent pptSugar inds efluent ppt
Sugar inds efluent ppt
 
INDUSTRAIL WASTE WATER FOR SUGAR CANE INDUSTRY
INDUSTRAIL WASTE WATER FOR SUGAR CANE INDUSTRYINDUSTRAIL WASTE WATER FOR SUGAR CANE INDUSTRY
INDUSTRAIL WASTE WATER FOR SUGAR CANE INDUSTRY
 
Sugarcane industry waste utilization
Sugarcane industry waste utilizationSugarcane industry waste utilization
Sugarcane industry waste utilization
 
Characteristics of Waste-Water (Unit-I)
Characteristics of Waste-Water (Unit-I)Characteristics of Waste-Water (Unit-I)
Characteristics of Waste-Water (Unit-I)
 

Similar to Treatment of distilleries and breweries spent wash wastewater

Parametric Studies on Detergent Using Low Cost Sorbent
Parametric Studies on Detergent Using Low Cost SorbentParametric Studies on Detergent Using Low Cost Sorbent
Parametric Studies on Detergent Using Low Cost SorbentIOSR Journals
 
A reaserch on cocoa pod husk activated carbon for textile industrial wastewat...
A reaserch on cocoa pod husk activated carbon for textile industrial wastewat...A reaserch on cocoa pod husk activated carbon for textile industrial wastewat...
A reaserch on cocoa pod husk activated carbon for textile industrial wastewat...eSAT Publishing House
 
DOMESTIC WASTE WATER TREATMENT BY FLY AND WOOD ASH ALONG WITH ADDITIVES MATER...
DOMESTIC WASTE WATER TREATMENT BY FLY AND WOOD ASH ALONG WITH ADDITIVES MATER...DOMESTIC WASTE WATER TREATMENT BY FLY AND WOOD ASH ALONG WITH ADDITIVES MATER...
DOMESTIC WASTE WATER TREATMENT BY FLY AND WOOD ASH ALONG WITH ADDITIVES MATER...IAEME Publication
 
A REASERCH ON COCOA POD HUSK ACTIVATED CARBON FOR TEXTILE INDUSTRIAL WASTEWAT...
A REASERCH ON COCOA POD HUSK ACTIVATED CARBON FOR TEXTILE INDUSTRIAL WASTEWAT...A REASERCH ON COCOA POD HUSK ACTIVATED CARBON FOR TEXTILE INDUSTRIAL WASTEWAT...
A REASERCH ON COCOA POD HUSK ACTIVATED CARBON FOR TEXTILE INDUSTRIAL WASTEWAT...Laurie Smith
 
Effluent treatment plant
Effluent treatment plantEffluent treatment plant
Effluent treatment plantchemist_tg
 
Removal of Hexavalent Chromium by Adsorption using low-cost Adsorbents and Ac...
Removal of Hexavalent Chromium by Adsorption using low-cost Adsorbents and Ac...Removal of Hexavalent Chromium by Adsorption using low-cost Adsorbents and Ac...
Removal of Hexavalent Chromium by Adsorption using low-cost Adsorbents and Ac...IRJET Journal
 
“Study The Different Parameters of Sewage Treatment With UASB & SBR Technolog...
“Study The Different Parameters of Sewage Treatment With UASB & SBR Technolog...“Study The Different Parameters of Sewage Treatment With UASB & SBR Technolog...
“Study The Different Parameters of Sewage Treatment With UASB & SBR Technolog...IOSR Journals
 
Paper id 252014132
Paper id 252014132Paper id 252014132
Paper id 252014132IJRAT
 
Study on Physico- Chemical Parameters of Waste Water Effluents from Kombolcha...
Study on Physico- Chemical Parameters of Waste Water Effluents from Kombolcha...Study on Physico- Chemical Parameters of Waste Water Effluents from Kombolcha...
Study on Physico- Chemical Parameters of Waste Water Effluents from Kombolcha...AI Publications
 
Industrial waste water purification procedure
Industrial waste water purification procedureIndustrial waste water purification procedure
Industrial waste water purification procedurepasindulaksara1
 
Removal of arsenic (v) from water by adsorption onto low cost and waste mater...
Removal of arsenic (v) from water by adsorption onto low cost and waste mater...Removal of arsenic (v) from water by adsorption onto low cost and waste mater...
Removal of arsenic (v) from water by adsorption onto low cost and waste mater...eSAT Journals
 
Removal of arsenic (v) from water by adsorption onto low cost and waste mater...
Removal of arsenic (v) from water by adsorption onto low cost and waste mater...Removal of arsenic (v) from water by adsorption onto low cost and waste mater...
Removal of arsenic (v) from water by adsorption onto low cost and waste mater...eSAT Publishing House
 
To Study the Effect of Municipal Treated Effluent on Groundwater Quality Near...
To Study the Effect of Municipal Treated Effluent on Groundwater Quality Near...To Study the Effect of Municipal Treated Effluent on Groundwater Quality Near...
To Study the Effect of Municipal Treated Effluent on Groundwater Quality Near...IRJET Journal
 
Physico Chemical Analysis of Ceramic Industries Wastewater in Khurja District...
Physico Chemical Analysis of Ceramic Industries Wastewater in Khurja District...Physico Chemical Analysis of Ceramic Industries Wastewater in Khurja District...
Physico Chemical Analysis of Ceramic Industries Wastewater in Khurja District...ijtsrd
 
REMOVAL OF TOXIC CHEMICALS AND BIOLOGICAL POLLUTANTS FROM GROUNDWATER WELLS U...
REMOVAL OF TOXIC CHEMICALS AND BIOLOGICAL POLLUTANTS FROM GROUNDWATER WELLS U...REMOVAL OF TOXIC CHEMICALS AND BIOLOGICAL POLLUTANTS FROM GROUNDWATER WELLS U...
REMOVAL OF TOXIC CHEMICALS AND BIOLOGICAL POLLUTANTS FROM GROUNDWATER WELLS U...ijac123
 
lecture on characterization 2015
lecture on characterization 2015lecture on characterization 2015
lecture on characterization 2015Manish Goyal
 

Similar to Treatment of distilleries and breweries spent wash wastewater (20)

Parametric Studies on Detergent Using Low Cost Sorbent
Parametric Studies on Detergent Using Low Cost SorbentParametric Studies on Detergent Using Low Cost Sorbent
Parametric Studies on Detergent Using Low Cost Sorbent
 
A reaserch on cocoa pod husk activated carbon for textile industrial wastewat...
A reaserch on cocoa pod husk activated carbon for textile industrial wastewat...A reaserch on cocoa pod husk activated carbon for textile industrial wastewat...
A reaserch on cocoa pod husk activated carbon for textile industrial wastewat...
 
DOMESTIC WASTE WATER TREATMENT BY FLY AND WOOD ASH ALONG WITH ADDITIVES MATER...
DOMESTIC WASTE WATER TREATMENT BY FLY AND WOOD ASH ALONG WITH ADDITIVES MATER...DOMESTIC WASTE WATER TREATMENT BY FLY AND WOOD ASH ALONG WITH ADDITIVES MATER...
DOMESTIC WASTE WATER TREATMENT BY FLY AND WOOD ASH ALONG WITH ADDITIVES MATER...
 
A REASERCH ON COCOA POD HUSK ACTIVATED CARBON FOR TEXTILE INDUSTRIAL WASTEWAT...
A REASERCH ON COCOA POD HUSK ACTIVATED CARBON FOR TEXTILE INDUSTRIAL WASTEWAT...A REASERCH ON COCOA POD HUSK ACTIVATED CARBON FOR TEXTILE INDUSTRIAL WASTEWAT...
A REASERCH ON COCOA POD HUSK ACTIVATED CARBON FOR TEXTILE INDUSTRIAL WASTEWAT...
 
Waste_Water_testing[1].pdf
Waste_Water_testing[1].pdfWaste_Water_testing[1].pdf
Waste_Water_testing[1].pdf
 
Effluent treatment plant
Effluent treatment plantEffluent treatment plant
Effluent treatment plant
 
Env
EnvEnv
Env
 
Removal of Hexavalent Chromium by Adsorption using low-cost Adsorbents and Ac...
Removal of Hexavalent Chromium by Adsorption using low-cost Adsorbents and Ac...Removal of Hexavalent Chromium by Adsorption using low-cost Adsorbents and Ac...
Removal of Hexavalent Chromium by Adsorption using low-cost Adsorbents and Ac...
 
“Study The Different Parameters of Sewage Treatment With UASB & SBR Technolog...
“Study The Different Parameters of Sewage Treatment With UASB & SBR Technolog...“Study The Different Parameters of Sewage Treatment With UASB & SBR Technolog...
“Study The Different Parameters of Sewage Treatment With UASB & SBR Technolog...
 
Paper id 252014132
Paper id 252014132Paper id 252014132
Paper id 252014132
 
H012314047
H012314047H012314047
H012314047
 
Study on Physico- Chemical Parameters of Waste Water Effluents from Kombolcha...
Study on Physico- Chemical Parameters of Waste Water Effluents from Kombolcha...Study on Physico- Chemical Parameters of Waste Water Effluents from Kombolcha...
Study on Physico- Chemical Parameters of Waste Water Effluents from Kombolcha...
 
Industrial waste water purification procedure
Industrial waste water purification procedureIndustrial waste water purification procedure
Industrial waste water purification procedure
 
Removal of arsenic (v) from water by adsorption onto low cost and waste mater...
Removal of arsenic (v) from water by adsorption onto low cost and waste mater...Removal of arsenic (v) from water by adsorption onto low cost and waste mater...
Removal of arsenic (v) from water by adsorption onto low cost and waste mater...
 
Removal of arsenic (v) from water by adsorption onto low cost and waste mater...
Removal of arsenic (v) from water by adsorption onto low cost and waste mater...Removal of arsenic (v) from water by adsorption onto low cost and waste mater...
Removal of arsenic (v) from water by adsorption onto low cost and waste mater...
 
To Study the Effect of Municipal Treated Effluent on Groundwater Quality Near...
To Study the Effect of Municipal Treated Effluent on Groundwater Quality Near...To Study the Effect of Municipal Treated Effluent on Groundwater Quality Near...
To Study the Effect of Municipal Treated Effluent on Groundwater Quality Near...
 
Physico Chemical Analysis of Ceramic Industries Wastewater in Khurja District...
Physico Chemical Analysis of Ceramic Industries Wastewater in Khurja District...Physico Chemical Analysis of Ceramic Industries Wastewater in Khurja District...
Physico Chemical Analysis of Ceramic Industries Wastewater in Khurja District...
 
REMOVAL OF TOXIC CHEMICALS AND BIOLOGICAL POLLUTANTS FROM GROUNDWATER WELLS U...
REMOVAL OF TOXIC CHEMICALS AND BIOLOGICAL POLLUTANTS FROM GROUNDWATER WELLS U...REMOVAL OF TOXIC CHEMICALS AND BIOLOGICAL POLLUTANTS FROM GROUNDWATER WELLS U...
REMOVAL OF TOXIC CHEMICALS AND BIOLOGICAL POLLUTANTS FROM GROUNDWATER WELLS U...
 
REMOVAL OF TOXIC CHEMICALS AND BIOLOGICAL POLLUTANTS FROM GROUNDWATER WELLS U...
REMOVAL OF TOXIC CHEMICALS AND BIOLOGICAL POLLUTANTS FROM GROUNDWATER WELLS U...REMOVAL OF TOXIC CHEMICALS AND BIOLOGICAL POLLUTANTS FROM GROUNDWATER WELLS U...
REMOVAL OF TOXIC CHEMICALS AND BIOLOGICAL POLLUTANTS FROM GROUNDWATER WELLS U...
 
lecture on characterization 2015
lecture on characterization 2015lecture on characterization 2015
lecture on characterization 2015
 

More from eSAT Journals

Mechanical properties of hybrid fiber reinforced concrete for pavements
Mechanical properties of hybrid fiber reinforced concrete for pavementsMechanical properties of hybrid fiber reinforced concrete for pavements
Mechanical properties of hybrid fiber reinforced concrete for pavementseSAT Journals
 
Material management in construction – a case study
Material management in construction – a case studyMaterial management in construction – a case study
Material management in construction – a case studyeSAT Journals
 
Managing drought short term strategies in semi arid regions a case study
Managing drought    short term strategies in semi arid regions  a case studyManaging drought    short term strategies in semi arid regions  a case study
Managing drought short term strategies in semi arid regions a case studyeSAT Journals
 
Life cycle cost analysis of overlay for an urban road in bangalore
Life cycle cost analysis of overlay for an urban road in bangaloreLife cycle cost analysis of overlay for an urban road in bangalore
Life cycle cost analysis of overlay for an urban road in bangaloreeSAT Journals
 
Laboratory studies of dense bituminous mixes ii with reclaimed asphalt materials
Laboratory studies of dense bituminous mixes ii with reclaimed asphalt materialsLaboratory studies of dense bituminous mixes ii with reclaimed asphalt materials
Laboratory studies of dense bituminous mixes ii with reclaimed asphalt materialseSAT Journals
 
Laboratory investigation of expansive soil stabilized with natural inorganic ...
Laboratory investigation of expansive soil stabilized with natural inorganic ...Laboratory investigation of expansive soil stabilized with natural inorganic ...
Laboratory investigation of expansive soil stabilized with natural inorganic ...eSAT Journals
 
Influence of reinforcement on the behavior of hollow concrete block masonry p...
Influence of reinforcement on the behavior of hollow concrete block masonry p...Influence of reinforcement on the behavior of hollow concrete block masonry p...
Influence of reinforcement on the behavior of hollow concrete block masonry p...eSAT Journals
 
Influence of compaction energy on soil stabilized with chemical stabilizer
Influence of compaction energy on soil stabilized with chemical stabilizerInfluence of compaction energy on soil stabilized with chemical stabilizer
Influence of compaction energy on soil stabilized with chemical stabilizereSAT Journals
 
Geographical information system (gis) for water resources management
Geographical information system (gis) for water resources managementGeographical information system (gis) for water resources management
Geographical information system (gis) for water resources managementeSAT Journals
 
Forest type mapping of bidar forest division, karnataka using geoinformatics ...
Forest type mapping of bidar forest division, karnataka using geoinformatics ...Forest type mapping of bidar forest division, karnataka using geoinformatics ...
Forest type mapping of bidar forest division, karnataka using geoinformatics ...eSAT Journals
 
Factors influencing compressive strength of geopolymer concrete
Factors influencing compressive strength of geopolymer concreteFactors influencing compressive strength of geopolymer concrete
Factors influencing compressive strength of geopolymer concreteeSAT Journals
 
Experimental investigation on circular hollow steel columns in filled with li...
Experimental investigation on circular hollow steel columns in filled with li...Experimental investigation on circular hollow steel columns in filled with li...
Experimental investigation on circular hollow steel columns in filled with li...eSAT Journals
 
Experimental behavior of circular hsscfrc filled steel tubular columns under ...
Experimental behavior of circular hsscfrc filled steel tubular columns under ...Experimental behavior of circular hsscfrc filled steel tubular columns under ...
Experimental behavior of circular hsscfrc filled steel tubular columns under ...eSAT Journals
 
Evaluation of punching shear in flat slabs
Evaluation of punching shear in flat slabsEvaluation of punching shear in flat slabs
Evaluation of punching shear in flat slabseSAT Journals
 
Evaluation of performance of intake tower dam for recent earthquake in india
Evaluation of performance of intake tower dam for recent earthquake in indiaEvaluation of performance of intake tower dam for recent earthquake in india
Evaluation of performance of intake tower dam for recent earthquake in indiaeSAT Journals
 
Evaluation of operational efficiency of urban road network using travel time ...
Evaluation of operational efficiency of urban road network using travel time ...Evaluation of operational efficiency of urban road network using travel time ...
Evaluation of operational efficiency of urban road network using travel time ...eSAT Journals
 
Estimation of surface runoff in nallur amanikere watershed using scs cn method
Estimation of surface runoff in nallur amanikere watershed using scs cn methodEstimation of surface runoff in nallur amanikere watershed using scs cn method
Estimation of surface runoff in nallur amanikere watershed using scs cn methodeSAT Journals
 
Estimation of morphometric parameters and runoff using rs & gis techniques
Estimation of morphometric parameters and runoff using rs & gis techniquesEstimation of morphometric parameters and runoff using rs & gis techniques
Estimation of morphometric parameters and runoff using rs & gis techniqueseSAT Journals
 
Effect of variation of plastic hinge length on the results of non linear anal...
Effect of variation of plastic hinge length on the results of non linear anal...Effect of variation of plastic hinge length on the results of non linear anal...
Effect of variation of plastic hinge length on the results of non linear anal...eSAT Journals
 
Effect of use of recycled materials on indirect tensile strength of asphalt c...
Effect of use of recycled materials on indirect tensile strength of asphalt c...Effect of use of recycled materials on indirect tensile strength of asphalt c...
Effect of use of recycled materials on indirect tensile strength of asphalt c...eSAT Journals
 

More from eSAT Journals (20)

Mechanical properties of hybrid fiber reinforced concrete for pavements
Mechanical properties of hybrid fiber reinforced concrete for pavementsMechanical properties of hybrid fiber reinforced concrete for pavements
Mechanical properties of hybrid fiber reinforced concrete for pavements
 
Material management in construction – a case study
Material management in construction – a case studyMaterial management in construction – a case study
Material management in construction – a case study
 
Managing drought short term strategies in semi arid regions a case study
Managing drought    short term strategies in semi arid regions  a case studyManaging drought    short term strategies in semi arid regions  a case study
Managing drought short term strategies in semi arid regions a case study
 
Life cycle cost analysis of overlay for an urban road in bangalore
Life cycle cost analysis of overlay for an urban road in bangaloreLife cycle cost analysis of overlay for an urban road in bangalore
Life cycle cost analysis of overlay for an urban road in bangalore
 
Laboratory studies of dense bituminous mixes ii with reclaimed asphalt materials
Laboratory studies of dense bituminous mixes ii with reclaimed asphalt materialsLaboratory studies of dense bituminous mixes ii with reclaimed asphalt materials
Laboratory studies of dense bituminous mixes ii with reclaimed asphalt materials
 
Laboratory investigation of expansive soil stabilized with natural inorganic ...
Laboratory investigation of expansive soil stabilized with natural inorganic ...Laboratory investigation of expansive soil stabilized with natural inorganic ...
Laboratory investigation of expansive soil stabilized with natural inorganic ...
 
Influence of reinforcement on the behavior of hollow concrete block masonry p...
Influence of reinforcement on the behavior of hollow concrete block masonry p...Influence of reinforcement on the behavior of hollow concrete block masonry p...
Influence of reinforcement on the behavior of hollow concrete block masonry p...
 
Influence of compaction energy on soil stabilized with chemical stabilizer
Influence of compaction energy on soil stabilized with chemical stabilizerInfluence of compaction energy on soil stabilized with chemical stabilizer
Influence of compaction energy on soil stabilized with chemical stabilizer
 
Geographical information system (gis) for water resources management
Geographical information system (gis) for water resources managementGeographical information system (gis) for water resources management
Geographical information system (gis) for water resources management
 
Forest type mapping of bidar forest division, karnataka using geoinformatics ...
Forest type mapping of bidar forest division, karnataka using geoinformatics ...Forest type mapping of bidar forest division, karnataka using geoinformatics ...
Forest type mapping of bidar forest division, karnataka using geoinformatics ...
 
Factors influencing compressive strength of geopolymer concrete
Factors influencing compressive strength of geopolymer concreteFactors influencing compressive strength of geopolymer concrete
Factors influencing compressive strength of geopolymer concrete
 
Experimental investigation on circular hollow steel columns in filled with li...
Experimental investigation on circular hollow steel columns in filled with li...Experimental investigation on circular hollow steel columns in filled with li...
Experimental investigation on circular hollow steel columns in filled with li...
 
Experimental behavior of circular hsscfrc filled steel tubular columns under ...
Experimental behavior of circular hsscfrc filled steel tubular columns under ...Experimental behavior of circular hsscfrc filled steel tubular columns under ...
Experimental behavior of circular hsscfrc filled steel tubular columns under ...
 
Evaluation of punching shear in flat slabs
Evaluation of punching shear in flat slabsEvaluation of punching shear in flat slabs
Evaluation of punching shear in flat slabs
 
Evaluation of performance of intake tower dam for recent earthquake in india
Evaluation of performance of intake tower dam for recent earthquake in indiaEvaluation of performance of intake tower dam for recent earthquake in india
Evaluation of performance of intake tower dam for recent earthquake in india
 
Evaluation of operational efficiency of urban road network using travel time ...
Evaluation of operational efficiency of urban road network using travel time ...Evaluation of operational efficiency of urban road network using travel time ...
Evaluation of operational efficiency of urban road network using travel time ...
 
Estimation of surface runoff in nallur amanikere watershed using scs cn method
Estimation of surface runoff in nallur amanikere watershed using scs cn methodEstimation of surface runoff in nallur amanikere watershed using scs cn method
Estimation of surface runoff in nallur amanikere watershed using scs cn method
 
Estimation of morphometric parameters and runoff using rs & gis techniques
Estimation of morphometric parameters and runoff using rs & gis techniquesEstimation of morphometric parameters and runoff using rs & gis techniques
Estimation of morphometric parameters and runoff using rs & gis techniques
 
Effect of variation of plastic hinge length on the results of non linear anal...
Effect of variation of plastic hinge length on the results of non linear anal...Effect of variation of plastic hinge length on the results of non linear anal...
Effect of variation of plastic hinge length on the results of non linear anal...
 
Effect of use of recycled materials on indirect tensile strength of asphalt c...
Effect of use of recycled materials on indirect tensile strength of asphalt c...Effect of use of recycled materials on indirect tensile strength of asphalt c...
Effect of use of recycled materials on indirect tensile strength of asphalt c...
 

Recently uploaded

Introduction-To-Agricultural-Surveillance-Rover.pptx
Introduction-To-Agricultural-Surveillance-Rover.pptxIntroduction-To-Agricultural-Surveillance-Rover.pptx
Introduction-To-Agricultural-Surveillance-Rover.pptxk795866
 
Risk Assessment For Installation of Drainage Pipes.pdf
Risk Assessment For Installation of Drainage Pipes.pdfRisk Assessment For Installation of Drainage Pipes.pdf
Risk Assessment For Installation of Drainage Pipes.pdfROCENODodongVILLACER
 
Study on Air-Water & Water-Water Heat Exchange in a Finned Tube Exchanger
Study on Air-Water & Water-Water Heat Exchange in a Finned Tube ExchangerStudy on Air-Water & Water-Water Heat Exchange in a Finned Tube Exchanger
Study on Air-Water & Water-Water Heat Exchange in a Finned Tube ExchangerAnamika Sarkar
 
Transport layer issues and challenges - Guide
Transport layer issues and challenges - GuideTransport layer issues and challenges - Guide
Transport layer issues and challenges - GuideGOPINATHS437943
 
IVE Industry Focused Event - Defence Sector 2024
IVE Industry Focused Event - Defence Sector 2024IVE Industry Focused Event - Defence Sector 2024
IVE Industry Focused Event - Defence Sector 2024Mark Billinghurst
 
Earthing details of Electrical Substation
Earthing details of Electrical SubstationEarthing details of Electrical Substation
Earthing details of Electrical Substationstephanwindworld
 
Why does (not) Kafka need fsync: Eliminating tail latency spikes caused by fsync
Why does (not) Kafka need fsync: Eliminating tail latency spikes caused by fsyncWhy does (not) Kafka need fsync: Eliminating tail latency spikes caused by fsync
Why does (not) Kafka need fsync: Eliminating tail latency spikes caused by fsyncssuser2ae721
 
Software and Systems Engineering Standards: Verification and Validation of Sy...
Software and Systems Engineering Standards: Verification and Validation of Sy...Software and Systems Engineering Standards: Verification and Validation of Sy...
Software and Systems Engineering Standards: Verification and Validation of Sy...VICTOR MAESTRE RAMIREZ
 
Introduction to Machine Learning Unit-3 for II MECH
Introduction to Machine Learning Unit-3 for II MECHIntroduction to Machine Learning Unit-3 for II MECH
Introduction to Machine Learning Unit-3 for II MECHC Sai Kiran
 
complete construction, environmental and economics information of biomass com...
complete construction, environmental and economics information of biomass com...complete construction, environmental and economics information of biomass com...
complete construction, environmental and economics information of biomass com...asadnawaz62
 
TechTAC® CFD Report Summary: A Comparison of Two Types of Tubing Anchor Catchers
TechTAC® CFD Report Summary: A Comparison of Two Types of Tubing Anchor CatchersTechTAC® CFD Report Summary: A Comparison of Two Types of Tubing Anchor Catchers
TechTAC® CFD Report Summary: A Comparison of Two Types of Tubing Anchor Catcherssdickerson1
 
Call Girls Delhi {Jodhpur} 9711199012 high profile service
Call Girls Delhi {Jodhpur} 9711199012 high profile serviceCall Girls Delhi {Jodhpur} 9711199012 high profile service
Call Girls Delhi {Jodhpur} 9711199012 high profile servicerehmti665
 
computer application and construction management
computer application and construction managementcomputer application and construction management
computer application and construction managementMariconPadriquez1
 
Instrumentation, measurement and control of bio process parameters ( Temperat...
Instrumentation, measurement and control of bio process parameters ( Temperat...Instrumentation, measurement and control of bio process parameters ( Temperat...
Instrumentation, measurement and control of bio process parameters ( Temperat...121011101441
 
Sachpazis Costas: Geotechnical Engineering: A student's Perspective Introduction
Sachpazis Costas: Geotechnical Engineering: A student's Perspective IntroductionSachpazis Costas: Geotechnical Engineering: A student's Perspective Introduction
Sachpazis Costas: Geotechnical Engineering: A student's Perspective IntroductionDr.Costas Sachpazis
 
lifi-technology with integration of IOT.pptx
lifi-technology with integration of IOT.pptxlifi-technology with integration of IOT.pptx
lifi-technology with integration of IOT.pptxsomshekarkn64
 
Oxy acetylene welding presentation note.
Oxy acetylene welding presentation note.Oxy acetylene welding presentation note.
Oxy acetylene welding presentation note.eptoze12
 

Recently uploaded (20)

Introduction-To-Agricultural-Surveillance-Rover.pptx
Introduction-To-Agricultural-Surveillance-Rover.pptxIntroduction-To-Agricultural-Surveillance-Rover.pptx
Introduction-To-Agricultural-Surveillance-Rover.pptx
 
Risk Assessment For Installation of Drainage Pipes.pdf
Risk Assessment For Installation of Drainage Pipes.pdfRisk Assessment For Installation of Drainage Pipes.pdf
Risk Assessment For Installation of Drainage Pipes.pdf
 
Design and analysis of solar grass cutter.pdf
Design and analysis of solar grass cutter.pdfDesign and analysis of solar grass cutter.pdf
Design and analysis of solar grass cutter.pdf
 
Study on Air-Water & Water-Water Heat Exchange in a Finned Tube Exchanger
Study on Air-Water & Water-Water Heat Exchange in a Finned Tube ExchangerStudy on Air-Water & Water-Water Heat Exchange in a Finned Tube Exchanger
Study on Air-Water & Water-Water Heat Exchange in a Finned Tube Exchanger
 
Transport layer issues and challenges - Guide
Transport layer issues and challenges - GuideTransport layer issues and challenges - Guide
Transport layer issues and challenges - Guide
 
IVE Industry Focused Event - Defence Sector 2024
IVE Industry Focused Event - Defence Sector 2024IVE Industry Focused Event - Defence Sector 2024
IVE Industry Focused Event - Defence Sector 2024
 
Earthing details of Electrical Substation
Earthing details of Electrical SubstationEarthing details of Electrical Substation
Earthing details of Electrical Substation
 
Why does (not) Kafka need fsync: Eliminating tail latency spikes caused by fsync
Why does (not) Kafka need fsync: Eliminating tail latency spikes caused by fsyncWhy does (not) Kafka need fsync: Eliminating tail latency spikes caused by fsync
Why does (not) Kafka need fsync: Eliminating tail latency spikes caused by fsync
 
Software and Systems Engineering Standards: Verification and Validation of Sy...
Software and Systems Engineering Standards: Verification and Validation of Sy...Software and Systems Engineering Standards: Verification and Validation of Sy...
Software and Systems Engineering Standards: Verification and Validation of Sy...
 
Introduction to Machine Learning Unit-3 for II MECH
Introduction to Machine Learning Unit-3 for II MECHIntroduction to Machine Learning Unit-3 for II MECH
Introduction to Machine Learning Unit-3 for II MECH
 
complete construction, environmental and economics information of biomass com...
complete construction, environmental and economics information of biomass com...complete construction, environmental and economics information of biomass com...
complete construction, environmental and economics information of biomass com...
 
TechTAC® CFD Report Summary: A Comparison of Two Types of Tubing Anchor Catchers
TechTAC® CFD Report Summary: A Comparison of Two Types of Tubing Anchor CatchersTechTAC® CFD Report Summary: A Comparison of Two Types of Tubing Anchor Catchers
TechTAC® CFD Report Summary: A Comparison of Two Types of Tubing Anchor Catchers
 
Call Girls Delhi {Jodhpur} 9711199012 high profile service
Call Girls Delhi {Jodhpur} 9711199012 high profile serviceCall Girls Delhi {Jodhpur} 9711199012 high profile service
Call Girls Delhi {Jodhpur} 9711199012 high profile service
 
computer application and construction management
computer application and construction managementcomputer application and construction management
computer application and construction management
 
Instrumentation, measurement and control of bio process parameters ( Temperat...
Instrumentation, measurement and control of bio process parameters ( Temperat...Instrumentation, measurement and control of bio process parameters ( Temperat...
Instrumentation, measurement and control of bio process parameters ( Temperat...
 
young call girls in Rajiv Chowk🔝 9953056974 🔝 Delhi escort Service
young call girls in Rajiv Chowk🔝 9953056974 🔝 Delhi escort Serviceyoung call girls in Rajiv Chowk🔝 9953056974 🔝 Delhi escort Service
young call girls in Rajiv Chowk🔝 9953056974 🔝 Delhi escort Service
 
Sachpazis Costas: Geotechnical Engineering: A student's Perspective Introduction
Sachpazis Costas: Geotechnical Engineering: A student's Perspective IntroductionSachpazis Costas: Geotechnical Engineering: A student's Perspective Introduction
Sachpazis Costas: Geotechnical Engineering: A student's Perspective Introduction
 
lifi-technology with integration of IOT.pptx
lifi-technology with integration of IOT.pptxlifi-technology with integration of IOT.pptx
lifi-technology with integration of IOT.pptx
 
Oxy acetylene welding presentation note.
Oxy acetylene welding presentation note.Oxy acetylene welding presentation note.
Oxy acetylene welding presentation note.
 
9953056974 Call Girls In South Ex, Escorts (Delhi) NCR.pdf
9953056974 Call Girls In South Ex, Escorts (Delhi) NCR.pdf9953056974 Call Girls In South Ex, Escorts (Delhi) NCR.pdf
9953056974 Call Girls In South Ex, Escorts (Delhi) NCR.pdf
 

Treatment of distilleries and breweries spent wash wastewater

  • 1. IJRET: International Journal of Research in Engineering and Technology eISSN: 2319-1163 | pISSN: 2321-7308 __________________________________________________________________________________________ Volume: 03 Issue: 02 | Feb-2014, Available @ http://www.ijret.org 204 TREATMENT OF DISTILLERIES AND BREWERIES SPENT WASH WASTEWATER Sohail Ayub1 , Shoebuddin Usmani2 1 Associate Professor, Civil Engg. Dept. Aligarh Muslim University (AMU), Aligarh 2 Assistant Professor CED, Integral University, Lucknow Abstract The distillery sector is one of the seventeen categories of major polluting industries in India. These units generate large volume of dark brown colored wastewater, which is known as “spent wash”. Liquid wastes from breweries and distilleries possess a characteristically high pollution load and have continued to pose a critical problem of environmental pollution in many countries. The principal pollution effects of the wastewaters of these fermentation industries on a water course are multiple in natures. An attempt has been made to high light the treatment of distillery spent wash by using natural adsorbent. The results obtained herein indicate the feasibility of activated carbon used as an adsorbent for removal of pollutants from distillery spent wash. The results show the significant amount of reduction of pollutants by activated carbon. The study concluded that adsorbent dosage, contact time and effluent dilutions all the three are important parameters affecting the pollutants removal by adsorption. Keywords: Distillery waste water, treatment, activated carbon ----------------------------------------------------------------------***----------------------------------------------------------------------- 1. INTRODUCTION 1.1 The Need for Treating Distillery Effluent The distillery sector is one of the seventeen categories of major polluting industries in India. These units generate large volume of dark brown coloured wastewater, which is known as “spent wash”. (MoEF).Liquid wastes from breweries and distilleries possess a characteristically high pollution load and have continued to pose a critical problem of environmental pollution in many countries. The principal pollution effects of the wastewaters of these fermentation industries on a water course are multiple in natures. High temperature of the wastewaters may instantaneously kill fish and other aquatic organisms, thus destroying the flora and fauna of a river, when the wastewaters are discharged into it. The most damaging effect of the wastewaters of the fermentation industries, especially distillery, on a stream is caused by high concentration of readily decomposable organic matters present in the waste waters. Due to decomposition of soluble and suspended organic matters present in the wastewaters, high BOD (Biochemical Oxygen Demand) and COD (Chemical Oxygen Demand) of the wastewaters results, causing rapid depletion of the oxygen content of the water, thus creating a foul smell. This further promotes growth of nuisance organisms and can render the stream totally unfit for propagating fish life and for the purpose of drinking, personal hygiene, recreation and other purposes. The distillery effluents, when drained into a water source, make it susceptible for the propagation of harmful microbes. Thus creating serious biological hazards like the generation and propagation of the water borne diseases. This required that the effluents of the distillery are either treated or utilized profitably. 2. IMPACT OF DISTILLERY EFFLUENT ON ENVIRONMENT Following are the impacts of distillery effluent on environment.  Discharge of wastewater with high TDS would have adverse impact on aquatic life and to make unsuitable water for drinking purpose, if used for irrigation reduce the crop yield ,corrosion in water system and pipe line.  Suspended solids in wastewater reduce the light penetration and plant production as a result in receiving water by increasing turbidity it can also clog the fish gills.  High amount of BOD in the wastewater leads to the decomposition of organic matter under the anaerobic condition that produces highly objectionable products including Methane (CH4), Ammonia (NH3), and Hydrogen Sulphide (H2S) gas.  Low Dissolved Oxygen (DO) in water bodies affect the aquatic life as DO drops fish and other species are threatened and may get killed.  Fall in DO levels causes undesirable odours, tastes and reduce the acceptability of water for domestic purpose.  In steam generation, DO is one of the most important factors causing corrosion of the boiler material.
  • 2. IJRET: International Journal of Research in Engineering and Technology eISSN: 2319-1163 | pISSN: 2321-7308 __________________________________________________________________________________________ Volume: 03 Issue: 02 | Feb-2014, Available @ http://www.ijret.org 205  Generally, industrial wastewater changes pH level of the receiving water body. Such changes can affect ecological aquatic system; excessive acidity particularly can result in release of hydrogen sulphide (H2S) to air.  Alkaline nature of wastewater causes declination in plant growth and crop growth.  Colour and odour of the effluent of distillery was red brown in colour with unpleasant odour of Indol, Sketol and other sulphur compounds.  Spent wash is a complex, multi component stream that is known to cause considerable fouling. 3. ADSORPTION FOR DISTILLERY WASTEWATER TREATMENT Adsorption of an adsorbent from a solution is caused by physical and chemical forces. The physical background is produced mainly by Van Der Waals and electrostatic forces, between an adsorbate and the atoms conforming the adsorbate surface. Chemical adsorption generally involves electron transfer between solid and liquid phases. Adsorption from solutions occurs because of differences in concentration (activities) in solution, and in the carbon pores. The adsorption process comprehends four steps. Three of these steps involve diffusion and the fourth one is adsorption:  The molecule to be removed migrates from the bulk of the solution to the liquid layer surrounding the AC particle.  The material has to migrate through the surface film to reach the outer surface of the carbon.  Then, it must diffuse into the pores.  Finally, the material will be adsorbed deep in the micropore region of the activated carbon.  The experimental methodology adopted in the present study. It includes adsorption to evaluate the pollutants from distillery spent wash (wastewater). Activated carbon has been used as an adsorbent for the removal of COD, TDS, pH, DO. 3.1 Sampling Location The water samples were brought from the industry “Wave distilleries and breweries private limited” located at village Ahmadpura, kali nadi, harduagunj, 16 km from Aligarh and analyzed for different parameters in the environmental engineering laboratory of civil engineering department, Z.H.C.E.T, Aligarh Muslim University, Aligarh, Uttar Pradesh, India. Dark plastic bottles of 2 liters capacity each with a stopper were used for collecting samples. Each bottle was washed with 2% nitric acid and then rinsed three times with distilled water. The bottles were then preserved in a clean place. The bottles were filled leaving no air space, and then the bottle was sealed to prevent any leakage and stored in a cool place. Each container was clearly marked with the name, location and date of sampling. 3.2 Sample Characteristics The sample was collected directly from distillery effluent outlet pipe which is discharging the effluent into Kali nadi. Sample which was collected is colour less giving an unpleasant smell of like burnt sugar the temperature of the sample is high around 30° C. 3.3 Preparation of Sample Dilutions In order to check the effect of different dilutions of spent wash on removal efficiency of different pollutants and different type of heavy metals from the wastewater the spent wash has been diluted to three different dilutions i.e. 25% of sample, 50% of sample and 100% pure sample. Each dilution sample of 600ml quantity has been prepared taking 25% and 50% sample and diluting it to 600 ml with distilled water. Third sample is pure spent wash of 600 ml quantity. 4. EXPERIMENTAL WORK AND ANALYSIS Experiment consists of adsorption carried out with different adsorbent dosage and contact time with the three different dilutions of sample as shown in Table1. Adsorbent dosage of 2g, 5g, and 10g with the corresponding contact time of 6hr, 12hr and 24hr for each sample was used with each dilution. Each diluted sample of 600ml quantity is divided into three parts of 200ml quantity each. There are total nine samples three from each diluted sample of 200ml quantity each. Each concentrations each sample is taken in a volumetric flask of 250ml and added with a desired adsorbent dose. Each flask was shaken for one hour and the samples was filtered and collected for analysis after desired contact time. Whole adsorption test was performed at room temperature. Table 1 Showing varying adsorbent dose with contact time at different dilutions Sample no. 25% dilution Sample no. 50% dilution Sample no. 100% sample Ad(g) Ct(hr) Ad(g) Ct(hr) Ad(g) Ct(hr) 1 1 6 1 1 6 1 1 6 2 5 12 2 5 12 2 5 12 3 10 24 3 10 24 3 10 24 Ad: adsorbent dose (gram) Ct: contact time (hour)
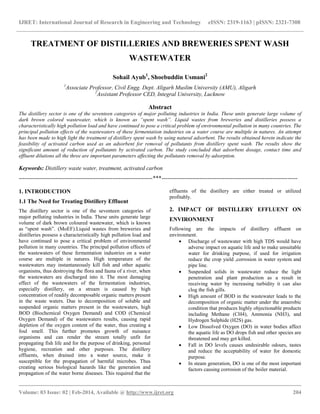
  • 3. IJRET: International Journal of Research in Engineering and Technology eISSN: 2319-1163 | pISSN: 2321-7308 __________________________________________________________________________________________ Volume: 03 Issue: 02 | Feb-2014, Available @ http://www.ijret.org 206 4.1 ANALYSIS OF SPENT WASH BEFORE ADSORPTION Following are the parameters in a tabular form (Table 2) which were analyzed initially i.e. before adsorption for the three dilutions of 25%, 50% and 100% pure sample and with different adsorbent dose and contact time. Table 2: Showing parameter analyzed before adsorption. Parameters For 25% sample dilution For 50% sample dilution For 100% pure sample pH 5.4 5.99 4.29 COD(mg/l) 1200 2560 3200 TDS(mg/l) 361 491 675 DO(mg/l) 3.0 1.7 1.2 5. RESULTS AND DISCUSSION 5.1 Graphs after Adsorption The following graphs will give better illustration of the results obtained following the analysis of spent wash. Here the results obtained are graphically represented for various wastewater quality parameters. For 25% Effluent Dilution Fig 1: variation of COD with adsorbent dose and contact time In Figure 1 COD decreases with increase in adsorbent dose up to 10gm and contact time of 24hr and then attains a constant value with increase in adsorbent dose and contact time. The maximum percent removal 93.33% has been observed at an adsorbent dose of 10gm/200ml, contact time of 24hr with 25% diluted sample. The result can also be summarized in Table 3. 1200 480 160 80 0 6 12 18 24 30 0 200 400 600 800 1000 1200 1400 0 1 2 3 4 5 6 7 8 9 10 11 Contacttime(hr) COD(mg/l) Adsorbent dose (grm) variation of COD with adsorbent dose and contact time COD contact time
  • 4. IJRET: International Journal of Research in Engineering and Technology eISSN: 2319-1163 | pISSN: 2321-7308 __________________________________________________________________________________________ Volume: 03 Issue: 02 | Feb-2014, Available @ http://www.ijret.org 207 Fig 2: Variation of TDS with adsorbent dose and contact time In Figure 2 TDS decreases with increase in adsorbent dose up to 10gm and contact time of 24hr. The maximum percent removal 70.6% has been observed at an adsorbent dose of 10gm/200ml, contact time of 24hr with 25% diluted sample. Fig 3: Variation of pH with adsorbent dose and contact time In Figure 3 pH increases with increase in adsorbent dose up to 2gm and contact time of 6hr and then decreases with increase in adsorbent dose and contact time. The maximum percent removal 25.31% has been observed at an adsorbent dose of 2gm/200ml and contact time of 6hr with 25% diluted sample. 361 276 210 106 0 6 12 18 24 30 0 50 100 150 200 250 300 350 400 0 1 2 3 4 5 6 7 8 9 10 11 Contacttime(hr) TDS(mg/l) Adsorbent dose (grm) Variation of TDS with adsorbent dose and contact time TDS contact time 5.4 7.23 6.87 6.75 0 6 12 18 24 30 0 2 4 6 8 0 2 4 6 8 10 12 Contacttime(hr) pH Adsorbent dose (grm) Variation of pH with adsorbent dose and contact time Ph contact time
  • 5. IJRET: International Journal of Research in Engineering and Technology eISSN: 2319-1163 | pISSN: 2321-7308 __________________________________________________________________________________________ Volume: 03 Issue: 02 | Feb-2014, Available @ http://www.ijret.org 208 Fig 4: Variation of DO with adsorbent dose and contact time In Figure 4 DO increases up to a maximum value of 9.2 with increase in adsorbent dose up to 10gm and contact time of 24hr. The maximum percent removal 67.39% has been observed at an adsorbent dose of 10gm/200ml, contact time of 24hr with 25% diluted sample. For 50% Effluent Dilution Fig 5: Variation of DO with adsorbent dose and contact time In Figure 5 DO increases up to a maximum value of 8.5 with increase in adsorbent dose up to 10gm and contact time of 24hr. The maximum percent removal 80% has been observed at an adsorbent dose of 10gm/200ml, contact time of 24hr with 50% diluted sample. The result can also be summarized in Table 4. 3 4.9 6.3 9.2 0 6 12 18 24 30 0 2 4 6 8 10 0 2 4 6 8 10 12 Contacttime(hr) DO(mg/l) Adsorbent dose (grm) variation of DO with adsorbent dose and contact time DO contact time 1.7 2.76 4.6 8.5 0 6 12 18 24 30 0 1 2 3 4 5 6 7 8 9 0 2 4 6 8 10 12 Contacttime(hr) DO(mg/l) Adsorbent dose (grm) Variation of DO with adsorbent dose and contact time DO contact time
  • 6. IJRET: International Journal of Research in Engineering and Technology eISSN: 2319-1163 | pISSN: 2321-7308 __________________________________________________________________________________________ Volume: 03 Issue: 02 | Feb-2014, Available @ http://www.ijret.org 209 Fig 6: Variation of pH with adsorbent dose and contact time In figure 6 pH increases with increase in adsorbent dose up to 5gm and contact time of 12hr and then decreases with increase in adsorbent dose and contact time. The maximum percent removal 20.13% has been observed at an adsorbent dose of 5gm/200ml, contact time of 12hr with 50% diluted sample. Fig 7: Variation of COD with adsorbent dose and contact time In Figure 7 COD decreases with increase in adsorbent dose up to 10gm and contact time of 24hr and then attains a constant value with increase in adsorbent dose and contact time. The maximum percent removal 75% has been observed at an adsorbent dose of 10gm/200ml, contact time of 24hr with 50% diluted sample. 5.99 6.95 7.5 6.75 0 6 12 18 24 30 0 1 2 3 4 5 6 7 8 0 1 2 3 4 5 6 7 8 9 10 11 Contacttime(hr) pH Adsorbent dose (grm) Variation of pH with adsorbent dose and contact time Ph contact time 2560 1920 960 640 0 6 12 18 24 30 0 500 1000 1500 2000 2500 3000 0 2 4 6 8 10 12 Contacttime(hr) COD(mg/l) Adsorbent dose (grm) Variation of COD with adsorbent dose and contact time COD contact time
  • 7. IJRET: International Journal of Research in Engineering and Technology eISSN: 2319-1163 | pISSN: 2321-7308 __________________________________________________________________________________________ Volume: 03 Issue: 02 | Feb-2014, Available @ http://www.ijret.org 210 Fig 8: Variation of TDS with adsorbent dose and contact time In Figure 8 TDS increases with increase in adsorbent dose up to 2gm and contact time of 6hr and then decreases with increase in adsorbent dose and contact time. The maximum percent removal 45.21% has been observed at an adsorbent dose of 10gm/200ml, contact time of 24hr with 50% diluted sample. For 100% Effluent Dilution Fig 9: Variation of pH with adsorbent dose and contact time In Figure 9 pH increases with increase in adsorbent dose up to 5gm and contact time of 12hr and then there is not much effect with increase in adsorbent dose and contact time. The maximum percent removal 42.95% has been observed at an adsorbent dose of 10gm/200ml, contact time of 24hr with 100% pure sample. The result can also be summarized in Table 5. 491 675 308 269 0 6 12 18 24 30 0 100 200 300 400 500 600 700 800 0 2 4 6 8 10 12 Contacttime(hr) TDS(mg/l) Adsorbent dose (grm) Variation of TDS with adsorbent dose and contact time TDS contact time 4.29 6.47 7.41 7.52 0 6 12 18 24 30 0 1 2 3 4 5 6 7 8 0 1 2 3 4 5 6 7 8 9 10 11 Contacttime(hr) pH Adsorbent dose (grm) Variation of pH with adsorbent dose and contact time Ph contact time
  • 8. IJRET: International Journal of Research in Engineering and Technology eISSN: 2319-1163 | pISSN: 2321-7308 __________________________________________________________________________________________ Volume: 03 Issue: 02 | Feb-2014, Available @ http://www.ijret.org 211 Fig 10: variation of COD with adsorbent dose and contact time In Figure 10 COD decreases with increase in adsorbent dose up to 10gm and contact time of 24hr and then attains a constant value with increase in adsorbent dose and contact time. The maximum percent removal 40% has been observed at an adsorbent dose of 10gm/200ml, contact time of 24hr with 100% diluted sample. Fig 11: variation of TDS with adsorbent dose and contact time In Figure 11 TDS decreases with increase in adsorbent dose up to 10gm and contact time of 24hr and then attains a constant value with increase in adsorbent dose and contact time. The maximum percent removal 39.85% has been observed at an adsorbent dose of 10gm/200ml, contact time of 24hr with 100% diluted sample. 3200 2560 2240 1920 0 6 12 18 24 30 0 500 1000 1500 2000 2500 3000 3500 0 2 4 6 8 10 12 Contacttime(hr) COD(mg/l) Adsorbent dose (grm) Variation of COD with adsorbent dose and contact time COD contact time 675 561 535 406 0 6 12 18 24 30 0 100 200 300 400 500 600 700 800 0 2 4 6 8 10 12 Contacttime(hr) TDS(mg/l) Adsorbent dose (grm) Variation of TDS with adsorbent dose and contact time TDS contact time
  • 9. IJRET: International Journal of Research in Engineering and Technology eISSN: 2319-1163 | pISSN: 2321-7308 __________________________________________________________________________________________ Volume: 03 Issue: 02 | Feb-2014, Available @ http://www.ijret.org 212 Fig 12: Variation of DO with adsorbent dose and contact time In Figure 12 DO increases up to a maximum value of 7.9 with increase in adsorbent dose up to 10gm and contact time of 24hr. The maximum percent removal 84.8% has been observed at an adsorbent dose of 10gm/200ml, contact time of 24hr with 100% diluted sample. Table 3: Results analyzed from graphs for 25% sample dilution after adsorption Parameters For 25% effluent dilution Initial concentration Final concentration after Removal(%) after 6hr 12hr 24hr 6hr 12hr 24hr pH 5.4 7.23 6.87 6.75 25.31 21.39 20 COD(mg) 1200 480 160 80 60 86.66 93.33 TDS(mg/) 361 276 210 106 23.54 41.82 70.6 DO(mg/l) 3.0 4.9 6.3 9.2 38.77 52.38 67.39 Table 4: Results analyzed from graphs for 50% sample dilution after adsorption Parameters For 50% effluent dilution Initial concentration Final concentration after Removal(%) after 6hr 12hr 24hr 6hr 12hr 24hr pH 5.99 6.95 7.5 6.75 13.81 20.13 11.25 COD(mg/l) 2560 1920 960 640 25 62.5 75 TDS(mg/l) 491 675 308 269 27.25 37.27 45.21 DO(mg/l) 1.7 2.76 4.6 8.5 38.4 63.04 80 1.2 1.9 3.4 7.9 0 6 12 18 24 30 0 2 4 6 8 10 0 2 4 6 8 10 12 Contacttime(hr) DO(mg/l) Adsorbent dose (grm) Variation of DO with adsorbent dose and contact time DO contact time
  • 10. IJRET: International Journal of Research in Engineering and Technology eISSN: 2319-1163 | pISSN: 2321-7308 __________________________________________________________________________________________ Volume: 03 Issue: 02 | Feb-2014, Available @ http://www.ijret.org 213 Table5: Results analyzed from graphs for 100% pure sample after adsorption Parameters For 100% sample Initial concentration Final concentration after Removal(%) after 6hr 12hr 24hr 6hr 12hr 24hr pH 4.29 6.47 7.41 7.52 33.69 42.10 42.9 COD(mg/l) 3200 2560 2240 1920 20 30 40 TDS(mg/l) 675 561 535 406 16.88 20.74 39.8 DO(mg/l) 1.2 1.9 3.4 7.9 36.84 64.70 84.8 5.2 Discussion The results which are obtained after treatment of distillery spent wash most of which are within the permissible limits. The characteristic of spent wash do not allow its discharge into a water body, hence it requires treatment. Biological treatment, especially with pure cultures, appears promising and possibly cost-effective for color removal; however, the initiatives are mainly confined to laboratory trials. Adsorbents like activated carbon that result in almost complete decolourisation are not cost effective for treating the enormous volumes of spent wash typically generated in a distillery. Thus, there is scope for examining low cost adsorbents, including wastes generated in other industrial processes / operations. The production of distillery must be incorporated in the design to accommodate the increased amount of effluent. Extensive research has been conceded out on healing of distillery wastes in many parts of the world. Effluent in an organic nutrient solution, it has a wide spectrum of utility. There have been some attempts to use spent wash as substrate for yeast growth or for biochemical production. Table 6: Final results in a tabular form Pollutants Sample Dilution% Adsorbent dose (gram) Contact time (hr) % Removal pH 100% 10 24 42.95 COD 25% 10 24 93.33 TDS 25% 10 24 70.6 DO 100% 10 24 84.8 6. BASED ON THE EXPERIMENTS PERFORMED, THE FOLLOWING CONCLUSIONS ARE DRAWN 1. The activated carbon is found to be effective adsorbent. 2. It has been observed that adsorbent dose of 10 gram and contact time of 24 hr for 200ml of sample is found to be most effective for different dilutions for removal of most pollutants. 3. While for removal of heavy metals, adsorbent dose of 5 gram and contact time of 12 hr found to be most effective. 4. On increasing the adsorbent dose and contact time after this limit there is not much effect on the removal of pollutants and heavy metals. 5. This is because of the adsorptive capacity of the adsorbent is reached to an end. 6. The adsorbent dosage, pH, contact time and initial concentration of organic matter have significant effect on the COD removal and dissolved oxygen. 7. The maximum removal (42.95%) of pH has been observed at 10gm/200ml of adsorbent dose and a contact time of 24hr for 100% pure sample. 8. The maximum removal (93.33%) of COD has been observed at 10gm/200ml of adsorbent dose and a contact time of 24hr for 25% diluted sample. 9. The maximum removal (70.6%) of TDS has been observed at 10gm/200ml of adsorbent dose and a contact time of 24hr for 25% diluted sample. 10. The maximum removal (84.8%) of DO has been observed at 10gm/200ml of adsorbent dose and a contact time of 24hr for 100% pure sample. 11. It is also found that there is a certain limit for increasing the adsorbent doses for given amount of effluent. This has to be carefully controlled. An excess use can leads to uneconomical process. The initial
  • 11. IJRET: International Journal of Research in Engineering and Technology eISSN: 2319-1163 | pISSN: 2321-7308 __________________________________________________________________________________________ Volume: 03 Issue: 02 | Feb-2014, Available @ http://www.ijret.org 214 concentration plays an important role throughout the adsorption. 12. Regeneration and disposal depends on the amount and the availability of the adsorbent. REFERENCES [1] Sunil J. Kulkarni, Suhas V Patil, and Y. P. Bhalerao “Fly ash adsorption studies for organic matter removal accompanying increase in dissolved oxygen”. [2] Vernon L. Snoeyink, Ph.D. & R. Scott Summers, Ph.D. “adsorption of organic compounds”. [3] European business and technology centre: European Union: association of European chambers of commerce and industry. [4] J.S. Kamyotra and R.M. Bhardwaj “Municipal wastewater management in India”. [5] Milind R.Gidde, Julie Dutta', Snehal Jadhav “Comparative adsorption studies on activated rice husk and rice husk ash by using methylene blue as dye”. [6] Technologies for the treatment of molasses based distillery effluents. [7] Technical EIA guidance manual for distilleries. [8] Keith R. du Plessis “Community-level analysis of the microbiology in constructed wetlands treating distillery effluent”. [9] Lt Col Mantha Nagaraj, Dr Arvind Kumar “distillery wastewater treatment and disposal”. [10] Z.V.P. murthy, L.B. chaudhari “Treatment of distillery spent wash by combined UF AND RO process”. [11] Namita Tewari, V K Verma and J P N Rai “Comparative evaluation of natural adsorbent for pollutants removal from distillery spent wash” [12] Dinesh Mohan, Charles U. Pittman Jr. “Arsenic removal from water/wastewater using adsorbents—A critical review”. [13] Sunil J. Kulkarni, Suhas V Patil, and Y. P. Bhalerao “Flyash adsorption studies for organic Matter Removal Accompanying Increase in dissolved oxygen” [14] Mojtaba Hadavifar, Habibollah Younesi, Aliakbar Zinatizadeh “Application of ozone and granular activated carbon for distillery effluent treatment”. [15] Bhise R.M., Patil A.A., Raskar A.R., Patil P.J. and Deshpande D.P. “Removal of colour of spent wash by activated charcoal adsorption and electro coagulation”. [16] Pawar Avinash Shivajirao “Treatment of distillery waste water using membrane technology”. [17] Sandeep K. Pandey, Anil K. Gupta, M. Yunus “Physico-chemical analysis of treated distillery effluent irrigation responses on crop plants pea (Pisum sativum) and wheat (Triticum aestivum)”. [18] Gupta, Sunil Kumara, Gupta, S. K.b, Singh, Gurdeep “Biodegradation of distillery spent wash in anaerobic hybrid reactor”. [19] C.B. Shivayogimath, T.K. Ramanujam “Treatment of distillery spent wash by hybrid UASB reactor”. [20] Parmesh Kumar Chaudhari, Indra Mani Mishra, Shri Chand “Decolourization and removal of chemical oxygen demand (COD) with energy recovery Treatment of biodigester effluent of a molasses-based alcohol distillery using inorganic coagulants”. [21] Y. Satyawali, M. Balakrishnan “Wastewater treatment in molasses-based alcohol distilleries for COD and colour removal”. [22] Deepak Pant a, Alok Adholeya “Biological approaches for treatment of distillery wastewater”. [23] William Camargo N. “Evaluation of Activated Carbon for Treating Heavy Metals in Aquaculture”. [24] S.N. Pandey, B.D. Nautiyal and C.P. Sharma “Pollution level in distillery effluent and its phototoxic effect on seed germination and early growth of maize and rice”. [25] Xolisa Lorraine Melamane 2006 “treatment of wine distillery wastewaters by high rate anaerobic digestion and submerged membrane systems” [26] Technology information, forecasting and assessment council: department of science and technology govt. of India. [27] P j strong “fungal remediation of distillery and winery wastewater”. [28] K. Vasanth Kumar, K. Subanandam, V. Ramamurthi and S. Sivanesan “solid liquid adsorption for wastewater treatment: principle design and operation”.