1. Updated Discipline Data for 2009-2010; 2010-2011
Data Highlighted in yellow has changed since February 2012
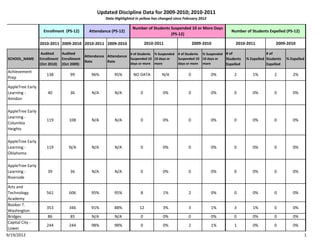
Enrollment (PS-12)
Attendance (PS-12)
Number of Students Suspended 10 or More Days
(PS-12)
2010-2011
2010-2011 2009-2010 2010-2011 2009-2010
SCHOOL_NAME
Audited
Audited
Enrollment Enrollment
(Oct 2010) (Oct 2009)
# of Students
% Suspended
Attendance Attendance
Suspended 10 10 days or
Rate
Rate
days or more more
2009-2010
Number of Students Expelled (PS-12)
2010-2011
# of Students % Suspended # of
Suspended 10 10 days or
Students
days or more more
Expelled
2009-2010
# of
% Expelled Students
Expelled
% Expelled
Achievement
Prep
138
99
96%
95%
NO DATA
N/A
0
0%
2
1%
2
2%
AppleTree Early
Learning Amidon
40
36
N/A
N/A
0
0%
0
0%
0
0%
0
0%
AppleTree Early
Learning Columbia
Heights
119
108
N/A
N/A
0
0%
0
0%
0
0%
0
0%
AppleTree Early
Learning Oklahoma
119
N/A
N/A
N/A
0
0%
0
0%
0
0%
0
0%
AppleTree Early
Learning Riverside
39
36
N/A
N/A
0
0%
0
0%
0
0%
0
0%
561
606
95%
95%
8
1%
2
0%
0
0%
0
0%
353
346
91%
88%
12
3%
3
1%
3
1%
0
0%
86
85
N/A
N/A
0
0%
0
0%
0
0%
0
0%
244
244
98%
98%
0
0%
2
1%
1
0%
0
0%
Arts and
Technology
Academy
Booker T.
Washington
Bridges
Capital City Lower
9/19/2012
1
2. Updated Discipline Data for 2009-2010; 2010-2011
Data Highlighted in yellow has changed since February 2012
Enrollment (PS-12)
Attendance (PS-12)
Number of Students Suspended 10 or More Days
(PS-12)
2010-2011
2010-2011 2009-2010 2010-2011 2009-2010
SCHOOL_NAME
Capital City Upper
Carlos Rosario
International
Center City Brightwood
Center City Capitol Hill
Center City Congress
Heights
Center City Petworth
Center City Shaw
Center City Trinidad
Cesar Chavez Bruce Prep
Cesar Chavez Capitol Hill
Cesar Chavez Parkside
Community
Academy - Amos
I
9/19/2012
Audited
Audited
Enrollment Enrollment
(Oct 2010) (Oct 2009)
# of Students
% Suspended
Attendance Attendance
Suspended 10 10 days or
Rate
Rate
days or more more
2009-2010
Number of Students Expelled (PS-12)
2010-2011
# of Students % Suspended # of
Suspended 10 10 days or
Students
days or more more
Expelled
2009-2010
# of
% Expelled Students
Expelled
% Expelled
294
181
96%
95%
2
1%
2
1%
4
1%
7
4%
1751
1659
N/A
N/A
NO DATA
N/A
NO DATA
N/A
NO DATA
N/A
NO DATA
N/A
209
202
96%
93%
0
0%
0
0%
1
0%
0
0%
216
202
96%
93%
0
0%
0
0%
0
0%
0
0%
199
185
90%
93%
8
4%
0
0%
1
1%
2
1%
227
224
97%
94%
0
0%
0
0%
0
0%
0
0%
221
206
96%
94%
0
0%
0
0%
2
1%
1
0%
228
198
95%
95%
0
0%
0
0%
0
0%
0
0%
302
231
94%
96%
15
5%
3
1%
8
3%
5
2%
411
427
91%
90%
19
5%
16
4%
5
713
725
93%
89%
27
4%
46
6%
444
447
95%
93%
0
0%
0
0%
down from 3%
1%
8
13
2%
17
0
0%
1
up from 0%
2%
2%
down from 2%
0%
2
3. Updated Discipline Data for 2009-2010; 2010-2011
Data Highlighted in yellow has changed since February 2012
Enrollment (PS-12)
Attendance (PS-12)
Number of Students Suspended 10 or More Days
(PS-12)
2010-2011
2010-2011 2009-2010 2010-2011 2009-2010
SCHOOL_NAME
Community
Academy - Amos
II
Community
Academy - Amos
III
Community
Academy Butler
Community
Academy Online Program
Community
Academy - Rand
D.C. Bilingual
D.C. Prep Benning
D.C. Prep Edgewood
Elementary
D.C. Prep Edgewood
Middle
E.L. Haynes Georgia Ave
E.L. Haynes Kansas Ave
9/19/2012
Audited
Audited
Enrollment Enrollment
(Oct 2010) (Oct 2009)
# of Students
% Suspended
Attendance Attendance
Suspended 10 10 days or
Rate
Rate
days or more more
2009-2010
Number of Students Expelled (PS-12)
2010-2011
# of Students % Suspended # of
Suspended 10 10 days or
Students
days or more more
Expelled
2009-2010
# of
% Expelled Students
Expelled
% Expelled
148
146
92%
93%
0
0%
0
0%
0
0%
0
0%
499
418
90%
89%
7
1%
14
3%
3
1%
1
0%
258
215
96%
95%
0
0%
0
0%
0
0%
0
0%
124
110
97%
98%
0
0%
0
0%
0
0%
0
0%
321
243
92%
89%
0
0%
0
0%
0
0%
0
0%
354
366
95%
95%
0
0%
0
0%
0
0%
0
0%
258
204
96%
92%
0
0%
0
0%
0
0%
0
0%
400
393
94%
94%
0
0%
0
0%
4
1%
0
0%
251
248
97%
96%
0
0%
0
0%
0
0%
0
0%
326
460
97%
97%
0
0%
4
1%
0
0%
1
0%
280
N/A
96%
N/A
0
0%
N/A
N/A
0
0%
N/A
N/A
3
4. Updated Discipline Data for 2009-2010; 2010-2011
Data Highlighted in yellow has changed since February 2012
Enrollment (PS-12)
Attendance (PS-12)
Number of Students Suspended 10 or More Days
(PS-12)
2010-2011
2010-2011 2009-2010 2010-2011 2009-2010
SCHOOL_NAME
Eagle Academy M Street
Eagle Academy New Jersey Ave
Early Childhood
Academy Johenning
Early Childhood
Academy Walter
Washington
Education
Strengthen
Families
Elsie Whitlow
Stokes
Community
Freedom
Excel Academy
Excel Academy
Friendship Blow-Pierce
Friendship Chamberlain
Friendship Collegiate
Woodson
9/19/2012
Audited
Audited
Enrollment Enrollment
(Oct 2010) (Oct 2009)
# of Students
% Suspended
Attendance Attendance
Suspended 10 10 days or
Rate
Rate
days or more more
2009-2010
Number of Students Expelled (PS-12)
2010-2011
# of Students % Suspended # of
Suspended 10 10 days or
Students
days or more more
Expelled
2009-2010
# of
% Expelled Students
Expelled
% Expelled
416
441
100%
98%
0
0%
0
0%
0
0%
0
0%
106
N/A
100%
N/A
0
0%
N/A
N/A
0
0%
N/A
N/A
227
225
94%
90%
0
0%
0
0%
0
0%
0
0%
225
N/A
N/A
0
0%
0
0%
0
0%
0
0%
239
226
N/A
N/A
0
0%
0
0%
0
0%
0
0%
350
326
98%
95%
0
0%
0
0%
0
0%
0
0%
328
328
712
712
81%
81%
89%
89%
0
0
0%
0%
0
0
0%
0%
0
0
0%
0%
2
2
0%
0%
677
511
91%
93%
12
2%
20
4%
4
1%
3
756
743
96%
96%
25
3%
17
2%
4
1%
0
1219
96%
93%
82
7%
down from 8%
down from 8%
down from 14%
1231
down from 7%
26
2%
68
6%
down from 4%
1%
0%
down from 6%
31
3%
4
5. Updated Discipline Data for 2009-2010; 2010-2011
Data Highlighted in yellow has changed since February 2012
Enrollment (PS-12)
Attendance (PS-12)
Number of Students Suspended 10 or More Days
(PS-12)
2010-2011
2010-2011 2009-2010 2010-2011 2009-2010
SCHOOL_NAME
Friendship Southeast
Academy
Friendship Tech Prep
Friendship Woodridge
Hope
Community Lamond
Hope
Community Tolson
Hospitality
Howard Road
Academy - Main
Howard Road
Academy - MLK
Middle
Howard Road
Academy - Penn
Ave
Howard
University Math
and Science
IDEA
9/19/2012
Audited
Audited
Enrollment Enrollment
(Oct 2010) (Oct 2009)
# of Students
% Suspended
Attendance Attendance
Suspended 10 10 days or
Rate
Rate
days or more more
0%
2009-2010
Number of Students Expelled (PS-12)
2010-2011
# of Students % Suspended # of
Suspended 10 10 days or
Students
days or more more
Expelled
551
503
95%
94%
1
3
241
148
93%
90%
41
17%
32
523
542
95%
94%
5
1%
363
262
87%
84%
0
415
400
92%
94%
154
174
91%
536
562
128
# of
% Expelled Students
Expelled
% Expelled
0
0%
0
0%
22%
3
1%
2
1%
7
1%
6
1%
1
0%
0%
0
0%
0
0%
0
0%
0
0%
0
0%
0
0%
0
0%
90%
0
0%
0
0%
1
1%
0
0%
92%
92%
6
1%
2
0%
1
0%
0
0%
84
93%
85%
5
4%
0
0%
0
0%
0
0%
134
293
91%
96%
0
0%
0
0%
0
0%
0
0%
296
285
96%
97%
1
0%
0
0%
7
1%
0
0%
389
468
91%
87%
6
2%
9
2%
2
1%
0
0%
new data
1%
2009-2010
down from 35%
5
6. Updated Discipline Data for 2009-2010; 2010-2011
Data Highlighted in yellow has changed since February 2012
Enrollment (PS-12)
Attendance (PS-12)
Number of Students Suspended 10 or More Days
(PS-12)
2010-2011
2010-2011 2009-2010 2010-2011 2009-2010
SCHOOL_NAME
Ideal Academy North Capitol
Imagine
Southeast
KIPP DC: AIM
KIPP DC: College
Prep
KIPP DC:
Discover
KIPP DC: Grow
KIPP DC: KEY
KIPP DC: LEAP
KIPP DC:
Promise
KIPP DC: WILL
Latin American
Montessori
Bilingual
Mary McLeod
Bethune Slowe/Brooklan
d
Maya Angelou Evans
Maya Angelou Middle
Meridian
9/19/2012
Audited
Audited
Enrollment Enrollment
(Oct 2010) (Oct 2009)
# of Students
% Suspended
Attendance Attendance
Suspended 10 10 days or
Rate
Rate
days or more more
2009-2010
Number of Students Expelled (PS-12)
2010-2011
# of Students % Suspended # of
Suspended 10 10 days or
Students
days or more more
Expelled
2009-2010
# of
% Expelled Students
Expelled
% Expelled
273
285
97%
98%
2
1%
NO DATA
N/A
0
0%
NO DATA
N/A
489
321
88%
88%
0
0%
0
0%
0
0%
0
0%
331
330
96%
94%
0
0%
11
3%
4
1%
7
2%
211
117
94%
93%
8
4%
2
2%
7
3%
6
5%
197
100
93%
N/A
0
0%
0
0%
0
0%
0
0%
101
417
280
N/A
328
281
N/A
96%
97%
N/A
96%
95%
0
1
0
0%
0%
0%
N/A
0
0
N/A
0%
0%
0
8
0
0%
2%
0%
N/A
4
1
N/A
1%
0%
203
111
96%
96%
0
0%
0
0%
2
1%
2
1%
329
319
95%
95%
0
0%
0
0%
5
2%
0
0%
199
172
97%
97%
0
0%
0
0%
0
0%
0
0%
283
172
97%
94%
0
0%
3
2%
1
0%
6
3%
264
416
88%
84%
NO DATA
N/A
2
0%
7
3%
5
1%
222
205
90%
89%
0
0%
0
0%
7
3%
1
0%
515
522
97%
96%
0
0%
0
0%
0
0%
0
0%
6
7. Updated Discipline Data for 2009-2010; 2010-2011
Data Highlighted in yellow has changed since February 2012
Enrollment (PS-12)
Attendance (PS-12)
Number of Students Suspended 10 or More Days
(PS-12)
2010-2011
2010-2011 2009-2010 2010-2011 2009-2010
SCHOOL_NAME
National
Collegiate
Preparatory
Next Step
Audited
Audited
Enrollment Enrollment
(Oct 2010) (Oct 2009)
# of Students
% Suspended
Attendance Attendance
Suspended 10 10 days or
Rate
Rate
days or more more
2009-2010
Number of Students Expelled (PS-12)
2010-2011
# of Students % Suspended # of
Suspended 10 10 days or
Students
days or more more
Expelled
2009-2010
# of
% Expelled Students
Expelled
up from 1%
new data
167
82
91%
90%
0
0%
0
138
110
80%
86%
0
0%
0
% Expelled
0%
6
4%
3
4%
0%
0
0%
0
0%
new data
Options
373
319
94%
91%
25
7%
17
5%
11
3%
4
1%
Paul Junior High
559
667
98%
98%
2
0%
15
2%
1
0%
7
1%
749
741
90%
92%
10
1%
9
1%
6
1%
1
0%
235
269
94%
92%
0
0%
3
1%
2
1%
0
0%
Roots - Kennedy
108
102
100%
99%
0
0%
0
0%
0
0%
0
0%
Roots - N.
Capitol
108
102
100%
97%
0
0%
0
0%
0
0%
0
0%
Perry Street
Prep
Potomac
Lighthouse
new data
new data
new data
new data
SEED
341
337
93%
94%
9
3%
6
2%
15
4%
18
5%
Septima Clark
St. Coletta
Special
Education
Thurgood
Marshall
Tree of Life
Community
225
133
93%
94%
0
0%
0
0%
3
1%
1
1%
225
225
99%
98%
0
0%
0
0%
0
0%
0
0%
388
389
94%
94%
2
1%
3
1%
0
0%
1
0%
307
266
96%
95%
1
0%
2
1%
3
1%
2
1%
9/19/2012
7
8. Updated Discipline Data for 2009-2010; 2010-2011
Data Highlighted in yellow has changed since February 2012
Enrollment (PS-12)
Attendance (PS-12)
Number of Students Suspended 10 or More Days
(PS-12)
2010-2011
2010-2011 2009-2010 2010-2011 2009-2010
SCHOOL_NAME
Two Rivers Elementary
Two Rivers Middle
Washington
Latin - High
Washington
Latin - Middle
Washington Yu
Ying
Audited
Audited
Enrollment Enrollment
(Oct 2010) (Oct 2009)
# of Students
% Suspended
Attendance Attendance
Suspended 10 10 days or
Rate
Rate
days or more more
2009-2010
Number of Students Expelled (PS-12)
2010-2011
# of Students % Suspended # of
Suspended 10 10 days or
Students
days or more more
Expelled
2009-2010
# of
% Expelled Students
Expelled
% Expelled
342
346
96%
96%
1
0%
0
0%
1
0%
0
0%
92
69
94%
99%
0
0%
1
1%
2
1%
0
0%
122
167
95%
95%
0
0%
1
1%
1
1%
2
1%
310
349
99%
100%
2
1%
1
0%
1
0%
0
0%
241
198
95%
97%
0
0%
0
0%
0
0%
0
0%
William E. Doar,
Jr. - Edgewood
Elementary
241
295
90%
91%
No Data
N/A
0
0%
No Data
N/A
0
0%
William E. Doar,
Jr. - Edgewood
Middle/High
245
195
83%
90%
No Data
N/A
2
1%
9
4%
13
1%
182
154
93%
94%
0
0%
0
0%
0
0%
0
0%
351
368
100%
99%
0
0%
2
1%
0
0%
0
116
98
N/A
N/A
0
0%
0
0%
18
16%
16
William E. Doar,
Jr. - Soldier's
Home
WMST
YouthBuild
9/19/2012
new data
0%
new data
16%
8