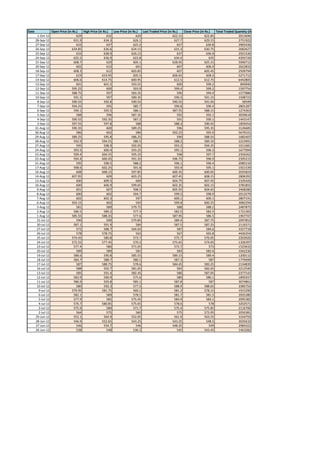
7. Open Price High Price Low Price Last Traded Price Close Price Total Traded Quantity Turnover
Open Price 1
High Price 0.995172844 1
Low Price 0.994521591 0.995147889 1
Last Traded Price
0.987248184 0.99423935 0.994502678 1
Close Price 0.988682792 0.995450565 0.995729457 0.999523517 1
Total Traded Quantity
-0.037846796 -0.005416219 -0.05236563 -0.020057836 -0.018335387 1
Turnover 0.152280913 0.185747371 0.139678582 0.171537877 0.173485192 0.977689729 1
8. SUMMARY OUTPUT
Regression Statistics
Multiple R 0.995172844
R Square 0.99036899
Adjusted R Square 0.990318032
Standard Error 4.469802659
Observations 191
ANOVA
df SS MS F Significance F
Regression 1 388296.7 388296.7 19435.10941 1.668E-192
Residual 189 3776.057 19.97914
Total 190 392072.7
CoefficientsStandard Error t Stat P-value Lower 95% Upper 95%Lower 95.0%
Upper 95.0%
Intercept 12.83508564 3.837225 3.344887 0.000992744 5.265794825 20.40438 5.265795 20.40438
X Variable 1 0.987372142 0.007083 139.4099 1.668E-192 0.973401212 1.001343 0.973401 1.001343
Regression equation of high price on low price: y=0.987x+12.835
High Price vs. Open Price
700
600
500
High Price
400
300
200
100
0
0 100 200 300 400 500 600 700
Open Price
9. SUMMARY OUTPUT
Regression Statistics
Multiple R 0.995173
R Square 0.990369
Adjusted R Square 0.990318
Standard Error 4.505116
Observations 191
ANOVA
df SS MS F Significance F
Regression 1 394456.4 394456.4 19435.10941 1.668E-192
Residual 189 3835.958 20.29607
Total 190 398292.3
Coefficients
Standard Error t Stat P-value Lower 95% Upper 95%Lower 95.0%Upper 95.0%
Intercept -7.674638 3.941027 -1.94737 0.052971984 -15.44868878 0.099413 -15.44869 0.099413
X Variable 1 1.003035 0.007195 139.4099 1.668E-192 0.98884262 1.017228 0.988843 1.017228
Regression Equation of open price on high price: x=1.003y-7.67
Open Price vs. High Price
700
600
Open Price (x)
500
400
300
200
100
0
0 100 200 300 400 500 600 700
High Price (Y)
10. SUMMARY OUTPUT
Regression Statistics
Multiple R 0.994522
R Square 0.989073
Adjusted R Square
0.989015
Standard Error
4.852794
Observations 191
ANOVA
df SS MS F Significance F
Regression 1 402884.7 402884.7 17107.91 2.5E-187
Residual 189 4450.876 23.54961
Total 190 407335.6
Coefficients
Standard Error t Stat P-value Lower 95% Upper 95%Lower 95.0%
Upper 95.0%
Intercept -8.99007 4.166014 -2.15796 0.032193 -17.2079 -0.77222 -17.2079 -0.77222
X Variable 1 1.005749 0.007689 130.7972 2.5E-187 0.990581 1.020917 0.990581 1.020917
Regression Equation of Low Price on Open Price: y=1.01x-8.99
Low Price vs. Open Price
700
600
500
Low Price
400
300
200
100
0
0 100 200 300 400 500 600 700
Open Price
11. SUMMARY OUTPUT
Regression Statistics
Multiple R 0.994522
R Square 0.989073
Adjusted R Square
0.989015
Standard Error
4.798623
Observations 191
ANOVA
df SS MS F Significance F
Regression 1 393940.3 393940.3 17107.91 2.5E-187
Residual 189 4352.063 23.02679
Total 190 398292.3
Coefficients
Standard Error t Stat P-value Lower 95% Upper 95%Lower 95.0%
Upper 95.0%
Intercept 14.73997 4.029756 3.657782 0.00033 6.790894 22.68905 6.790894 22.68905
X Variable 1 0.98342 0.007519 130.7972 2.5E-187 0.968589 0.998251 0.968589 0.998251
Regression Equation of Open Price (x) on Low Price (y): x=0.983y+14.74
Open Price Vs. Low Price
700
600
500
Open Price (x)
400
300
200
100
0
0 100 200 300 400 500 600 700
Low Price (y)
12. SUMMARY OUTPUT
Regression Statistics
Multiple R 0.987248
R Square 0.974659
Adjusted R Square
0.974525
Standard Error
7.295328
Observations 191
ANOVA
df SS MS F Significance F
Regression 1 386883.3 386883.3 7269.262 8.5E-153
Residual 189 10058.92 53.22181
Total 190 396942.2
Coefficients
Standard Error t Stat P-value Lower 95% Upper 95%Lower 95.0%
Upper 95.0%
Intercept 8.282786 6.262875 1.322521 0.187593 -4.07133 20.6369 -4.07133 20.6369
X Variable 1 0.985574 0.01156 85.25997 8.5E-153 0.962771 1.008376 0.962771 1.008376
Regression Equation of Last Traded Price on Open Price: y=0.99x+8.28
Last Trading Price Vs. Open Price
700
600
Last Trading Price
500
400
300
200
100
0
0 100 200 300 400 500 600 700
Open Price
13. SUMMARY OUTPUT
Regression Statistics
Multiple R 0.987248
R Square 0.974659
Adjusted R Square
0.974525
Standard Error
7.307724
Observations 191
ANOVA
df SS MS F Significance F
Regression 1 388199.2 388199.2 7269.262 8.5E-153
Residual 189 10093.14 53.40283
Total 190 398292.3
Coefficients
Standard Error t Stat P-value Lower 95% Upper 95%Lower 95.0%
Upper 95.0%
Intercept 5.489564 6.289816 0.87277 0.383896 -6.9177 17.89682 -6.9177 17.89682
X Variable 1 0.988926 0.011599 85.25997 8.5E-153 0.966046 1.011806 0.966046 1.011806
Regression Equation of Open Price (x) on LTP(y) x=0.989y+5.49
Open Price Vs. Last Traded Price
700
600
Open Price (x)
500
400
300
200
100
0
0 100 200 300 400 500 600 700
Last Traded Price (y)
14. SUMMARY OUTPUT
Regression Statistics
Multiple R 0.988683
R Square 0.977494
Adjusted R Square
0.977375
Standard Error .87766
6
Observations 191
ANOVA
df SS MS F Significance F
Regression 1 388286.6 388286.6 8208.635 1.2E-157
Residual 189 8940.118 47.30221
Total 190 397226.7
Coefficients
Standard Error t Stat P-value Lower 95% Upper 95%Lower 95.0%
Upper 95.0%
Intercept 7.404057 5.904316 1.254007 0.211388 -4.24277 19.05088 -4.24277 19.05088
X Variable 1 0.987359 0.010898 90.60152 1.2E-157 0.965862 1.008856 0.965862 1.008856
Regression Equation of Close Price on Open Price y=0.99x+7.4
Close Price vs. Open Price
700
600
500
Close Price
400
300
200
100
0
0 100 200 300 400 500 600 700
Open Price
15. SUMMARY OUTPUT
Regression Statistics
Multiple R 0.988683
R Square 0.977494
Adjusted R Square
0.977375
Standard Error
6.886879
Observations 191
ANOVA
df SS MS F Significance F
Regression 1 389328.2 389328.2 8208.635 1.2E-157
Residual 189 8964.101 47.42911
Total 190 398292.3
Coefficients
Standard Error t Stat P-value Lower 95% Upper 95%Lower 95.0%
Upper 95.0%
Intercept 4.820211 5.926413 0.813344 0.417044 -6.8702 16.51062 -6.8702 16.51062
X Variable 1 0.990008 0.010927 90.60152 1.2E-157 0.968453 1.011563 0.968453 1.011563
Regression Equation of Open Price (x) on Close Price (y) x=0.99y+4.82
Open Price Vs. Close Price
700
600
500
Open Price (x)
400
300
200
100
0
0 100 200 300 400 500 600 700
Close Price (y)
16. SUMMARY OUTPUT
Regression Statistics
Multiple R 0.995148
R Square 0.990319
Adjusted R Square 0.990268
Standard Error 4.567707
Observations 191
ANOVA
df SS MS F Significance F
Regression 1 403392.3 403392.3 19334.42317 2.7122E-192
Residual 189 3943.285 20.86394
Total 190 407335.6
Coefficients
Standard Error t Stat P-value Lower 95% Upper 95%Lower 95.0%Upper 95.0%
Intercept -19.72843 3.995781 -4.937316 1.73483E-06 -27.61048758 -11.84637 -27.61049 -11.84637
X Variable 1 1.014333 0.007295 139.0483 2.7122E-192 0.999943088 1.028723 0.999943 1.028723
Regression Equation of Low Price on High Price y=1.01x-19.73
Low Price Vs. High Price
700
600
500
Low Price
400
300
200
100
0
0 100 200 300 400 500 600 700
High Price
17. SUMMARY OUTPUT
Regression Statistics
Multiple R 0.995148
R Square 0.990319
Adjusted R Square
0.990268
Standard Error
4.481314
Observations 191
ANOVA
df SS MS F Significance F
Regression 1 388277.2 388277.2 19334.42 2.7E-192
Residual 189 3795.531 20.08217
Total 190 392072.7
Coefficients
Standard Error t Stat P-value Lower 95% Upper 95%Lower 95.0%
Upper 95.0%
Intercept 24.54585 3.763288 6.522448 6.16E-10 17.12241 31.96929 17.12241 31.96929
X Variable 1 0.976326 0.007021 139.0483 2.7E-192 0.962475 0.990176 0.962475 0.990176
Regression Equation of High Price (x) on Low Price (y) x=0.976y+24.55
High Price Vs. Low Price
700
600
500
High Price (x)
400
300
200
100
0
0 100 200 300 400 500 600 700
Low Price (y)
18. SUMMARY OUTPUT
Regression Statistics
Multiple R 0.994239
R Square 0.988512
Adjusted R Square
0.988451
Standard Error
4.911986
Observations 191
ANOVA
df SS MS F Significance F
Regression 1 392382.1 392382.1 16262.78662 2.9E-185
Residual 189 4560.118 24.12761
Total 190 396942.2
Coefficients
Standard Error t Stat P-value Lower 95% Upper 95%Lower 95.0%
Upper 95.0%
Intercept -5.738633 4.296953 -1.335512 0.183314891 -14.21478 2.737515 -14.21478 2.737515
X Variable 1 1.000394 0.007845 127.5256 2.8782E-185 0.98492 1.015869 0.98492 1.015869
Regression Equation of LTP on High Price y=1x-5.74
LTP vs. High Price
700
600
Last Traded Price
500
400
300
200
100
0
0 100 200 300 400 500 600 700
High Price
19. SUMMARY OUTPUT
Regression Statistics
Multiple R 0.994239
R Square 0.988512
Adjusted R Square
0.988451
Standard Error
4.881764
Observations 191
ANOVA
df SS MS F Significance F
Regression 1 387568.6 387568.6 16262.79 2.9E-185
Residual 189 4504.176 23.83162
Total 190 392072.7
Coefficients
Standard Error t Stat P-value Lower 95% Upper 95%Lower 95.0%
Upper 95.0%
Intercept 11.94158 4.201773 2.842035 0.004975 3.653188 20.22998 3.653188 20.22998
X Variable 1 0.988122 0.007748 127.5256 2.9E-185 0.972838 1.003407 0.972838 1.003407
Regression Equation of High Price(x) on LTP(y) x=0.9881y+11.94
High Price vs. Last Traded Price
700
600
500
High Price
400
300
200
100
0
0 100 200 300 400 500 600 700
Last Traded Price
20. SUMMARY OUTPUT
Regression Statistics
Multiple R 0.995451
R Square 0.990922
Adjusted R Square
0.990874
Standard Error
4.368049
Observations 191
ANOVA
df SS MS F Significance F
Regression 1 393620.6 393620.6 20630.17 6.3E-195
Residual 189 3606.093 19.07985
Total 190 397226.7
Coefficients
Standard Error t Stat P-value Lower 95% Upper 95%Lower 95.0%
Upper 95.0%
Intercept -6.51444 3.821123 -1.70485 0.089866 -14.052 1.023087 -14.052 1.023087
X Variable 1 1.001972 0.006976 143.6321 6.3E-195 0.988211 1.015733 0.988211 1.015733
Regression Equation of Close Price on High Price y=1x-6.51
Close Price Vs. High Price
700
600
500
Close Price
400
300
200
100
0
0 100 200 300 400 500 600 700
High Price
21. SUMMARY OUTPUT
Regression Statistics
Multiple R 0.995451
R Square 0.990922
Adjusted R Square
0.990874
Standard Error
4.339619
Observations 191
ANOVA
df SS MS F Significance F
Regression 1 388513.4 388513.4 20630.17 6.3E-195
Residual 189 3559.304 18.8323
Total 190 392072.7
Coefficients
Standard Error t Stat P-value Lower 95% Upper 95%Lower 95.0%
Upper 95.0%
Intercept 11.39818 3.734402 3.052209 0.002599 4.031713 18.76464 4.031713 18.76464
X Variable 1 0.988972 0.006885 143.6321 6.3E-195 0.975389 1.002554 0.975389 1.002554
Regression Equation of High Price (x) on Close Price (y): x=0.989y+11.4
High Price vs. Close Price
700
600
500
High Price (x)
400
300
200
100
0
0 100 200 300 400 500 600 700
Close Price (y)
22. SUMMARY OUTPUT
Regression Statistics
Multiple R 0.994503
R Square 0.989036
Adjusted R Square
0.988978
Standard Error
4.798723
Observations 191
ANOVA
df SS MS F Significance F
Regression 1 392590 392590 17048.57 3.5E-187
Residual 189 4352.243 23.02774
Total 190 396942.2
Coefficients
Standard Error t Stat P-value Lower 95% Upper 95%Lower 95.0%
Upper 95.0%
Intercept 16.1352 4.02984 4.00393 8.94E-05 8.185954 24.08444 8.185954 24.08444
X Variable 1 0.981733 0.007519 130.5702 3.5E-187 0.966902 0.996565 0.966902 0.996565
Regression Equation of LTP on Low Price y=0.98x+16.14
LTP vs. Low Price
700
600
Last Traded Price
500
400
300
200
100
0
0 100 200 300 400 500 600 700
Low Price
23. SUMMARY OUTPUT
Regression Statistics
Multiple R 0.994503
R Square 0.989036
Adjusted R Square
0.988978
Standard Error .86114
4
Observations 191
ANOVA
df SS MS F Significance F
Regression 1 402869.4 402869.4 17048.57 3.5E-187
Residual 189 4466.2 23.63069
Total 190 407335.6
Coefficients
Standard Error t Stat P-value Lower 95% Upper 95%Lower 95.0%
Upper 95.0%
Intercept -10.4005 4.184022 -2.48577 0.013795 -18.6539 -2.14712 -18.6539 -2.14712
X Variable 1 1.007438 0.007716 130.5702 3.5E-187 0.992218 1.022658 0.992218 1.022658
Regression Equation of Low Price (x) on LTP (y) x=1.007y-10.4
Low Price Vs. Last Traded Price
700
600
500
Low Price (x)
400
300
200
100
0
0 100 200 300 400 500 600 700
Last Traded Price (y)
24. SUMMARY OUTPUT
Regression Statistics
Multiple R 0.995729
R Square 0.991477
Adjusted R Square
0.991432
Standard Error
4.232342
Observations 191
ANOVA
df SS MS F Significance F
Regression 1 393841.2 393841.2 21986.68 1.6E-197
Residual 189 3385.503 17.91272
Total 190 397226.7
Coefficients
Standard Error t Stat P-value Lower 95% Upper 95%Lower 95.0%
Upper 95.0%
Intercept 15.38584 3.554208 4.328909 2.43E-05 8.374831 22.39686 8.374831 22.39686
X Variable 1 0.983296 0.006631 148.2791 1.6E-197 0.970215 0.996377 0.970215 0.996377
Regression Equation of Close Price on Low Price y=0.98x+15.39
Close Price Vs. Low Price
700
600
500
Close Price
400
300
Close Price Vs. Low Price
200
100
0
0 200 400 600 800
Low Price
25. SUMMARY OUTPUT
Regression Statistics
Multiple R 0.995729
R Square 0.991477
Adjusted R Square
0.991432
Standard Error
4.285857
Observations 191
ANOVA
df SS MS F Significance F
Regression 1 403863.9 403863.9 21986.68 1.6E-197
Residual 189 3471.66 18.36857
Total 190 407335.6
Coefficients
Standard Error t Stat P-value Lower 95% Upper 95%Lower 95.0%
Upper 95.0%
Intercept -10.9629 3.688138 -2.97247 0.003339 -18.2381 -3.68767 -18.2381 -3.68767
X Variable 1 1.00832 0.0068 148.2791 1.6E-197 0.994906 1.021734 0.994906 1.021734
Regression Equation of Low Price (x) on Close Price (y) x=1.008y-10.96
Low Price vs. Close Price
700
600
500
Low Price (x)
400
300
200
100
0
0 100 200 300 400 500 600 700
Close Price (y)
26. SUMMARY OUTPUT
Regression Statistics
Multiple R 0.999524
R Square 0.999047
Adjusted R Square
0.999042
Standard Error
1.415061
Observations 191
ANOVA
df SS MS F Significance F
Regression 1 396848.3 396848.3 198186.4 1.9E-287
Residual 189 378.4534 2.002399
Total 190 397226.7
Coefficients
Standard Error t Stat P-value Lower 95% Upper 95%Lower 95.0%
Upper 95.0%
Intercept 0.149318 1.217955 0.122598 0.902556 -2.25321 2.551849 -2.25321 2.551849
X Variable 1 0.999882 0.002246 445.1813 1.9E-287 0.995451 1.004312 0.995451 1.004312
Regression Equation of Close Price on Last Traded Price y=1x+0.15
Close Price vs. Last Traded Price
700
600
500
Close Price
400
300
200
100
0
0 100 200 300 400 500 600 700
Last Traded Price
27. SUMMARY OUTPUT
Regression Statistics
Multiple R 0.999524
R Square 0.999047
Adjusted R Square 0.999042
Standard Error 1.414555
Observations 191
ANOVA
df SS MS F Significance F
Regression 1 396564.1 396564.1 198186.4171 1.8896E-287
Residual 189 378.1824 2.000965
Total 190 396942.2
Coefficients
Standard Error t Stat P-value Lower 95% Upper 95%Lower 95.0%
Upper 95.0%
Intercept 0.365624 1.217276 0.300362 0.764230948 -2.035569329 2.766817 -2.035569 2.766817
X Variable 1 0.999166 0.002244 445.1813 1.8896E-287 0.994738267 1.003593 0.994738 1.003593
Regression Equation of LTP on Close Price x=0.999y+0.37
Last Traded Price Vs. Close Price
700
600
Last Traded Price (x)
500
400
300
200
100
0
0 100 200 300 400 500 600 700
Close Price (y)
28. SUMMARY OUTPUT
Regression Statistics
Multiple R 0.97769
R Square 0.955877
Adjusted R Square
0.955644
Standard Error
237340.2
Observations 191
ANOVA
df SS MS F Significance F
Regression 1 2.31E+14 2.31E+14 4094.5 4.9E-130
Residual 189 1.06E+13 5.63E+10
Total 190 2.41E+14
Coefficients
Standard Error t Stat P-value Lower 95% Upper 95%Lower 95.0%
Upper 95.0%
Intercept 137253.5 44213 3.104371 0.0022 50039.2 224467.9 50039.2 224467.9
X Variable 1 0.001761 2.75E-05 63.98828 4.9E-130 0.001707 0.001815 0.001707 0.001815
Regression Equation of Turn Over on Total Traded Quantity y=0.002x+137253.54
Turn over Vs. Total Traded Quantity
4.5E+09
4E+09
3.5E+09
3E+09
Turnover
2.5E+09
2E+09
1.5E+09
1E+09
500000000
0
0 1000000 2000000 3000000 4000000 5000000 6000000 7000000
Total Traded Quantity
29. SUMMARY OUTPUT
Regression Statistics
Multiple R 0.97769
R Square 0.955877
Adjusted R Square
0.955644
Standard Error
1.32E+08
Observations 191
ANOVA
df SS MS F Significance F
Regression 1 7.11E+19 7.11E+19 4094.5 4.9E-130
Residual 189 3.28E+18 1.74E+16
Total 190 7.44E+19
Coefficients
Standard Error t Stat P-value Lower 95% Upper 95%Lower 95.0%
Upper 95.0%
Intercept -9182674 25156092 -0.36503 0.715499 -5.9E+07 40440108 -5.9E+07 40440108
X Variable 1 542.8102 8.482962 63.98828 4.9E-130 526.0767 559.5436 526.0767 559.5436
Regression Equation of Total Traded Quantity (x) on Turnover (y) x=542.81y-9182673.85
Total Traded Quantity vs. Turnover
7000000
Total Traded Quantity (x)
6000000
5000000
4000000
3000000
2000000
1000000
0
0 1E+09 2E+09 3E+09 4E+09 5E+09
Turnover (y)