1. The Kirkpatrick Model of Training Evaluation
Reading: Kirkpatrick, pages 1-66 and 71-86.
Donald Kirkpartick has developed a very popular evaluation model
that has been used since the late 1950s by the training community.
The focus is on measuring four kinds of outcomes that should
result from a highly effective training program.
Kirkpatrick’s model includes four levels or steps of outcome
evaluation:
• Level 1 Evaluation—Reaction
• Level 2 Evaluation—Learning
• Level 3 Evaluation—Behavior
• Level 4 Evaluation—Results
I will discuss each of these steps in some detail, including how to
design these evaluations.
Level 1—Reaction
Here your goal is to measure participants’ reactions to the training
program. You should measure their reactions immediately after the
program. Level one evaluation should not just include reactions
toward the overall program (e.g., Did you like the program?); it
should also include measurement of participants’ reactions or
attitudes toward specific components of the program, such as the
instructor, the topics, the presentation style, the schedule,
audiovisuals, etc. Furthermore, each of these components can be
further broken down into sub-components for evaluation (e.g., you
2. can ask participants to evaluate specific characteristics of the
instructor, the presentation, etc.). In short, level one evaluation is
far more than just the measurement of overall customer
satisfaction.
Learning (Level two outcomes) and transfer of learning (Level
three outcomes) are unlikely to occur unless participants have
positive attitudes toward the training program. Therefore, it is
important to determine participants’ reactions to the training
program. Also, positive reactions are important because managers
are more likely to eliminate unpopular training programs. Finally,
the measurement of specific aspects of the training program can
provide important information about what aspects of the training
program can be improved in the future.
Level 1 evaluation relies on the measurement of attitudes, usually
through the use of a questionnaire. It is important to include
closed-ended items (including rating scales) as well as open-ended
items on your questionnaire. Here are two open-ended items that I
like:
• In your view, what were the three most important weaknesses
of the program?
• In your view, what were the three most important strengths of
the program?
It is important to learn the weaknesses, as well as the strengths, in
order to improve a program. Do not be afraid to ask about program
weaknesses!
When having participants fill out questionnaires, it is best not to
have them put their names on the instruments because of the
advantages of anonymity over confidentiality. If they do not put
3. their names on the instruments, you can assure anonymity and they
may be more likely to be more honest in their answers.
The level one questionnaires shown in Exhibit 4.3 and 4.4 are
acceptable. The main changes I suggest are to put “neutral” rather
than “agree” in the center of the 8-point rating scale used in the
Exhibit 4.3 rating scale (actually, I’d probably recommend using a
five-point rating scale) and include open-ended items about the
program strengths and weaknesses. I don’t recommend the
questionnaires shown in Exhibits 4.1, 4.2, or 4.5.
The following point applies to all four levels of Kirkpartick’s
outcome evaluation, but I will only state it here: Evaluators should
establish performance standards on the outcomes, when possible,
so that the four steps in the logic of evaluation can be utilized and
evaluative judgments can be made. Also, don’t forget Kirkpatrick’s
last piece of advice to communicate the results because utilization
of evaluation results will not happen without dissemination and
communication.
Here are a few advantages of level one evaluation:
• You will know how the participants felt about the training
event.
• It may point out content areas that trainees felt were missing
from the training event.
• It will tell you how engaged the participants felt by the
training event.
• It can provide information about overall participant reaction
as well as participant feedback and evaluation of specific
aspects of the training event.
4. • Detailed level one evaluation can provide formative
evaluation information that can be used to improve future
versions of the training program (e.g., you can fix the things
the participants disliked about the program and add the
things they felt was missing).
Level 2—Learning
Here your goal is to determine what the training program
participants learned during the training event. Because the training
instructor should have specific learning objectives, one hopes to
find clear learning outcomes. Learning outcomes can include
changes in knowledge (e.g., What are the key differences between
Windows 95 and Windows ME?), skills (Can the participant
upload a new operating system to a computer), or attitudes (Have
participants’ attitudes toward computers improved?). Some
training events will emphasize knowledge, some will emphasize
skills, some will emphasize attitudes, and some will emphasize
multiple learning outcomes. The evaluation should focus on
measuring what was covered in the training event (i.e., the learning
objectives).
Level two evaluation should be done immediately after the training
event to determine if participants gained the knowledge, skills, or
attitudes. A couple of issues here are (a) how shall one measure
knowledge, skills, and attitudes, and (b) what research design
should be use to demonstrate improvement in level two outcomes?
First, let’s talk about the measurement of level two outcomes.
Knowledge is typically measured using already available or
instructor constructed achievement tests (i.e., tests designed to
measure the degree of learning that has taken place). In the training
environment, these tests are usually criterion-referenced. Note that
norm-referenced tests are traditional standardized tests that are
5. constructed to maximize individual differences and to allow
comparison of individuals to an external norming group. A normal
curve often characterizes the performance distribution of the
norming group. In contrast, criterion-referenced tests are
constructed to determine whether learners have mastered one or
more learning objectives and these tests include a cutoff point
(pass/fail). The results of criterion-referenced tests often take the
form of a negatively skewed curve, where the vast majority of the
learners have reached or surpassed the criterion or cut-off point
(i.e., the point at which one must reach in order to pass the test)
and only a few learners have lower scores. In constructing a
criterion-referenced test, you should develop a pool of items
potentially measuring the content, have a panel of experts examine
the items, pilot test the selected items, and analyze each item for
item difficulty (i.e., the percentage of people who answer the item
correctly), item discrimination (i.e., the high performers should be
more likely to get the item correct than low performers if it is a
good item), and distractor effectiveness (are the distractors
working well?). Eliminate items with poor performance on
difficulty (i.e., items that are too hard or too simple),
discrimination (i.e., items that the low/less knowledgeable
performers are more likely to get correct than the
high/knowledgeable performers), and items whose distractors do
not work well (e.g., an item where all incorrect responses are for
only one distractor). Note Kirkpatrick’s brief example of a
knowledge test on page 44.
Skills typically require some kind of motor or manual response on
the examinee’s part, or some kind of manipulation; therefore, a
performance test is used. A performance test is just a test that
requires the test taker to create a product or demonstrate a process.
Obviously the goal is to determine whether each person can
perform the skills they have been taught in the training event. For
example, if the learning objective was to learn to make repairs to
computers, a performance test would be required to determine
6. whether a person can install a power supply or a computer chip in
a computer. If the learning objective was to learn how to make
effective public speeches, the participants would need to be
evaluated on actual speeches that they give to the group. Some
performance elements can be included on traditional paper-and-
pencil tests (e.g., essay writing, drawing skills, etc.). In the training
environment, performance tests are likely to be criterion-
referenced (i.e., participants’ scores are compared to a cutoff
point).
Attitudes are measured with questionnaires similar to the
questionnaires described for level one evaluation. You will
typically have the participants give their ratings for various items
(responding with Strongly Agree, Agree, Neutral, Disagree, or
Strongly Disagree or with other rating scales), and you should
include some open-ended items to allow participants to respond in
their own words (e.g., How do you feel about diversity in the
workplace?).
Second, Kirkpartick also briefly discusses the issue of research
design. He suggests that you include a control group in your design
when possible, and he briefly mentions using a pretest measure
when possible.
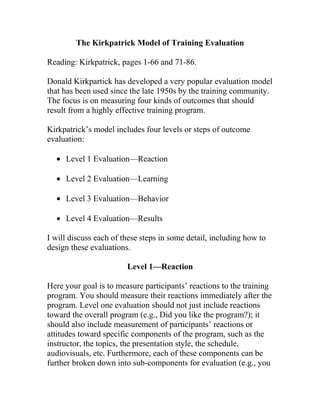
To give you a better idea of the design issues here, Here are several
experimental research designs.
Visual Depiction
of the Design Design Name
-------------------------------------------------------------------------
X O2 Posttest-only nonequivalent
O4 control group design
-------------------------------------------------------------------------
7. O1 X O2 One-group pretest-posttest design
-------------------------------------------------------------------------
O1 X O2 Pretest-posttest nonequivalent
---------------- control group design
O3 O4
-------------------------------------------------------------------------
R O1 X O2 Randomized pretest-posttest
R O3 O4 control group design (Note: this
design has random assignment to
groups)
-------------------------------------------------------------------------
O1 O2 O3 O4 X O5 O6 O7 O8 Interrupted time-series design
-------------------------------------------------------------------------
Here is the basic logic of analysis for each of the designs just
listed. The counterfactual, discussed in an earlier lecture, is
estimated slightly differently in some of these designs, which
means that the comparison may be different from design to design.
Generally, you will check each of the following comparisons for
practical significance.
• For the posttest-only nonequivalent control group design you
compare the two posttest means (i.e., O2 with O4)
• For the one-group pretest-posttest design you compare the
pretest mean with the posttest mean (i.e., O2 with O1)
8. • For the pretest-posttest nonequivalent control group design
you compare the change in the experimental group (O2 minus
O1) with the change in the control group (O4 minus O3)
• For the randomized pretest-posttest control group design you
compare the change in the experimental group (O2 minus O1)
with the change in the control group (O4 minus O3). The word
“randomized” in the title of this design means that the
participants must be randomly assigned to the groups, which
“equates” the groups on extraneous variables.
• For the interrupted time-series design, you compare the
baseline series results (O1 O2 O3 O4) with the experimental
series results (O5 O6 O7 O8), looking for differences in slope
and differences in level of outcome.
Note that the posttest-only nonequivalent control group design is
by far the weakest of the designs shown above (because you have
no idea what group differences existed before the intervention),
and the strongest design is the randomized pretest-posttest control
group design because the groups are formed through random
assignment (which makes the groups probabilistically equal on all
known and unknown extraneous variables).
With the above review of the commonly used research designs,
Kirkpartick’s discussion of designs should make a little more
sense. Kirkpartick tends to take a very pragmatic stance toward
design, claiming that one should use the best design possible, but,
at the same time, one should also consider what is cost effective
and practical to use in the organization undergoing evaluation. He
believes that some data are virtually always better than no data at
all.
Here are few advantages of level two evaluation:
9. • Demonstrating participant learning should help trainers in
promoting their training program.
• Knowledge of level two evaluation can help in interpreting
the results of level three evaluation (e.g., if level three results
do not occur, it may because of workplace factors and not
because of any flaw in the training program).
• Detailed level two evaluation can provide formative
evaluation information that can be used to improve future
versions of the training program (e.g., you may find certain
learning objectives that are not being met).
Level 3—Behavior
Here your goal is to find out if training program participants
change their on-the-job-behavior (OJB) as a result of their having
attended and participated in the training program. If the behavior
change does not occur, you also want to find out why the change
did not occur. The level three question is, Did the training have a
positive effect on job performance? Level three evaluation
specifically involves measuring the transfer of knowledge, skills,
and attitudes from the training context to the workplace.
Remember that level one and level two outcomes are still
important because participants generally need to react positively to
the training program (level 1 outcome) and they need to learn the
material (level 2 outcome) if they are going to be motivated and
able to apply what they have learned when they return to their jobs.
Learning is likely to transfer only if the conditions in the work
setting are favorable for transfer. In addition, there are obviously
many things that trainers can do to increase the likelihood of
transfer. In other words, transfer is affected by “training factors”
before trainees go back to their workplace as well as “workplace
10. factors” that operate in their workplace when they return. Here are
two sets of factors that make transfer more likely to occur:
A. These are some factors in the training program or event that can
help facilitate transfer of learning:
• The training or learning environment or context or culture is
made to be similar to the actual work environment or context
or culture of the organization (this is called situated
learning). Learning that takes place in “authentic” contexts is
more likely to by used later.
• Provide real world examples and actual experience
performing and practicing the behaviors.
• Make sure trainees understand the general principles behind
the behaviors (called “transfer through principles”).
• Explain the importance and applicability of the future on-the-
job behaviors (i.e., motivate the trainees)
B. These are some factors in the receiving organization that can
help facilitate transfer of learning:
• The organizational culture and climate support change.
• The participant’s direct supervisor and others with whom he
or she works support and/or facilitate the participant’s new
behaviors through direct extrinsic rewards such as help,
encouragement, praise, increased freedom and responsibility,
pay increases, and recognition.
• The participant gains intrinsic reinforcement from applying
his or her new knowledge, skills, or attitudes (i.e., he or she
11. likes what was learned and enjoys performing the new related
behaviors).
• The participant has the opportunity to use his or her new
knowledge or skills on the job.
So how does one design a level three evaluation? Here are
Kirkpartick’s recommendations:
1. Use a control group if possible. That is, use the strongest design
that is feasible.
2. Allow time for the behavior change to take place.
3. Evaluate both before and after the program if practical. Again,
use the strongest design that is feasible.
4. Survey and/or interview one or more of the following: trainees,
their immediate
supervisor, their subordinates, and others who often observe their
behavior. The more the evidence, the better.
5. Get 100 percent response or a sampling.
6. Repeat the evaluation at appropriate times.
7. Consider cost versus benefits.
Level three is often harder than level one and level two evaluation
because behavior changes at the workplace are often harder to
measure than reaction and learning directly after the training event.
You must give the behavior time to transfer and collect data at the
workplace.
12. Probably the most common design used for level three evaluation
is the one-group pretest-posttest design (i.e., get a baseline measure
of the behavior you plan on training, train the participants, and
then measure the participants’ behavior again after the training). If
you are able to include a control group, you will be able to use the
pretest-posttest nonequivalent control group design (i.e., in
addition to measuring the training participants before and after the
training, you also find a set of similar people, who do not undergo
training for the control group, and you measure these control group
participants’ behavior before and after the training program).
Earlier (above) I showed the comparisons you make for the
different designs during data analysis.
In the one-group pretest-posttest design the estimate of the
counterfactual (i.e., what would have happened to the participants
if they had not participated in the training) is the participants’
pretest measure. In the pretest-posttest nonequivalent control group
design, the estimate of the counterfactual is the change taking
place in the control group. Remember: you want the change in the
training group to be greater than the counterfactual change.
Note that it would be really nice to be able to use the randomized
pretest-posttest control group design; however, usually, random
assignment to the training and nontraining groups will not be
feasible.
Kirkpartick also discusses another popular design for measuring
transfer of learning (i.e., for measuring level three outcomes). He
never labels the approach, but it is formally called the
retrospective survey design. He points out that you can survey
(using questionnaires or interviews) the training participants, the
participants’ supervisors or managers, and the participants’
subordinates. The design is called a “retrospective” design because
you are asking the participants (or the others) to think back (i.e., in
retrospect) to their behavior before the training program and then
13. compare it to their current level of behavior, and, finally, to decide
if the behavior has changed. You should ask for specific examples
behavior changes. You can also use the retrospective survey design
with the training participants’ managers and subordinates, asking
them if the participant’s behavior has changed. The more
corroboration you get across the different sources, the stronger the
evidence of transfer.
The retrospective survey design is generally is a weaker design
than the experimental designs discussed earlier because the actual
pretest behavior is not measured directly. However, the
retrospective survey can still provide useful and sometimes
convincing data. Kirkpatrick speaks highly of the retrospective
design, probably because it is so simple to carry out and because it
tends to be cost effective (i.e., it doesn’t cost a lot of money to
administer questionnaires). Kirkpartick gives a couple of actual
forms in Exhibit 6.1 (a retrospective interview) and Exhibit 6.2 (a
retrospective questionnaire).
Here are a few advantages of level three evaluation:
• Provides measurement of actual behavior on the job, rather
than only measuring or demonstrating positive reaction
and/or learning. This is important because you want to have
actual on-the-job results from the training program.
• Level three outcomes are required for level four outcomes
(i.e., they are the intervening variables or factors that lead to
level four outcomes); therefore, it is good news when level
three outcomes are found.
• Most level three outcomes are intrinsically useful, even if
level four outcomes (i.e., final organizational or business
results) are never fully demonstrated (e.g., it is useful to have
managers who are effective listeners and supportive, or
14. employees who know how to do basic work on their
computers, or employees who act respectfully toward
employees from different ethnic or cultural groups).
• In many situations, evidence of level one outcomes, level two
outcomes, and level three outcomes will be sufficient
evidence of the merit and usefulness of a training program.
This is especially true when all of these provide evidence of
positive results of the training program.
Level 4—Results
Here your goal is to find out if the training program led to final
results, especially business results that contribute to the “bottom
line” (i.e., business profits). Level four outcomes are not limited
return on training investment (ROI). Level four outcomes can
include other major results that contribute to the well functioning
of an organization. Level four includes any outcome that most
people would agree is “good for the business.” Level four
outcomes are either changes in financial outcomes (such as
positive ROI or increased profits) or changes in variables that
should have a relatively direct effect on financial outcomes at some
point in the future.
Here are some examples of different kinds of level four outcomes:
• Improved quality of work.
• Higher productivity.
• Reduction in turnover.
• Reduction in scrap rate (i.e., less wasted resources).
• Improved quality of work life.
15. • Improved human relations (e.g., improved vertical and
horizontal communication)
• Increased sales.
• Fewer grievances.
• Lower absenteeism.
• Higher worker morale.
• Fewer accidents.
• Greater job satisfaction.
• Increased profits.
Here are Kirkpartick’s recommendations for level four evaluation:
1. Use a control group if practical. In other words, use the strongest
experimental design that is feasible.
2. Allow time for results to be achieved. In other words, many
level four outcomes will take some time to occur.
3. Measure both before and after the program if practical. Again,
use the strongest experimental design that is feasible.
4. Repeat the measurement at appropriate times. Repeated
measurement (e.g., using the time-series design) can provide data
on the long term pattern of results.
16. 5. Consider costs versus benefits. You may not want to perform a
level four evaluation if the costs of that evaluation are high in
comparison to the potential benefits or impacts of the training
program.
Level four evaluation is difficult in the sense that it is quite
difficult to establish firm evidence that a training program was the
key or only source that produced the level four outcomes. For
example, time has to elapse after the training program in order for
these outcomes to occur. Other factors may also occur during that
time period. Second, it is hard to isolate the effect of the training
program because there are usually many additional causal variables
operating on the level four outcome variables (i.e., the training
event is just one of many potential causes). Level four outcomes
are often more distal outcomes, rather than proximal outcomes of a
training program. For these reasons, the evidence obtained from
level four evaluation is usually weaker than the evidence obtained
from lower level evaluations, especially levels one and two which
are relatively easy to document.
For an example of distal, level four outcomes (increased
productivity and profits) here is a potential outcome line that ends
with the level four results:
Program Reactions Learning Behavior Productivity
Increased profits.
Level four outcomes tend to fall far down outcome lines, which
means that many intervening factors must take place in order for
the level four outcomes to take place. This means that we should
not be overly optimistic in expecting large level four outcomes
from single training programs.
In general, we should try to develop an impact theory to help us to
understand the operation of level four outcomes. If you really want
17. a training program to have a positive level four outcome, it is
probably wise to make the training program a component of a
larger organizational performance program package that is
designed to produce level four changes.
A common design for documenting level four outcomes is the
interrupted time-series design, although the other experimental
designs with control groups are also frequently called for,
depending on the kinds of outcomes you want to measure. For
example, some data are frequently recorded at regular intervals
(sales, turnover, accidents) making these variables easy to measure
over time forming time-series data (you just have to get these
secondary data). Other level four results will be more difficult to
obtain because pre-training data may not be available (e.g., data on
worker morale, quality of work life, improved communication). If
pre-training data are not routinely recorded, you will have to make
sure the data are recorded at least once before the training event is
implemented. If the data are recorded multiple times before the
training event, the interrupted time-series design may be used. If
data are recorded only once before the training event, the one
group pretest-posttest design is possible, or, even better, the
pretest-posttest nonequivalent control group design may be
feasible.