More Related Content
Similar to Cb legislative session january 2013 crosstabs pt 2
Similar to Cb legislative session january 2013 crosstabs pt 2 (20)
More from Honolulu Civil Beat
More from Honolulu Civil Beat (20)
Cb legislative session january 2013 crosstabs pt 2
- 1. 1
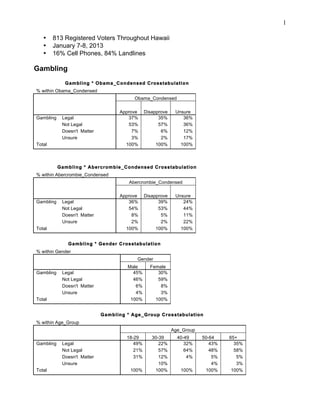
• 813 Registered Voters Throughout Hawaii
• January 7-8, 2013
• 16% Cell Phones, 84% Landlines
Gambling
Gambling * Obama_Condensed Crosstabulation
% within Obama_Condensed
Obama_Condensed
Approve Disapprove Unsure
Gambling Legal 37% 35% 36%
Not Legal 53% 57% 36%
Doesn't Matter 7% 6% 12%
Unsure 3% 2% 17%
Total 100% 100% 100%
Gambling * Abercrombie_Condensed Crosstabulation
% within Abercrombie_Condensed
Abercrombie_Condensed
Approve Disapprove Unsure
Gambling Legal 36% 39% 24%
Not Legal 54% 53% 44%
Doesn't Matter 8% 5% 11%
Unsure 2% 2% 22%
Total 100% 100% 100%
Gambling * Gender Crosstabulation
% within Gender
Gender
Male Female
Gambling Legal 45% 30%
Not Legal 46% 59%
Doesn't Matter 6% 8%
Unsure 4% 3%
Total 100% 100%
Gambling * Age_Group Crosstabulation
% within Age_Group
Age_Group
18-29 30-39 40-49 50-64 65+
Gambling Legal 49% 22% 32% 43% 35%
Not Legal 21% 57% 64% 48% 58%
Doesn't Matter 31% 12% 4% 5% 5%
Unsure 10% 4% 3%
Total 100% 100% 100% 100% 100%
- 2. 2
Gambling * Race_Ethncity Crosstabulation
% within Race_Ethncity
Race_Ethncity
Caucasian Japanese Filipino Hawaiian Chinese Hispanic/Latino Other/Mixed
Gambling Legal 38% 33% 35% 41% 34% 71% 35%
Not Legal 53% 58% 49% 54% 56% 14% 51%
Doesn't Matter 6% 6% 13% 2% 5% 14% 11%
Unsure 2% 4% 3% 4% 5% 3%
Total 100% 100% 100% 100% 100% 100% 100%
Gambling * PhoneType Crosstabulation
% within PhoneType
PhoneType
Both Cell Landline
Gambling Legal 36% 46% 33%
Not Legal 56% 33% 49%
Doesn't Matter 5% 18% 11%
Unsure 3% 3% 7%
Total 100% 100% 100%
Gambling * Politics Crosstabulation
% within Politics
Politics
Liberal/Progressive Moderate Conservative Unsure
Gambling Legal 34% 42% 33% 38%
Not Legal 59% 51% 59% 40%
Doesn't 4% 7% 7% 13%
Matter
Unsure 3% 1% 2% 9%
Total 100% 100% 100% 100%
Gambling * Party_ID Crosstabulation
% within Party_ID
Party_ID
Democrat Republican Independent Unsure
Gambling Legal 35% 33% 40% 45%
Not Legal 55% 57% 53% 17%
Doesn't Matter 7% 9% 4% 21%
Unsure 3% 2% 2% 17%
Total 100% 100% 100% 100%
- 3. 3
Gambling * Education Crosstabulation
% within Education
Education
High
No School College Graduate
degree Degree Degree Degree
Gambling Legal 44% 40% 39% 29%
Not Legal 19% 51% 54% 60%
Doesn't Matter 19% 7% 6% 6%
Unsure 19% 3% 1% 6%
Total 100% 100% 100% 100%
Gambling * Relationship Crosstabulation
% within Relationship
Relationship
Married Partner Single Div/Sep Widowed
Gambling Legal 37% 62% 32% 37% 32%
Not Legal 56% 27% 49% 52% 59%
Doesn't Matter 4% 12% 14% 7% 8%
Unsure 3% 5% 5% 1%
Total 100% 100% 100% 100% 100%
Gambling * Military_Family Crosstabulation
% within Military_Family
Military_Family
Yes No
Gambling Legal 33% 38%
Not Legal 56% 52%
Doesn't Matter 8% 7%
Unsure 3% 3%
Total 100% 100%
Gambling * Union_Household Crosstabulation
% within Union_Household
Union_Household
Yes No
Gambling Legal 38% 36%
Not Legal 53% 53%
Doesn't Matter 5% 7%
Unsure 4% 3%
Total 100% 100%
- 4. 4
Gambling * Income Crosstabulation
% within Income
Income
$50,000 $50,000- $100,000
or Less $100,000 or More
Gambling Legal 34% 38% 35%
Not Legal 54% 51% 60%
Doesn't Matter 9% 7% 3%
Unsure 3% 3% 2%
Total 100% 100% 100%
Gambling * Voted2008 Crosstabulation
% within Voted2008
Voted2008
No Yes
Gambling Legal 43% 35%
Not Legal 42% 56%
Doesn't Matter 11% 6%
Unsure 5% 4%
Total 100% 100%
Gambling * Voted2010 Crosstabulation
% within Voted2010
Voted2010
No Yes
Gambling Legal 44% 35%
Not Legal 46% 55%
Doesn't Matter 5% 7%
Unsure 6% 3%
Total 100% 100%
- 5. 5
Casino * Obama_Condensed Crosstabulation
% within Obama_Condensed
Obama_Condensed
Approve Disapprove Unsure
Casino Support 32% 27% 16%
Oppose 59% 66% 42%
Doesn't Matter 6% 4% 28%
Unsure 3% 2% 14%
Total 100% 100% 100%
Casino * Abercrombie_Condensed Crosstabulation
% within Abercrombie_Condensed
Abercrombie_Condensed
Approve Disapprove Unsure
Casino Support 34% 26% 20%
Oppose 59% 63% 45%
Doesn't Matter 4% 8% 15%
Unsure 2% 3% 20%
Total 100% 100% 100%
Casino * Gender Crosstabulation
% within Gender
Gender
Male Female
Casino Support 35% 25%
Oppose 55% 64%
Doesn't Matter 6% 7%
Unsure 4% 3%
Total 100% 100%
Casino * Age_Group Crosstabulation
% within Age_Group
Age_Group
18-29 30-39 40-49 50-64 65+
Casino Support 51% 28% 31% 31% 26%
Oppose 23% 53% 67% 60% 65%
Doesn't Matter 26% 3% 2% 5% 6%
Unsure 15% 4% 2%
Total 100% 100% 100% 100% 100%
- 6. 6
Casino * Race_Ethncity Crosstabulation
% within Race_Ethncity
Race_Ethncity
Caucasian Japanese Filipino Hawaiian Chinese Hispanic/Latino Other/Mixed
Casino Support 36% 15% 40% 28% 31% 38% 27%
Oppose 58% 74% 50% 62% 56% 38% 60%
Doesn't Matter 4% 7% 5% 8% 10% 13% 9%
Unsure 2% 4% 6% 2% 3% 13% 5%
Total 100% 100% 100% 100% 100% 100% 100%
Casino * PhoneType Crosstabulation
% within PhoneType
PhoneType
Both Cell Landline
Casino Support 26% 51% 39%
Oppose 63% 43% 50%
Doesn't Matter 7% 3% 9%
Unsure 4% 3% 2%
Total 100% 100% 100%
Casino * Politics Crosstabulation
% within Politics
Politics
Liberal/Progressive Moderate Conservative Unsure
Casino Support 31% 33% 25% 29%
Oppose 62% 59% 66% 50%
Doesn't Matter 3% 6% 4% 17%
Unsure 4% 2% 5% 4%
Total 100% 100% 100% 100%
Casino * Party_ID Crosstabulation
% within Party_ID
Party_ID
Democrat Republican Independent Unsure
Casino Support 30% 28% 30% 39%
Oppose 60% 68% 62% 14%
Doesn't Matter 7% 2% 7% 25%
Unsure 4% 2% 2% 21%
Total 100% 100% 100% 100%
- 7. 7
Casino * Education Crosstabulation
% within Education
Education
High
No School College Graduate
degree Degree Degree Degree
Casino Support 38% 29% 31% 26%
Oppose 44% 60% 59% 64%
Doesn't Matter 8% 7% 6%
Unsure 19% 3% 3% 4%
Total 100% 100% 100% 100%
Casino * Relationship Crosstabulation
% within Relationship
Relationship
Married Partner Single Div/Sep Widowed
Casino Support 29% 54% 26% 36% 21%
Oppose 62% 38% 56% 59% 64%
Doesn't Matter 4% 14% 5% 10%
Unsure 4% 8% 4% 5%
Total 100% 100% 100% 100% 100%
Casino * Military_Family Crosstabulation
% within Military_Family
Military_Family
Yes No
Casino Support 26% 30%
Oppose 66% 59%
Doesn't Matter 4% 8%
Unsure 4% 4%
Total 100% 100%
Casino * Union_Household Crosstabulation
% within Union_Household
Union_Household
Yes No
Casino Support 31% 29%
Oppose 61% 60%
Doesn't Matter 6% 7%
Unsure 3% 4%
Total 100% 100%
- 8. 8
Casino * Income Crosstabulation
% within Income
Income
$50,000 $50,000- $100,000
or Less $100,000 or More
Casino Support 34% 27% 22%
Oppose 58% 58% 71%
Doesn't Matter 3% 10% 6%
Unsure 4% 4% 1%
Total 100% 100% 100%
Casino * Voted2008 Crosstabulation
% within Voted2008
Voted2008
No Yes
Casino Support 38% 27%
Oppose 45% 64%
Doesn't Matter 11% 6%
Unsure 6% 3%
Total 100% 100%
Casino * Voted2010 Crosstabulation
% within Voted2010
Voted2010
No Yes
Casino Support 38% 26%
Oppose 47% 64%
Doesn't Matter 6% 7%
Unsure 9% 3%
Total 100% 100%
- 9. 9
Lottery * Obama_Condensed Crosstabulation
% within Obama_Condensed
Obama_Condensed
Approve Disapprove Unsure
Lottery Support 55% 60% 60%
Oppose 35% 32% 19%
Doesn't Matter 6% 3% 10%
Unsure 4% 5% 12%
Total 100% 100% 100%
Lottery * Abercrombie_Condensed Crosstabulation
% within Abercrombie_Condensed
Abercrombie_Condensed
Approve Disapprove Unsure
Lottery Support 60% 57% 42%
Oppose 32% 34% 33%
Doesn't Matter 6% 3% 7%
Unsure 2% 6% 18%
Total 100% 100% 100%
Lottery * Gender Crosstabulation
% within Gender
Gender
Male Female
Lottery Support 65% 52%
Oppose 29% 36%
Doesn't Matter 4% 6%
Unsure 3% 6%
Total 100% 100%
Lottery * Age_Group Crosstabulation
% within Age_Group
Age_Group
18-29 30-39 40-49 50-64 65+
Lottery Support 64% 55% 58% 66% 51%
Oppose 21% 33% 32% 27% 38%
Doesn't Matter 8% 4% 3% 8%
Unsure 8% 12% 5% 4% 3%
Total 100% 100% 100% 100% 100%
- 10. 10
Lottery * Race_Ethncity Crosstabulation
% within Race_Ethncity
Race_Ethncity
Caucasian Japanese Filipino Hawaiian Chinese Hispanic/Latino Other/Mixed
Lottery Support 59% 58% 59% 63% 51% 75% 53%
Oppose 32% 27% 33% 31% 38% 13% 39%
Doesn't Matter 4% 8% 2% 2% 5% 13% 6%
Unsure 5% 6% 6% 4% 7% 1%
Total 100% 100% 100% 100% 100% 100% 100%
Lottery * PhoneType Crosstabulation
% within PhoneType
PhoneType
Both Cell Landline
Lottery Support 59% 63% 50%
Oppose 33% 27% 34%
Doesn't Matter 4% 4% 11%
Unsure 5% 6% 5%
Total 100% 100% 100%
Lottery * Politics Crosstabulation
% within Politics
Politics
Liberal/Progressive Moderate Conservative Unsure
Lottery Support 50% 60% 61% 63%
Oppose 39% 32% 34% 19%
Doesn't Matter 5% 5% 2% 9%
Unsure 6% 4% 3% 9%
Total 100% 100% 100% 100%
Lottery * Party_ID Crosstabulation
% within Party_ID
Party_ID
Democrat Republican Independent Unsure
Lottery Support 54% 64% 61% 71%
Oppose 35% 32% 31% 7%
Doesn't Matter 6% 1% 5% 4%
Unsure 5% 4% 4% 18%
Total 100% 100% 100% 100%
- 11. 11
Lottery * Education Crosstabulation
% within Education
Education
High
No School College Graduate
degree Degree Degree Degree
Lottery Support 53% 63% 59% 53%
Oppose 20% 32% 29% 38%
Doesn't Matter 20% 3% 6% 3%
Unsure 7% 2% 6% 6%
Total 100% 100% 100% 100%
Lottery * Relationship Crosstabulation
% within Relationship
Relationship
Married Partner Single Div/Sep Widowed
Lottery Support 58% 72% 63% 63% 51%
Oppose 34% 8% 26% 33% 35%
Doesn't Matter 3% 12% 5% 3% 9%
Unsure 5% 8% 7% 5%
Total 100% 100% 100% 100% 100%
Lottery * Military_Family Crosstabulation
% within Military_Family
Military_Family
Yes No
Lottery Support 56% 59%
Oppose 32% 32%
Doesn't Matter 7% 4%
Unsure 5% 5%
Total 100% 100%
Lottery * Union_Household Crosstabulation
% within Union_Household
Union_Household
Yes No
Lottery Support 62% 58%
Oppose 30% 33%
Doesn't Matter 3% 5%
Unsure 5% 5%
Total 100% 100%
- 12. 12
Lottery * Income Crosstabulation
% within Income
Income
$50,000 $50,000- $100,000
or Less $100,000 or More
Lottery Support 55% 65% 51%
Oppose 34% 24% 43%
Doesn't Matter 7% 2% 3%
Unsure 3% 8% 3%
Total 100% 100% 100%
Lottery * Voted2008 Crosstabulation
% within Voted2008
Voted2008
No Yes
Lottery Support 62% 55%
Oppose 31% 35%
Doesn't Matter 2% 5%
Unsure 6% 5%
Total 100% 100%
Lottery * Voted2010 Crosstabulation
% within Voted2010
Voted2010
No Yes
Lottery Support 55% 56%
Oppose 34% 35%
Doesn't Matter 1% 5%
Unsure 10% 4%
Total 100% 100%
- 13. 13
Gambling * Casino Crosstabulation
% within Casino
Casino
Doesn't
Support Oppose Matter Unsure
Gambling Legal 73% 19% 48% 19%
Not Legal 15% 77% 17% 33%
Doesn't Matter 10% 3% 25% 15%
Unsure 2% 2% 10% 33%
Total 100% 100% 100% 100%
Gambling * Lottery Crosstabulation
% within Lottery
Lottery
Doesn't
Support Oppose Matter Unsure
Gambling Legal 57% 9% 16%
Not Legal 31% 87% 54% 68%
Doesn't Matter 8% 3% 22% 6%
Unsure 3% 1% 8% 26%
Total 100% 100% 100% 100%
% within Gambling
Gambling
Not Doesn't
Legal Legal Matter Unsure
Casino Support 59% 8% 41% 19%
Oppose 30% 87% 27% 27%
Doesn't Matter 9% 2% 24% 19%
Unsure 2% 2% 8% 35%
Total 100% 100% 100% 100%
Casino * Lottery Crosstabulation
% within Lottery
Lottery
Doesn't
Support Oppose Matter Unsure
Casino Support 45% 8% 24% 3%
Oppose 42% 90% 54% 62%
Doesn't Matter 10% 1% 16%
Unsure 2% 1% 5% 35%
Total 100% 100% 100% 100%
- 14. 14
Lottery * Gambling Crosstabulation
% within Gambling
Gambling
Not Doesn't
Legal Legal Matter Unsure
Lottery Support 89% 34% 66% 48%
Oppose 8% 55% 14% 7%
Doesn't Matter 2% 5% 16% 11%
Unsure 6% 4% 33%
Total 100% 100% 100% 100%
Lottery * Casino Crosstabulation
% within Casino
Casino
Doesn't
Support Oppose Matter Unsure
Lottery Support 87% 40% 84% 37%
Oppose 9% 50% 4% 11%
Doesn't Matter 4% 5% 12% 7%
Unsure 0% 5% 44%
Total 100% 100% 100% 100%
- 15. 29
Elections by Mail
VoteByMail * Obama_Condensed Crosstabulation
% within Obama_Condensed
Obama_Condensed
Approve Disapprove Unsure
VoteByMail Yes 52% 40% 26%
No 33% 42% 26%
Doesn't Matter 8% 12% 29%
Unsure 6% 6% 19%
Total 100% 100% 100%
VoteByMail * Abercrombie_Condensed Crosstabulation
% within Abercrombie_Condensed
Abercrombie_Condensed
Approve Disapprove Unsure
VoteByMail Yes 54% 42% 35%
No 34% 39% 18%
Doesn't Matter 7% 11% 24%
Unsure 5% 7% 24%
Total 100% 100% 100%
VoteByMail * Gender Crosstabulation
% within Gender
Gender
Male Female
VoteByMail Yes 53% 44%
No 33% 36%
Doesn't Matter 7% 13%
Unsure 6% 8%
Total 100% 100%
% within Age_Group
Age_Group
18-29 30-39 40-49 50-64 65+
VoteByMail Yes 33% 46% 51% 45% 52%
No 41% 32% 37% 38% 32%
Doesn't Matter 18% 8% 8% 10% 10%
Unsure 8% 14% 4% 7% 6%
Total 100% 100% 100% 100% 100%
- 16. 30
% within Race_Ethncity
Race_Ethncity
Caucasian Japanese Filipino Hawaiian Chinese Hispanic/Latino Other/Mixed
VoteByMail Yes 56% 54% 28% 40% 48% 57% 44%
No 32% 29% 45% 38% 35% 29% 40%
Doesn't Matter 7% 7% 19% 15% 8% 14% 12%
Unsure 5% 10% 8% 8% 8% 4%
Total 100% 100% 100% 100% 100% 100% 100%
VoteByMail * PhoneType Crosstabulation
% within PhoneType
PhoneType
Both Cell Landline
VoteByMail Yes 47% 51% 49%
No 34% 42% 32%
Doesn't Matter 11% 6% 7%
Unsure 7% 1% 12%
Total 100% 100% 100%
VoteByMail * Politics Crosstabulation
% within Politics
Politics
Liberal/Progressive Moderate Conservative Unsure
VoteByMail Yes 54% 47% 47% 40%
No 33% 35% 41% 30%
Doesn't 6% 13% 7% 17%
Matter
Unsure 7% 5% 5% 13%
Total 100% 100% 100% 100%
VoteByMail * Party_ID Crosstabulation
% within Party_ID
Party_ID
Democrat Republican Independent Unsure
VoteByMail Yes 53% 44% 48% 17%
No 31% 40% 40% 27%
Doesn't Matter 9% 11% 9% 30%
Unsure 8% 5% 3% 27%
Total 100% 100% 100% 100%
- 17. 31
VoteByMail * Education Crosstabulation
% within Education
Education
High
No School College Graduate
degree Degree Degree Degree
VoteByMail Yes 50% 47% 46% 50%
No 25% 34% 37% 34%
Doesn't Matter 6% 13% 12% 6%
Unsure 19% 6% 5% 9%
Total 100% 100% 100% 100%
VoteByMail * Relationship Crosstabulation
% within Relationship
Relationship
Married Partner Single Div/Sep Widowed
VoteByMail Yes 46% 54% 47% 58% 46%
No 37% 31% 32% 29% 37%
Doesn't Matter 11% 12% 10% 10% 8%
Unsure 6% 4% 10% 3% 9%
Total 100% 100% 100% 100% 100%
VoteByMail * Military_Family Crosstabulation
% within Military_Family
Military_Family
Yes No
VoteByMail Yes 38% 49%
No 43% 33%
Doesn't Matter 11% 11%
Unsure 8% 7%
Total 100% 100%
VoteByMail * Union_Household Crosstabulation
% within Union_Household
Union_Household
Yes No
VoteByMail Yes 51% 47%
No 34% 36%
Doesn't Matter 10% 11%
Unsure 5% 7%
Total 100% 100%
- 18. 32
VoteByMail * Income Crosstabulation
% within Income
Income
$50,000 $50,000- $100,000
or Less $100,000 or More
VoteByMail Yes 41% 48% 56%
No 41% 33% 31%
Doesn't Matter 11% 12% 9%
Unsure 7% 7% 4%
Total 100% 100% 100%
VoteByMail * Voted2008 Crosstabulation
% within Voted2008
Voted2008
No Yes
VoteByMail Yes 44% 47%
No 36% 35%
Doesn't Matter 15% 10%
Unsure 5% 8%
Total 100% 100%
VoteByMail * Voted2010 Crosstabulation
% within Voted2010
Voted2010
No Yes
VoteByMail Yes 44% 47%
No 33% 35%
Doesn't Matter 11% 11%
Unsure 11% 6%
Total 100% 100%
- 19. 33
Budget Deficit
BudgetDeficit * Obama_Condensed Crosstabulation
% within Obama_Condensed
Obama_Condensed
Approve Disapprove Unsure
BudgetDeficit Excise tax 21% 12% 10%
Retirees 8% 11% 7%
Current employees 23% 35% 14%
Combination 33% 30% 14%
Unsure 15% 12% 55%
Total 100% 100% 100%
BudgetDeficit * Abercrombie_Condensed Crosstabulation
% within Abercrombie_Condensed
Abercrombie_Condensed
Approve Disapprove Unsure
BudgetDeficit Excise tax 18% 18% 11%
Retirees 10% 8% 4%
Current employees 24% 31% 20%
Combination 35% 29% 20%
Unsure 13% 15% 45%
Total 100% 100% 100%
BudgetDeficit * Gender Crosstabulation
% within Gender
Gender
Male Female
BudgetDeficit Excise tax 15% 20%
Retirees 9% 7%
Current employees 28% 25%
Combination 33% 32%
Unsure 16% 17%
Total 100% 100%
BudgetDeficit * Age_Group Crosstabulation
% within Age_Group
Age_Group
18-29 30-39 40-49 50-64 65+
BudgetDeficit Excise tax 8% 20% 24% 16% 18%
Retirees 8% 7% 8% 11%
Current employees 18% 25% 30% 25% 26%
Combination 21% 42% 30% 34% 30%
Unsure 46% 13% 10% 16% 15%
Total 100% 100% 100% 100% 100%
- 20. 34
BudgetDeficit * Race_Ethncity Crosstabulation
% within Race_Ethncity
Race_Ethncity
Caucasian Japanese Filipino Hawaiian Chinese Hispanic/Latino Other/Mixed
BudgetDeficit Excise tax 17% 19% 10% 11% 21% 13% 27%
Retirees 8% 9% 10% 8% 8% 25% 5%
Current 31% 24% 25% 26% 26% 13% 19%
employees
Combination 36% 31% 24% 28% 38% 38% 29%
Unsure 8% 16% 30% 26% 7% 13% 20%
Total 100% 100% 100% 100% 100% 100% 100%
BudgetDeficit * PhoneType Crosstabulation
% within PhoneType
PhoneType
Both Cell Landline
BudgetDeficit Excise tax 18% 16% 16%
Retirees 7% 12% 14%
Current employees 27% 22% 25%
Combination 33% 31% 21%
Unsure 14% 18% 23%
Total 100% 100% 100%
BudgetDeficit * Politics Crosstabulation
% within Politics
Politics
Liberal/Progressive Moderate Conservative Unsure
BudgetDeficit Excise tax 24% 17% 12% 16%
Retirees 2% 9% 12% 11%
Current 28% 29% 32% 10%
employees
Combination 35% 32% 32% 30%
Unsure 10% 13% 12% 33%
Total 100% 100% 100% 100%
BudgetDeficit * Party_ID Crosstabulation
% within Party_ID
Party_ID
Democrat Republican Independent Unsure
BudgetDeficit Excise tax 22% 12% 15% 7%
Retirees 6% 11% 10% 7%
Current 23% 32% 30% 14%
employees
Combination 34% 31% 35% 11%
Unsure 15% 15% 10% 61%
Total 100% 100% 100% 100%
- 21. 35
BudgetDeficit * Education Crosstabulation
% within Education
Education
High
No School College Graduate
degree Degree Degree Degree
BudgetDeficit Excise tax 18% 18% 15% 21%
Retirees 12% 6% 9% 10%
Current employees 6% 24% 29% 26%
Combination 6% 30% 35% 32%
Unsure 59% 22% 12% 11%
Total 100% 100% 100% 100%
BudgetDeficit * Relationship Crosstabulation
% within Relationship
Relationship
Married Partner Single Div/Sep Widowed
BudgetDeficit Excise tax 19% 4% 13% 22% 18%
Retirees 6% 12% 9% 7% 18%
Current employees 28% 40% 22% 32% 19%
Combination 34% 20% 35% 30% 27%
Unsure 14% 24% 21% 10% 18%
Total 100% 100% 100% 100% 100%
BudgetDeficit * Military_Family Crosstabulation
% within Military_Family
Military_Family
Yes No
BudgetDeficit Excise tax 20% 17%
Retirees 7% 9%
Current employees 26% 26%
Combination 31% 32%
Unsure 16% 15%
Total 100% 100%
BudgetDeficit * Union_Household Crosstabulation
% within Union_Household
Union_Household
Yes No
BudgetDeficit Excise tax 28% 13%
Retirees 7% 9%
Current employees 18% 30%
Combination 30% 33%
Unsure 16% 15%
Total 100% 100%
- 22. 36
BudgetDeficit * Income Crosstabulation
% within Income
Income
$50,000 $50,000- $100,000
or Less $100,000 or More
BudgetDeficit Excise tax 18% 17% 20%
Retirees 10% 6% 9%
Current employees 26% 23% 26%
Combination 27% 39% 35%
Unsure 18% 14% 9%
Total 100% 100% 100%
BudgetDeficit * Voted2008 Crosstabulation
% within Voted2008
Voted2008
No Yes
BudgetDeficit Excise tax 9% 18%
Retirees 9% 9%
Current employees 22% 28%
Combination 28% 31%
Unsure 31% 14%
Total 100% 100%
BudgetDeficit * Voted2010 Crosstabulation
% within Voted2010
Voted2010
No Yes
BudgetDeficit Excise tax 10% 18%
Retirees 6% 10%
Current employees 20% 28%
Combination 35% 30%
Unsure 28% 15%
Total 100% 100%
- 23. 37
PLDC
PLDC * Obama_Condensed Crosstabulation
% within Obama_Condensed
Obama_Condensed
Approve Disapprove Unsure
PLDC Abolish 27% 34% 10%
Control 38% 30% 17%
Leave alone 11% 14% 7%
Doesn't matter 7% 11% 10%
Unsure 17% 11% 57%
Total 100% 100% 100%
PLDC * Abercrombie_Condensed Crosstabulation
% within Abercrombie_Condensed
Abercrombie_Condensed
Approve Disapprove Unsure
PLDC Abolish 22% 38% 13%
Control 41% 30% 19%
Leave alone 14% 10% 6%
Doesn't matter 8% 7% 15%
Unsure 14% 15% 48%
Total 100% 100% 100%
PLDC * Gender Crosstabulation
% within Gender
Gender
Male Female
PLDC Abolish 36% 22%
Control 31% 39%
Leave alone 13% 10%
Doesn't matter 8% 8%
Unsure 12% 21%
Total 100% 100%
PLDC * Age_Group Crosstabulation
% within Age_Group
Age_Group
18-29 30-39 40-49 50-64 65+
PLDC Abolish 41% 25% 23% 28% 28%
Control 8% 20% 39% 38% 40%
Leave alone 15% 10% 17% 10% 11%
Doesn't matter 10% 13% 4% 7% 8%
Unsure 26% 32% 17% 17% 13%
Total 100% 100% 100% 100% 100%
- 24. 38
PLDC * Race_Ethncity Crosstabulation
% within Race_Ethncity
Race_Ethncity
Caucasian Japanese Filipino Hawaiian Chinese Hispanic/Latino Other/Mixed
PLDC Abolish 24% 37% 23% 35% 34% 25% 23%
Control 47% 31% 28% 26% 30% 50% 32%
Leave alone 9% 10% 13% 13% 13% 13% 16%
Doesn't matter 7% 6% 14% 7% 7% 7%
Unsure 12% 17% 23% 19% 16% 13% 21%
Total 100% 100% 100% 100% 100% 100% 100%
PLDC * PhoneType Crosstabulation
% within PhoneType
PhoneType
Both Cell Landline
PLDC Abolish 28% 32% 28%
Control 38% 28% 28%
Leave alone 10% 19% 18%
Doesn't matter 7% 12% 7%
Unsure 18% 9% 19%
Total 100% 100% 100%
PLDC * Politics Crosstabulation
% within Politics
Politics
Liberal/Progressive Moderate Conservative Unsure
PLDC Abolish 35% 29% 28% 16%
Control 35% 40% 37% 28%
Leave alone 11% 14% 13% 7%
Doesn't matter 5% 5% 7% 14%
Unsure 13% 12% 15% 34%
Total 100% 100% 100% 100%
PLDC * Party_ID Crosstabulation
% within Party_ID
Party_ID
Democrat Republican Independent Unsure
PLDC Abolish 27% 27% 34% 7%
Control 40% 36% 33% 14%
Leave alone 11% 15% 11% 4%
Doesn't matter 6% 9% 7% 18%
Unsure 16% 13% 14% 57%
Total 100% 100% 100% 100%
- 25. 39
PLDC * Education Crosstabulation
% within Education
Education
High
No School College Graduate
degree Degree Degree Degree
PLDC Abolish 6% 25% 31% 30%
Control 24% 36% 37% 38%
Leave alone 24% 12% 11% 11%
Doesn't matter 12% 7% 8% 4%
Unsure 35% 20% 14% 17%
Total 100% 100% 100% 100%
PLDC * Relationship Crosstabulation
% within Relationship
Relationship
Married Partner Single Div/Sep Widowed
PLDC Abolish 28% 35% 33% 18% 27%
Control 37% 12% 27% 52% 41%
Leave alone 12% 38% 11% 7% 6%
Doesn't matter 6% 8% 9% 8% 10%
Unsure 17% 8% 21% 15% 15%
Total 100% 100% 100% 100% 100%
PLDC * Military_Family Crosstabulation
% within Military_Family
Military_Family
Yes No
PLDC Abolish 26% 28%
Control 37% 36%
Leave alone 8% 12%
Doesn't matter 12% 6%
Unsure 18% 17%
Total 100% 100%
PLDC * Union_Household Crosstabulation
% within Union_Household
Union_Household
Yes No
PLDC Abolish 27% 29%
Control 37% 36%
Leave alone 10% 12%
Doesn't matter 9% 7%
Unsure 18% 16%
Total 100% 100%
- 26. 40
PLDC * Income Crosstabulation
% within Income
Income
$50,000 $50,000- $100,000
or Less $100,000 or More
PLDC Abolish 26% 28% 26%
Control 33% 38% 42%
Leave alone 14% 11% 12%
Doesn't matter 9% 5% 7%
Unsure 19% 17% 14%
Total 100% 100% 100%
PLDC * Voted2008 Crosstabulation
% within Voted2008
Voted2008
No Yes
PLDC Abolish 25% 29%
Control 31% 36%
Leave alone 9% 11%
Doesn't matter 9% 7%
Unsure 26% 17%
Total 100% 100%
PLDC * Voted2010 Crosstabulation
% within Voted2010
Voted2010
No Yes
PLDC Abolish 23% 30%
Control 31% 35%
Leave alone 10% 11%
Doesn't matter 8% 7%
Unsure 28% 17%
Total 100% 100%
- 27. 41
Rail
Rail * Obama_Condensed Crosstabulation
% within Obama_Condensed
Obama_Condensed
Approve Disapprove Unsure
Rail Support 46% 26% 36%
Oppose 45% 66% 36%
Doesn't Matter 6% 5% 10%
Unsure 3% 3% 19%
Total 100% 100% 100%
Rail * Abercrombie_Condensed Crosstabulation
% within Abercrombie_Condensed
Abercrombie_Condensed
Approve Disapprove Unsure
Rail Support 47% 33% 34%
Oppose 44% 60% 38%
Doesn't Matter 7% 4% 13%
Unsure 2% 4% 16%
Total 100% 100% 100%
Rail * Gender Crosstabulation
% within Gender
Gender
Male Female
Rail Support 41% 40%
Oppose 50% 51%
Doesn't Matter 5% 6%
Unsure 4% 3%
Total 100% 100%
Rail * Age_Group Crosstabulation
% within Age_Group
Age_Group
18-29 30-39 40-49 50-64 65+
Rail Support 38% 42% 46% 45% 33%
Oppose 54% 45% 49% 46% 57%
Doesn't Matter 8% 4% 4% 7%
Unsure 8% 5% 5% 3%
Total 100% 100% 100% 100% 100%
- 28. 42
Rail * Race_Ethncity Crosstabulation
% within Race_Ethncity
Race_Ethncity
Caucasian Japanese Filipino Hawaiian Chinese Hispanic/Latino Other/Mixed
Rail Support 36% 40% 40% 33% 32% 29% 54%
Oppose 55% 54% 44% 61% 58% 57% 34%
Doesn't Matter 4% 5% 10% 4% 5% 14% 7%
Unsure 4% 2% 6% 2% 5% 4%
Total 100% 100% 100% 100% 100% 100% 100%
Rail * PhoneType Crosstabulation
% within PhoneType
PhoneType
Both Cell Landline
Rail Support 40% 43% 34%
Oppose 52% 47% 55%
Doesn't Matter 5% 4% 7%
Unsure 3% 6% 4%
Total 100% 100% 100%
Rail * Politics Crosstabulation
% within Politics
Politics
Liberal/Progressive Moderate Conservative Unsure
Rail Support 48% 39% 33% 39%
Oppose 44% 52% 61% 46%
Doesn't Matter 4% 7% 3% 8%
Unsure 4% 2% 3% 7%
Total 100% 100% 100% 100%
Rail * Party_ID Crosstabulation
% within Party_ID
Party_ID
Democrat Republican Independent Unsure
Rail Support 49% 30% 34% 32%
Oppose 42% 63% 57% 54%
Doesn't Matter 5% 4% 7% 11%
Unsure 4% 4% 3% 4%
Total 100% 100% 100% 100%
- 29. 43
Rail * Education Crosstabulation
% within Education
Education
High
No School College Graduate
degree Degree Degree Degree
Rail Support 50% 37% 42% 39%
Oppose 31% 52% 51% 50%
Doesn't Matter 13% 7% 4% 5%
Unsure 6% 4% 2% 6%
Total 100% 100% 100% 100%
Rail * Relationship Crosstabulation
% within Relationship
Relationship
Married Partner Single Div/Sep Widowed
Rail Support 42% 38% 45% 35% 30%
Oppose 50% 62% 43% 55% 60%
Doesn't Matter 5% 8% 5% 6%
Unsure 3% 5% 5% 4%
Total 100% 100% 100% 100% 100%
Rail * Military_Family Crosstabulation
% within Military_Family
Military_Family
Yes No
Rail Support 41% 41%
Oppose 47% 51%
Doesn't Matter 5% 6%
Unsure 8% 3%
Total 100% 100%
Rail * Union_Household Crosstabulation
% within Union_Household
Union_Household
Yes No
Rail Support 49% 37%
Oppose 42% 54%
Doesn't Matter 3% 7%
Unsure 5% 3%
Total 100% 100%
- 30. 44
Rail * Income Crosstabulation
% within Income
Income
$50,000 $50,000- $100,000
or Less $100,000 or More
Rail Support 41% 38% 49%
Oppose 49% 52% 46%
Doesn't Matter 8% 4% 2%
Unsure 2% 5% 3%
Total 100% 100% 100%
Rail * Voted2008 Crosstabulation
% within Voted2008
Voted2008
No Yes
Rail Support 47% 39%
Oppose 39% 52%
Doesn't Matter 8% 6%
Unsure 6% 4%
Total 100% 100%
Rail * Voted2010 Crosstabulation
% within Voted2010
Voted2010
No Yes
Rail Support 41% 39%
Oppose 40% 52%
Doesn't Matter 8% 5%
Unsure 10% 3%
Total 100% 100%