SlideShare a Scribd company logo
1 of 5
Download to read offline
Geography         Percent HS Percent HS Percent Percent          Percent    Percent Percent Post- Percent Post- Percent
                         graduates   graduates   change Bachelor       Bachelor   change    Graduate      Graduate    change
                        (2009 ACS) (2000 Census)         (2009 ACS) (2000 Census)          (2009 ACS) (2000 Census)
United States                84.6%        80.4%     5.2%      27.5%        24.4% 12.8%           10.1%          8.9% 14.2%
Northeast Region             86.3%        81.6%     5.8%      31.6%        27.5% 15.1%           12.8%         11.0% 16.2%
Midwest Region               87.3%        83.5%     4.6%      25.9%        22.9% 13.3%            9.2%          7.9% 16.1%
South Region                 82.5%        77.7%     6.2%      25.4%        22.5% 12.8%            9.1%          8.1% 13.5%
West Region                  83.8%        80.5%     4.1%      29.1%        26.2% 10.8%           10.3%          9.2% 12.5%
Hawaii                       89.5%        84.6%     5.8%      29.2%        26.2% 11.5%            9.7%          8.4% 15.1%
Hawaii County                90.1%        84.6%     6.5%      26.2%        22.1% 18.8%            8.1%          7.5%     8.9%
Honolulu County              89.7%        84.8%     5.7%      30.7%        27.9% 10.2%           10.4%          9.0% 16.4%
Kauai County                 88.1%        83.3%     5.8%      23.5%        19.4% 21.0%            7.1%          6.1% 15.7%
Maui County                  88.3%        83.4%     5.9%      25.8%        22.4% 14.8%            8.0%          6.8% 17.9%
Barbers Point Housing         100%         100%     0.0%      27.3%        65.7% -58.5%           9.1%         45.7% -80.1%
Hickam Housing               99.1%        97.3%     1.9%      48.9%        36.0% 35.7%           21.0%         17.8% 18.0%
Kaneohe Station              98.6%        97.6%     1.1%      27.3%        24.1% 13.4%            5.0%          5.0%     0.5%
Kawela Bay                   98.4%        97.0%     1.5%      44.4%        49.5% -10.3%          17.9%         18.0%    -0.9%
Laie                         98.2%        89.4%     9.9%      40.1%        36.8%     9.0%        16.2%         12.7% 27.9%
Puako                        98.0%        95.6%     2.5%      53.2%        34.3% 55.2%           23.3%         13.8% 69.0%
Poipu                        97.8%        96.6%     1.2%      49.1%        34.6% 42.0%           24.7%         12.1% 104.5%
Laupahoehoe                  97.5%        76.9% 26.8%         29.4%         9.1% 223.2%          10.4%          2.1% 394.3%
Wheeler AFB                  97.5%        98.2%    -0.7%      26.4%        19.3% 36.8%            5.3%          5.7%    -6.1%
Iroquois Point               97.4%        99.4%    -2.0%      24.2%        25.0%    -3.3%         7.7%         12.6% -39.0%
Maalaea                      97.3%        94.5%     2.9%      47.5%        38.9% 22.1%           25.7%         18.5% 38.9%
Ahuimanu                     97.2%        93.2%     4.3%      40.9%        37.2%     9.9%        15.9%         12.5% 27.3%
Kaaawa                       97.2%        90.4%     7.5%      38.0%        27.8% 36.7%           19.2%         13.9% 38.2%
Kaanapali                    96.9%        97.4%    -0.5%      49.7%        46.8%     6.2%        18.8%         17.2%     9.0%
Princeville                  96.7%        96.5%     0.3%      43.4%        44.5%    -2.5%        12.9%         18.9% -31.7%
Kalihiwai                    96.5%        93.3%     3.5%      50.7%        34.6% 46.4%           21.2%         14.1% 50.9%
Wailua Homesteads            96.5%        90.1%     7.0%      30.7%        25.9% 18.5%           11.5%          7.4% 55.2%
Wailea-Makena                95.9%        94.1%     1.9%      45.4%        37.5% 20.9%           14.7%         15.3%    -3.7%
Pupukea                      95.8%        90.4%     5.9%      27.7%        33.8% -17.9%           7.9%         11.3% -30.5%
Mililani Town                95.4%        94.3%     1.2%      33.4%        31.8%     4.9%         9.6%          9.8%    -2.2%
Kealakekua                   95.3%        82.6% 15.4%         28.9%        20.1% 43.7%            5.0%          4.6%     7.9%
Hawaiian Acres               95.3%        86.8%     9.8%      27.1%        23.1% 17.3%            5.9%          3.7% 60.7%
Honaunau-Napoopoo            95.2%        82.2% 15.9%         19.5%        24.1% -19.0%           6.8%          9.1% -26.2%
Geography          Percent HS Percent HS Percent Percent          Percent      Percent Percent Post- Percent Post- Percent
                          graduates   graduates   change Bachelor       Bachelor     change    Graduate      Graduate    change
                         (2009 ACS) (2000 Census)         (2009 ACS) (2000 Census)            (2009 ACS) (2000 Census)
Ewa Gentry                    95.1%        86.4% 10.1%         33.4%        28.8%      16.1%         9.2%          3.8% 140.1%
Schofield Barracks            95.0%        96.1%    -1.2%      22.8%        16.8%      35.7%         8.3%          5.5% 51.7%
Kailua (Honolulu County)      94.9%        92.8%     2.2%      42.6%        39.4%       8.1%        18.7%         15.5% 20.7%
Heeia                         94.8%        94.7%     0.1%      37.8%        41.2%      -8.2%        17.4%         15.0% 15.9%
Waikoloa Village              94.7%        91.7%     3.3%      34.4%        23.9%      43.9%         8.4%          6.7% 25.3%
Holualoa                      94.3%        89.7%     5.2%      32.1%        27.9%      14.9%         8.3%         11.0% -24.7%
Maunaloa                      94.3%        77.5% 21.7%          5.1%         0.0%    N/A             2.5%          0.0% N/A
Kalaoa                        94.2%        89.3%     5.5%      24.2%        25.9%      -6.6%         7.7%          7.6%     1.0%
Mokuleia                      94.1%        90.7%     3.8%      39.2%        36.3%       7.9%        12.8%         13.8%    -7.3%
Volcano                       93.7%        86.9%     7.8%      33.9%        33.6%       0.9%        13.5%         12.4%     8.8%
Kapalua                       93.5%        93.2%     0.3%      44.0%        46.9%      -6.2%        12.3%         17.3% -28.8%
Mountain View                 93.4%        77.0% 21.3%         23.6%        10.9%     116.7%         5.5%          3.4% 60.8%
Haiku-Pauwela                 93.4%        88.6%     5.4%      26.5%        24.6%       7.9%        11.2%          8.3% 34.8%
Makakilo City                 93.3%        90.1%     3.5%      27.6%        26.3%       5.2%         8.9%          6.8% 30.7%
Hanalei                       93.2%        82.8% 12.5%         22.5%        21.7%       3.9%         4.6%          7.0% -33.7%
Maunawili                     92.7%        91.8%     1.1%      46.5%        44.1%       5.4%        22.4%         20.2% 10.8%
Waimalu                       92.7%        90.6%     2.4%      35.0%        32.4%       7.9%        10.2%         10.0%     2.1%
Kahaluu                       92.3%        86.3%     7.1%      29.4%        29.3%       0.4%        11.4%         11.4%     0.3%
Waipio                        92.3%        89.8%     2.8%      24.5%        28.1%     -12.9%         4.8%          6.5% -26.3%
Hawaiian Paradise Park        92.1%        84.9%     8.4%      19.9%        20.1%      -0.8%         6.5%          6.2%     5.4%
Kahaluu-Keauhou               92.0%        93.3%    -1.4%      39.5%        34.4%      14.8%        14.7%         11.5% 28.1%
Pukalani                      91.7%        89.2%     2.8%      26.7%        25.7%       3.8%         8.5%          9.8% -13.5%
Halaula                       91.6%        79.8% 14.8%         12.4%        11.0%      12.6%         2.6%          2.5%     3.1%
Kaneohe                       91.5%        89.7%     2.1%      30.7%        29.5%       4.2%         9.6%          9.8%    -1.4%
Wailua                        91.4%        85.8%     6.6%      23.2%        21.8%       6.5%         7.1%          5.2% 35.9%
Paukaa                        91.4%        81.6% 12.0%         37.0%        24.3%      52.4%        18.8%          8.8% 114.5%
Omao                          91.3%        87.5%     4.4%      28.7%        16.2%      77.9%        10.8%          5.7% 90.2%
Pearl City                    91.2%        86.7%     5.2%      22.5%        20.1%      12.0%         6.0%          4.7% 25.9%
Hawi                          91.1%        88.3%     3.1%      14.6%        14.4%       1.7%         1.5%          2.4% -37.0%
Lawai                         91.1%        84.9%     7.2%      30.5%        22.2%      37.4%         8.3%          6.4% 30.3%
Makaha Valley                 91.0%        87.6%     3.9%      19.1%        12.7%      49.9%         9.0%          4.4% 103.8%
Kalaheo                       91.0%        85.1%     6.9%      23.1%        20.5%      12.8%         7.3%          7.3%     1.0%
Waimea (Hawaii County)        90.8%        88.6%     2.5%      26.4%        27.1%      -2.5%        10.5%         10.1%     4.2%
Geography          Percent HS Percent HS Percent Percent          Percent      Percent Percent Post- Percent Post- Percent
                          graduates   graduates   change Bachelor       Bachelor     change    Graduate      Graduate    change
                         (2009 ACS) (2000 Census)         (2009 ACS) (2000 Census)            (2009 ACS) (2000 Census)
Hawaiian Ocean View           90.6%        87.2%     3.9%      28.2%        16.8%      67.8%         9.1%          6.1% 48.3%
Hawaiian Beaches              90.5%        82.4%     9.9%      13.4%         8.1%      66.2%         0.9%          3.6% -73.9%
Ainaloa                       90.4%        85.4%     5.9%      14.5%        10.4%      38.6%         4.0%          4.2%    -4.9%
Waimanalo Beach               90.4%        82.3%     9.9%      16.2%        12.0%      35.3%         7.1%          5.0% 40.9%
Nanawale Estates              90.4%        75.3% 20.1%         26.8%         9.0%     199.5%         6.7%          1.8% 274.4%
Wailuku                       90.1%        82.1%     9.8%      27.3%        21.6%      26.3%        11.3%          7.0% 61.5%
Halawa                        90.0%        83.7%     7.6%      23.9%        22.0%       8.6%         5.7%          6.6% -13.2%
Hauula                        90.0%        77.6% 15.9%         28.3%        21.7%      30.5%         9.1%          7.6% 18.4%
Waikapu                       89.8%        84.5%     6.3%      26.4%        27.6%      -4.3%         6.7%          8.7% -23.6%
Kihei                         89.8%        88.3%     1.7%      26.5%        21.8%      21.7%         6.4%          5.6% 14.1%
Napili-Honokowai              89.7%        86.0%     4.3%      30.1%        22.0%      36.4%         4.2%          5.4% -22.8%
Fern Acres                    89.6%        87.0%     3.0%      25.8%        10.2%     154.3%         4.4%          0.0% N/A
Orchidlands Estates           89.4%        86.2%     3.7%      21.9%        26.0%     -15.8%        10.2%          7.4% 39.0%
Kilauea                       89.4%        80.0% 11.8%         24.4%        20.0%      21.9%         8.3%          6.6% 24.5%
Waikane                       89.4%        80.3% 11.3%         18.7%        14.8%      26.2%         5.9%          2.8% 109.2%
Kapaau                        89.4%        79.6% 12.2%         22.5%        12.2%      84.6%         5.9%          4.8% 23.6%
Haleiwa                       89.3%        78.6% 13.5%         21.0%        16.8%      24.6%         4.7%          5.3% -11.5%
Hana                          89.2%        86.2%     3.5%       8.5%         9.6%     -10.8%         4.0%          4.0%     0.8%
Honalo                        89.1%        82.0%     8.6%      27.3%        18.9%      44.2%        10.5%          6.9% 52.2%
Kukuihaele                    89.1%        80.1% 11.2%         13.2%        16.3%     -18.9%         3.4%          8.1% -58.3%
Village Park                  88.9%        89.8%    -1.0%      21.7%        21.6%       0.5%         2.8%          3.7% -23.6%
Hilo                          88.8%        85.9%     3.4%      28.2%        24.3%      16.3%         9.4%          8.3% 14.0%
Waihee-Waiehu                 88.8%        80.5% 10.4%         17.0%        19.2%     -11.4%         5.8%          3.8% 52.4%
Makawao                       88.8%        89.9%    -1.3%      26.0%        19.3%      34.9%         7.8%          8.0%    -2.7%
Kurtistown                    88.7%        80.4% 10.3%         28.2%        23.9%      18.2%         4.8%          6.4% -25.7%
Aiea                          88.7%        85.7%     3.5%      31.5%        28.8%       9.3%        11.3%         11.1%     1.4%
Honolulu                      88.6%        83.4%     6.3%      35.3%        31.1%      13.6%        13.1%         10.7% 22.2%
Paia                          88.5%        84.2%     5.1%      40.1%        22.4%      78.8%        10.3%          5.3% 93.5%
Waipio Acres                  88.2%        87.6%     0.7%      17.4%        22.2%     -21.6%         4.0%          5.9% -32.2%
Fern Forest                   87.9%        87.3%     0.7%      18.7%        25.2%     -25.9%         5.3%         13.6% -60.7%
Wainaku                       87.5%        74.5% 17.4%         27.3%        18.6%      46.5%        11.5%          6.2% 85.9%
Waialua                       87.4%        71.7% 21.9%         15.5%        11.6%      33.0%         4.4%          3.2% 37.5%
Kailua (Hawaii County)        87.2%        84.5%     3.3%      22.7%        19.8%      15.0%         4.4%          6.6% -32.6%
Geography         Percent HS Percent HS Percent Percent          Percent      Percent Percent Post- Percent Post- Percent
                         graduates   graduates   change Bachelor       Bachelor     change    Graduate      Graduate    change
                        (2009 ACS) (2000 Census)         (2009 ACS) (2000 Census)            (2009 ACS) (2000 Census)
Anahola                      87.2%        82.5%     5.8%       4.5%        11.0%     -59.3%         1.0%          5.1% -79.9%
Naalehu                      87.1%        70.2% 24.1%          8.5%         7.8%       9.2%         1.3%          2.0% -35.6%
Captain Cook                 87.0%        87.4%    -0.5%      24.8%        24.2%       2.3%         9.8%          8.6% 13.3%
Honokaa                      86.9%        73.1% 18.9%         18.4%        11.6%      58.5%         3.2%          2.9%     8.5%
Hanapepe                     86.8%        81.1%     7.1%      16.9%        17.2%      -1.6%         1.5%          3.5% -56.9%
Kapaa                        86.7%        85.2%     1.8%      20.5%        16.6%      23.6%         7.1%          5.4% 30.8%
Kualapuu                     86.6%        74.0% 17.0%         16.8%        10.4%      61.0%         7.6%          4.2% 82.4%
Ewa Villages                 86.4%        65.6% 31.7%          5.4%         9.3%     -42.2%         3.2%          1.3% 135.1%
Eleele                       86.4%        73.9% 16.9%         21.7%        12.7%      71.0%         3.1%          2.2% 42.1%
Papaikou                     86.3%        72.3% 19.4%         13.4%        10.6%      26.6%         3.9%          2.7% 43.5%
Kaunakakai                   86.0%        76.9% 11.9%         17.9%        13.7%      30.7%         2.9%          2.9%     0.1%
Waianae                      85.5%        79.7%     7.3%      10.5%         7.5%      40.5%         1.9%          1.7%     8.5%
Punaluu                      85.0%        78.2%     8.7%      27.2%        24.4%      11.7%         2.6%         12.3% -79.2%
Keaau                        85.0%        72.1% 17.9%         18.2%        12.8%      42.7%         3.4%          3.5%    -2.8%
Honomu                       84.8%        72.5% 17.1%         26.6%        12.1%     119.3%         7.6%          6.1% 25.3%
Koloa                        84.7%        74.0% 14.5%         17.3%        11.8%      47.2%         6.2%          3.6% 71.4%
Kekaha                       84.5%        73.9% 14.4%         15.0%        12.4%      20.9%         2.6%          3.5% -26.4%
Eden Roc                     84.3%        79.6%     5.9%      12.9%        12.8%       0.6%         3.8%          6.2% -38.5%
Makaha                       84.1%        78.8%     6.7%      12.6%        10.2%      23.8%         4.6%          3.4% 37.9%
Lahaina                      84.0%        78.8%     6.6%      14.6%        16.8%     -12.9%         4.3%          2.9% 50.1%
Waimea (Kauai County)        83.9%        82.5%     1.8%      24.6%        15.9%      54.5%         2.6%          3.9% -34.2%
Kahuku                       83.8%        76.5%     9.5%      20.4%        13.4%      52.6%         3.8%          2.9% 32.7%
Nanakuli                     83.8%        75.5% 11.0%          5.4%         6.6%     -18.6%         0.8%          1.7% -50.9%
Pepeekeo                     83.4%        67.5% 23.6%         18.3%         9.6%      91.5%         1.1%          1.9% -43.4%
Wahiawa                      83.1%        78.0%     6.6%      16.5%        16.8%      -1.7%         2.9%          4.8% -38.8%
Lihue                        83.0%        85.1%    -2.4%      26.5%        23.3%      13.5%         6.6%          7.6% -13.0%
Hanamaulu                    82.6%        71.4% 15.8%         12.1%         6.7%      79.6%         1.5%          0.9% 60.0%
Paauilo                      82.5%        70.5% 17.1%          6.3%         6.5%      -2.0%         2.0%          3.4% -39.9%
Lanai City                   82.2%        69.4% 18.5%         19.7%        16.5%      19.2%         3.6%          3.5%     0.7%
Puhi                         82.2%        69.5% 18.2%         14.9%         7.3%     103.1%         2.6%          1.2% 109.2%
Leilani Estates              82.0%        84.9%    -3.5%      24.6%        19.4%      26.7%         7.4%          5.7% 30.0%
Maili                        81.4%        76.3%     6.7%       6.0%         6.8%     -11.1%         2.6%          1.4% 86.5%
Ewa Beach                    80.9%        71.5% 13.3%         10.2%        10.6%      -3.9%         2.3%          1.9% 18.1%
Geography    Percent HS Percent HS Percent Percent          Percent    Percent Percent Post- Percent Post- Percent
                    graduates   graduates   change Bachelor       Bachelor   change    Graduate      Graduate    change
                   (2009 ACS) (2000 Census)         (2009 ACS) (2000 Census)          (2009 ACS) (2000 Census)
Waimanalo               79.3%        79.9%    -0.8%       9.0%        15.1% -40.2%           2.3%          4.3% -46.4%
Pahala                  79.0%        62.1% 27.1%         10.5%         8.6% 22.4%            4.0%          1.5% 171.3%
Kahului                 78.5%        71.0% 10.7%         15.9%        13.5% 18.1%            4.0%          2.9% 38.7%
Whitmore Village        77.7%        64.4% 20.7%         12.3%        10.5% 17.5%            2.9%          1.7% 71.7%
Pahoa                   77.4%        66.6% 16.2%         14.3%        11.3% 26.5%            4.1%          1.0% 307.0%
Waipahu                 77.4%        68.6% 12.8%         16.0%        11.1% 43.8%            2.9%          0.9% 224.7%
Haliimaile              73.8%        60.0% 23.1%         15.9%        11.1% 43.1%            5.0%          2.3% 115.0%
Kaumakani               69.1%        62.6% 10.5%          7.2%         7.2%    -0.5%         0.9%          1.5% -38.0%
Pakala Village          68.5%        55.5% 23.4%         11.3%         4.9% 129.5%           0.8%          1.5% -44.7%

More Related Content

What's hot

Languages Spoken in the Home — 2009 Breakdown
Languages Spoken in the Home — 2009 BreakdownLanguages Spoken in the Home — 2009 Breakdown
Languages Spoken in the Home — 2009 BreakdownHonolulu Civil Beat
 
Civil beat poll sept. 7 8, 2010 mayor crosstabs and toplines
Civil beat poll sept. 7 8, 2010 mayor crosstabs and toplinesCivil beat poll sept. 7 8, 2010 mayor crosstabs and toplines
Civil beat poll sept. 7 8, 2010 mayor crosstabs and toplinesHonolulu Civil Beat
 
Multiculturalism in Canada: What Census 2016 and Other Data Tell Us
Multiculturalism in Canada:  What Census 2016 and Other Data Tell UsMulticulturalism in Canada:  What Census 2016 and Other Data Tell Us
Multiculturalism in Canada: What Census 2016 and Other Data Tell UsAndrew Griffith
 
Philosophy - Lesson 5 - Is There a God?
Philosophy - Lesson 5 - Is There a God?Philosophy - Lesson 5 - Is There a God?
Philosophy - Lesson 5 - Is There a God?RMPSuccess
 
Assessing the Economics of Obesity and Obesity Interventions by Michael J. O'...
Assessing the Economics of Obesity and Obesity Interventions by Michael J. O'...Assessing the Economics of Obesity and Obesity Interventions by Michael J. O'...
Assessing the Economics of Obesity and Obesity Interventions by Michael J. O'...Wisconsin Women's Health Foundation
 
Variaciones Merval 1993 - 2008
Variaciones Merval 1993 - 2008Variaciones Merval 1993 - 2008
Variaciones Merval 1993 - 2008Cityblog
 
Real Time Enrollment of IPS and Charter Schools
Real Time Enrollment of IPS and Charter SchoolsReal Time Enrollment of IPS and Charter Schools
Real Time Enrollment of IPS and Charter SchoolsAbdul-Hakim Shabazz
 
SPX (1990-2012) - Long Straddle, Strangle & Deep OTM
SPX (1990-2012) - Long Straddle, Strangle & Deep OTMSPX (1990-2012) - Long Straddle, Strangle & Deep OTM
SPX (1990-2012) - Long Straddle, Strangle & Deep OTMStefan Bolta
 
Attendance powerpoint new we240217
Attendance powerpoint new we240217Attendance powerpoint new we240217
Attendance powerpoint new we240217laytonschool
 
Cartoon Network India - New Generations Research 2012
Cartoon Network India - New Generations Research 2012Cartoon Network India - New Generations Research 2012
Cartoon Network India - New Generations Research 2012Harsh Wardhan Dave
 
Mortalidad infantil por provincia 1980-2013
Mortalidad infantil por provincia 1980-2013Mortalidad infantil por provincia 1980-2013
Mortalidad infantil por provincia 1980-2013Eduardo Nelson German
 

What's hot (19)

States Race
States RaceStates Race
States Race
 
Turnout
TurnoutTurnout
Turnout
 
Idle Teens 2000-2009
Idle Teens 2000-2009Idle Teens 2000-2009
Idle Teens 2000-2009
 
Oahu Census Tracts
Oahu Census TractsOahu Census Tracts
Oahu Census Tracts
 
Languages Spoken in the Home — 2009 Breakdown
Languages Spoken in the Home — 2009 BreakdownLanguages Spoken in the Home — 2009 Breakdown
Languages Spoken in the Home — 2009 Breakdown
 
Civil beat poll sept. 7 8, 2010 mayor crosstabs and toplines
Civil beat poll sept. 7 8, 2010 mayor crosstabs and toplinesCivil beat poll sept. 7 8, 2010 mayor crosstabs and toplines
Civil beat poll sept. 7 8, 2010 mayor crosstabs and toplines
 
Multiculturalism in Canada: What Census 2016 and Other Data Tell Us
Multiculturalism in Canada:  What Census 2016 and Other Data Tell UsMulticulturalism in Canada:  What Census 2016 and Other Data Tell Us
Multiculturalism in Canada: What Census 2016 and Other Data Tell Us
 
Language in the Home
Language in the HomeLanguage in the Home
Language in the Home
 
Philosophy - Lesson 5 - Is There a God?
Philosophy - Lesson 5 - Is There a God?Philosophy - Lesson 5 - Is There a God?
Philosophy - Lesson 5 - Is There a God?
 
Assessing the Economics of Obesity and Obesity Interventions by Michael J. O'...
Assessing the Economics of Obesity and Obesity Interventions by Michael J. O'...Assessing the Economics of Obesity and Obesity Interventions by Michael J. O'...
Assessing the Economics of Obesity and Obesity Interventions by Michael J. O'...
 
Variaciones Merval 1993 - 2008
Variaciones Merval 1993 - 2008Variaciones Merval 1993 - 2008
Variaciones Merval 1993 - 2008
 
Real Time Enrollment of IPS and Charter Schools
Real Time Enrollment of IPS and Charter SchoolsReal Time Enrollment of IPS and Charter Schools
Real Time Enrollment of IPS and Charter Schools
 
SPX (1990-2012) - Long Straddle, Strangle & Deep OTM
SPX (1990-2012) - Long Straddle, Strangle & Deep OTMSPX (1990-2012) - Long Straddle, Strangle & Deep OTM
SPX (1990-2012) - Long Straddle, Strangle & Deep OTM
 
Attendance powerpoint new we240217
Attendance powerpoint new we240217Attendance powerpoint new we240217
Attendance powerpoint new we240217
 
Nifty Summary
Nifty SummaryNifty Summary
Nifty Summary
 
Home Value State Rankings
Home Value State RankingsHome Value State Rankings
Home Value State Rankings
 
Cartoon Network India - New Generations Research 2012
Cartoon Network India - New Generations Research 2012Cartoon Network India - New Generations Research 2012
Cartoon Network India - New Generations Research 2012
 
Mortalidad infantil por provincia 1980-2013
Mortalidad infantil por provincia 1980-2013Mortalidad infantil por provincia 1980-2013
Mortalidad infantil por provincia 1980-2013
 
Occupancy Stats
Occupancy StatsOccupancy Stats
Occupancy Stats
 

Viewers also liked

Viewers also liked (8)

10 year gains — median household income
10 year gains — median household income10 year gains — median household income
10 year gains — median household income
 
Cu econ draft-4-8-09
Cu econ draft-4-8-09Cu econ draft-4-8-09
Cu econ draft-4-8-09
 
Final EIS Part 2
Final EIS Part 2Final EIS Part 2
Final EIS Part 2
 
Under Outties Label Final
Under Outties Label FinalUnder Outties Label Final
Under Outties Label Final
 
Akaka amendment
Akaka amendmentAkaka amendment
Akaka amendment
 
College Planning
College PlanningCollege Planning
College Planning
 
Infographics
InfographicsInfographics
Infographics
 
Nakata letter
Nakata letterNakata letter
Nakata letter
 

Similar to 10-Year Changes 2000-2009

Towns Ranked by High School Grad
Towns Ranked by High School GradTowns Ranked by High School Grad
Towns Ranked by High School GradHonolulu Civil Beat
 
Stepcheck - door drop recall and readership
Stepcheck - door drop recall and readershipStepcheck - door drop recall and readership
Stepcheck - door drop recall and readershipGraham Dodd
 
Heartland 2050 meeting 4
Heartland 2050 meeting 4Heartland 2050 meeting 4
Heartland 2050 meeting 4Heartland2050
 
Mortgage Brokers Association Data
Mortgage Brokers Association DataMortgage Brokers Association Data
Mortgage Brokers Association DataTom Cryer
 
Literacy rate 2011 the onlinegk
Literacy rate 2011   the onlinegkLiteracy rate 2011   the onlinegk
Literacy rate 2011 the onlinegkRajesh Ahuja
 
Desempleo Por Edad
Desempleo Por EdadDesempleo Por Edad
Desempleo Por EdadAisart
 
Analisis Horta Guinardo 2008 03 10
Analisis Horta Guinardo 2008 03 10Analisis Horta Guinardo 2008 03 10
Analisis Horta Guinardo 2008 03 101977bcn
 
Census 2016 and IRCC Data What it Says About Naturalization in Canada
Census 2016 and IRCC Data What it Says About Naturalization in Canada Census 2016 and IRCC Data What it Says About Naturalization in Canada
Census 2016 and IRCC Data What it Says About Naturalization in Canada Andrew Griffith
 
NTFS - Chapter 5 Tables
NTFS - Chapter 5 TablesNTFS - Chapter 5 Tables
NTFS - Chapter 5 TablesLBG
 
NCFS - C5 T5 PG1-19
NCFS - C5 T5 PG1-19NCFS - C5 T5 PG1-19
NCFS - C5 T5 PG1-19LBG
 
johnson & johnson Sales of Key Products Franchises Q4 2008
johnson & johnson Sales of Key Products Franchises Q4 2008johnson & johnson Sales of Key Products Franchises Q4 2008
johnson & johnson Sales of Key Products Franchises Q4 2008finance4
 
Excel/VBA model for nurse scheduling in outpatient wards
Excel/VBA model for nurse scheduling in outpatient wardsExcel/VBA model for nurse scheduling in outpatient wards
Excel/VBA model for nurse scheduling in outpatient wardsParijat Sinha
 

Similar to 10-Year Changes 2000-2009 (18)

Towns Ranked by High School Grad
Towns Ranked by High School GradTowns Ranked by High School Grad
Towns Ranked by High School Grad
 
NAG_Math
NAG_MathNAG_Math
NAG_Math
 
NAG_LAL
NAG_LALNAG_LAL
NAG_LAL
 
Stepcheck - door drop recall and readership
Stepcheck - door drop recall and readershipStepcheck - door drop recall and readership
Stepcheck - door drop recall and readership
 
Heartland 2050 meeting 4
Heartland 2050 meeting 4Heartland 2050 meeting 4
Heartland 2050 meeting 4
 
Mortgage Brokers Association Data
Mortgage Brokers Association DataMortgage Brokers Association Data
Mortgage Brokers Association Data
 
Literacy rate 2011 the onlinegk
Literacy rate 2011   the onlinegkLiteracy rate 2011   the onlinegk
Literacy rate 2011 the onlinegk
 
Desempleo Por Edad
Desempleo Por EdadDesempleo Por Edad
Desempleo Por Edad
 
Analisis Horta Guinardo 2008 03 10
Analisis Horta Guinardo 2008 03 10Analisis Horta Guinardo 2008 03 10
Analisis Horta Guinardo 2008 03 10
 
Hawaii Towns Household Size
Hawaii Towns Household SizeHawaii Towns Household Size
Hawaii Towns Household Size
 
Census 2016 and IRCC Data What it Says About Naturalization in Canada
Census 2016 and IRCC Data What it Says About Naturalization in Canada Census 2016 and IRCC Data What it Says About Naturalization in Canada
Census 2016 and IRCC Data What it Says About Naturalization in Canada
 
NTFS - Chapter 5 Tables
NTFS - Chapter 5 TablesNTFS - Chapter 5 Tables
NTFS - Chapter 5 Tables
 
Turnout
TurnoutTurnout
Turnout
 
NCFS - C5 T5 PG1-19
NCFS - C5 T5 PG1-19NCFS - C5 T5 PG1-19
NCFS - C5 T5 PG1-19
 
Students Reporting Use of Selected Substances in the Last 30 Days
Students Reporting Use of Selected Substances in the Last 30 Days Students Reporting Use of Selected Substances in the Last 30 Days
Students Reporting Use of Selected Substances in the Last 30 Days
 
johnson & johnson Sales of Key Products Franchises Q4 2008
johnson & johnson Sales of Key Products Franchises Q4 2008johnson & johnson Sales of Key Products Franchises Q4 2008
johnson & johnson Sales of Key Products Franchises Q4 2008
 
State Transportation Rankings
State Transportation RankingsState Transportation Rankings
State Transportation Rankings
 
Excel/VBA model for nurse scheduling in outpatient wards
Excel/VBA model for nurse scheduling in outpatient wardsExcel/VBA model for nurse scheduling in outpatient wards
Excel/VBA model for nurse scheduling in outpatient wards
 

More from Honolulu Civil Beat

Gov. David Ige response to U.S. Rep. Anna Eshoo
Gov. David Ige response to U.S. Rep. Anna EshooGov. David Ige response to U.S. Rep. Anna Eshoo
Gov. David Ige response to U.S. Rep. Anna EshooHonolulu Civil Beat
 
Audit of the Department of the Honolulu Prosecuting Attorney’s Policies, Proc...
Audit of the Department of the Honolulu Prosecuting Attorney’s Policies, Proc...Audit of the Department of the Honolulu Prosecuting Attorney’s Policies, Proc...
Audit of the Department of the Honolulu Prosecuting Attorney’s Policies, Proc...Honolulu Civil Beat
 
Audit of the Honolulu Police Department’s Policies, Procedures, and Controls
Audit of the Honolulu Police Department’s Policies, Procedures, and ControlsAudit of the Honolulu Police Department’s Policies, Procedures, and Controls
Audit of the Honolulu Police Department’s Policies, Procedures, and ControlsHonolulu Civil Beat
 
2019 Use of Force Annual Report HPD
2019 Use of Force Annual Report HPD 2019 Use of Force Annual Report HPD
2019 Use of Force Annual Report HPD Honolulu Civil Beat
 
Office of Health Equity Goals Draft 10
Office of Health Equity Goals Draft 10Office of Health Equity Goals Draft 10
Office of Health Equity Goals Draft 10Honolulu Civil Beat
 
ACLU Letter to HPD regarding racial profiling
ACLU Letter to HPD regarding racial profilingACLU Letter to HPD regarding racial profiling
ACLU Letter to HPD regarding racial profilingHonolulu Civil Beat
 
ACLU Letter to HPD regarding racial profiling
ACLU Letter to HPD regarding racial profilingACLU Letter to HPD regarding racial profiling
ACLU Letter to HPD regarding racial profilingHonolulu Civil Beat
 
Guam Governor's Letter to Pence
Guam Governor's Letter to Pence Guam Governor's Letter to Pence
Guam Governor's Letter to Pence Honolulu Civil Beat
 
List Of Pro Bono Legal Service Providers
List Of Pro Bono Legal Service ProvidersList Of Pro Bono Legal Service Providers
List Of Pro Bono Legal Service ProvidersHonolulu Civil Beat
 
Arbitration Hearing Transcript December 2018
Arbitration Hearing Transcript December 2018Arbitration Hearing Transcript December 2018
Arbitration Hearing Transcript December 2018Honolulu Civil Beat
 

More from Honolulu Civil Beat (20)

Gov. David Ige response to U.S. Rep. Anna Eshoo
Gov. David Ige response to U.S. Rep. Anna EshooGov. David Ige response to U.S. Rep. Anna Eshoo
Gov. David Ige response to U.S. Rep. Anna Eshoo
 
Audit of the Department of the Honolulu Prosecuting Attorney’s Policies, Proc...
Audit of the Department of the Honolulu Prosecuting Attorney’s Policies, Proc...Audit of the Department of the Honolulu Prosecuting Attorney’s Policies, Proc...
Audit of the Department of the Honolulu Prosecuting Attorney’s Policies, Proc...
 
Audit of the Honolulu Police Department’s Policies, Procedures, and Controls
Audit of the Honolulu Police Department’s Policies, Procedures, and ControlsAudit of the Honolulu Police Department’s Policies, Procedures, and Controls
Audit of the Honolulu Police Department’s Policies, Procedures, and Controls
 
2019 Use of Force Annual Report HPD
2019 Use of Force Annual Report HPD 2019 Use of Force Annual Report HPD
2019 Use of Force Annual Report HPD
 
Office of Health Equity Goals Draft 10
Office of Health Equity Goals Draft 10Office of Health Equity Goals Draft 10
Office of Health Equity Goals Draft 10
 
NHPI COVID-19 Statement
NHPI COVID-19 StatementNHPI COVID-19 Statement
NHPI COVID-19 Statement
 
DLIR Response Language Access
DLIR Response Language AccessDLIR Response Language Access
DLIR Response Language Access
 
Language Access Letter To DLIR
Language Access Letter To DLIRLanguage Access Letter To DLIR
Language Access Letter To DLIR
 
ACLU Letter to HPD regarding racial profiling
ACLU Letter to HPD regarding racial profilingACLU Letter to HPD regarding racial profiling
ACLU Letter to HPD regarding racial profiling
 
ACLU Letter to HPD regarding racial profiling
ACLU Letter to HPD regarding racial profilingACLU Letter to HPD regarding racial profiling
ACLU Letter to HPD regarding racial profiling
 
Jane Doe v. Rehab Hospital
Jane Doe v. Rehab HospitalJane Doe v. Rehab Hospital
Jane Doe v. Rehab Hospital
 
Coronavirus HPHA
Coronavirus HPHA Coronavirus HPHA
Coronavirus HPHA
 
OHA Data Request
OHA Data RequestOHA Data Request
OHA Data Request
 
Letter from Palau to Guam
Letter from Palau to GuamLetter from Palau to Guam
Letter from Palau to Guam
 
Guam Governor's Letter to Pence
Guam Governor's Letter to Pence Guam Governor's Letter to Pence
Guam Governor's Letter to Pence
 
OHA Analysis by Akina
OHA Analysis by AkinaOHA Analysis by Akina
OHA Analysis by Akina
 
Case COFA Letter
Case COFA LetterCase COFA Letter
Case COFA Letter
 
List Of Pro Bono Legal Service Providers
List Of Pro Bono Legal Service ProvidersList Of Pro Bono Legal Service Providers
List Of Pro Bono Legal Service Providers
 
Arbitration Hearing Transcript December 2018
Arbitration Hearing Transcript December 2018Arbitration Hearing Transcript December 2018
Arbitration Hearing Transcript December 2018
 
Caldwell Press Release
Caldwell Press ReleaseCaldwell Press Release
Caldwell Press Release
 

10-Year Changes 2000-2009

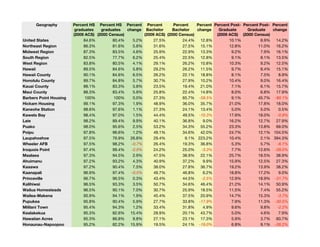
  • 1. Geography Percent HS Percent HS Percent Percent Percent Percent Percent Post- Percent Post- Percent graduates graduates change Bachelor Bachelor change Graduate Graduate change (2009 ACS) (2000 Census) (2009 ACS) (2000 Census) (2009 ACS) (2000 Census) United States 84.6% 80.4% 5.2% 27.5% 24.4% 12.8% 10.1% 8.9% 14.2% Northeast Region 86.3% 81.6% 5.8% 31.6% 27.5% 15.1% 12.8% 11.0% 16.2% Midwest Region 87.3% 83.5% 4.6% 25.9% 22.9% 13.3% 9.2% 7.9% 16.1% South Region 82.5% 77.7% 6.2% 25.4% 22.5% 12.8% 9.1% 8.1% 13.5% West Region 83.8% 80.5% 4.1% 29.1% 26.2% 10.8% 10.3% 9.2% 12.5% Hawaii 89.5% 84.6% 5.8% 29.2% 26.2% 11.5% 9.7% 8.4% 15.1% Hawaii County 90.1% 84.6% 6.5% 26.2% 22.1% 18.8% 8.1% 7.5% 8.9% Honolulu County 89.7% 84.8% 5.7% 30.7% 27.9% 10.2% 10.4% 9.0% 16.4% Kauai County 88.1% 83.3% 5.8% 23.5% 19.4% 21.0% 7.1% 6.1% 15.7% Maui County 88.3% 83.4% 5.9% 25.8% 22.4% 14.8% 8.0% 6.8% 17.9% Barbers Point Housing 100% 100% 0.0% 27.3% 65.7% -58.5% 9.1% 45.7% -80.1% Hickam Housing 99.1% 97.3% 1.9% 48.9% 36.0% 35.7% 21.0% 17.8% 18.0% Kaneohe Station 98.6% 97.6% 1.1% 27.3% 24.1% 13.4% 5.0% 5.0% 0.5% Kawela Bay 98.4% 97.0% 1.5% 44.4% 49.5% -10.3% 17.9% 18.0% -0.9% Laie 98.2% 89.4% 9.9% 40.1% 36.8% 9.0% 16.2% 12.7% 27.9% Puako 98.0% 95.6% 2.5% 53.2% 34.3% 55.2% 23.3% 13.8% 69.0% Poipu 97.8% 96.6% 1.2% 49.1% 34.6% 42.0% 24.7% 12.1% 104.5% Laupahoehoe 97.5% 76.9% 26.8% 29.4% 9.1% 223.2% 10.4% 2.1% 394.3% Wheeler AFB 97.5% 98.2% -0.7% 26.4% 19.3% 36.8% 5.3% 5.7% -6.1% Iroquois Point 97.4% 99.4% -2.0% 24.2% 25.0% -3.3% 7.7% 12.6% -39.0% Maalaea 97.3% 94.5% 2.9% 47.5% 38.9% 22.1% 25.7% 18.5% 38.9% Ahuimanu 97.2% 93.2% 4.3% 40.9% 37.2% 9.9% 15.9% 12.5% 27.3% Kaaawa 97.2% 90.4% 7.5% 38.0% 27.8% 36.7% 19.2% 13.9% 38.2% Kaanapali 96.9% 97.4% -0.5% 49.7% 46.8% 6.2% 18.8% 17.2% 9.0% Princeville 96.7% 96.5% 0.3% 43.4% 44.5% -2.5% 12.9% 18.9% -31.7% Kalihiwai 96.5% 93.3% 3.5% 50.7% 34.6% 46.4% 21.2% 14.1% 50.9% Wailua Homesteads 96.5% 90.1% 7.0% 30.7% 25.9% 18.5% 11.5% 7.4% 55.2% Wailea-Makena 95.9% 94.1% 1.9% 45.4% 37.5% 20.9% 14.7% 15.3% -3.7% Pupukea 95.8% 90.4% 5.9% 27.7% 33.8% -17.9% 7.9% 11.3% -30.5% Mililani Town 95.4% 94.3% 1.2% 33.4% 31.8% 4.9% 9.6% 9.8% -2.2% Kealakekua 95.3% 82.6% 15.4% 28.9% 20.1% 43.7% 5.0% 4.6% 7.9% Hawaiian Acres 95.3% 86.8% 9.8% 27.1% 23.1% 17.3% 5.9% 3.7% 60.7% Honaunau-Napoopoo 95.2% 82.2% 15.9% 19.5% 24.1% -19.0% 6.8% 9.1% -26.2%
  • 2. Geography Percent HS Percent HS Percent Percent Percent Percent Percent Post- Percent Post- Percent graduates graduates change Bachelor Bachelor change Graduate Graduate change (2009 ACS) (2000 Census) (2009 ACS) (2000 Census) (2009 ACS) (2000 Census) Ewa Gentry 95.1% 86.4% 10.1% 33.4% 28.8% 16.1% 9.2% 3.8% 140.1% Schofield Barracks 95.0% 96.1% -1.2% 22.8% 16.8% 35.7% 8.3% 5.5% 51.7% Kailua (Honolulu County) 94.9% 92.8% 2.2% 42.6% 39.4% 8.1% 18.7% 15.5% 20.7% Heeia 94.8% 94.7% 0.1% 37.8% 41.2% -8.2% 17.4% 15.0% 15.9% Waikoloa Village 94.7% 91.7% 3.3% 34.4% 23.9% 43.9% 8.4% 6.7% 25.3% Holualoa 94.3% 89.7% 5.2% 32.1% 27.9% 14.9% 8.3% 11.0% -24.7% Maunaloa 94.3% 77.5% 21.7% 5.1% 0.0% N/A 2.5% 0.0% N/A Kalaoa 94.2% 89.3% 5.5% 24.2% 25.9% -6.6% 7.7% 7.6% 1.0% Mokuleia 94.1% 90.7% 3.8% 39.2% 36.3% 7.9% 12.8% 13.8% -7.3% Volcano 93.7% 86.9% 7.8% 33.9% 33.6% 0.9% 13.5% 12.4% 8.8% Kapalua 93.5% 93.2% 0.3% 44.0% 46.9% -6.2% 12.3% 17.3% -28.8% Mountain View 93.4% 77.0% 21.3% 23.6% 10.9% 116.7% 5.5% 3.4% 60.8% Haiku-Pauwela 93.4% 88.6% 5.4% 26.5% 24.6% 7.9% 11.2% 8.3% 34.8% Makakilo City 93.3% 90.1% 3.5% 27.6% 26.3% 5.2% 8.9% 6.8% 30.7% Hanalei 93.2% 82.8% 12.5% 22.5% 21.7% 3.9% 4.6% 7.0% -33.7% Maunawili 92.7% 91.8% 1.1% 46.5% 44.1% 5.4% 22.4% 20.2% 10.8% Waimalu 92.7% 90.6% 2.4% 35.0% 32.4% 7.9% 10.2% 10.0% 2.1% Kahaluu 92.3% 86.3% 7.1% 29.4% 29.3% 0.4% 11.4% 11.4% 0.3% Waipio 92.3% 89.8% 2.8% 24.5% 28.1% -12.9% 4.8% 6.5% -26.3% Hawaiian Paradise Park 92.1% 84.9% 8.4% 19.9% 20.1% -0.8% 6.5% 6.2% 5.4% Kahaluu-Keauhou 92.0% 93.3% -1.4% 39.5% 34.4% 14.8% 14.7% 11.5% 28.1% Pukalani 91.7% 89.2% 2.8% 26.7% 25.7% 3.8% 8.5% 9.8% -13.5% Halaula 91.6% 79.8% 14.8% 12.4% 11.0% 12.6% 2.6% 2.5% 3.1% Kaneohe 91.5% 89.7% 2.1% 30.7% 29.5% 4.2% 9.6% 9.8% -1.4% Wailua 91.4% 85.8% 6.6% 23.2% 21.8% 6.5% 7.1% 5.2% 35.9% Paukaa 91.4% 81.6% 12.0% 37.0% 24.3% 52.4% 18.8% 8.8% 114.5% Omao 91.3% 87.5% 4.4% 28.7% 16.2% 77.9% 10.8% 5.7% 90.2% Pearl City 91.2% 86.7% 5.2% 22.5% 20.1% 12.0% 6.0% 4.7% 25.9% Hawi 91.1% 88.3% 3.1% 14.6% 14.4% 1.7% 1.5% 2.4% -37.0% Lawai 91.1% 84.9% 7.2% 30.5% 22.2% 37.4% 8.3% 6.4% 30.3% Makaha Valley 91.0% 87.6% 3.9% 19.1% 12.7% 49.9% 9.0% 4.4% 103.8% Kalaheo 91.0% 85.1% 6.9% 23.1% 20.5% 12.8% 7.3% 7.3% 1.0% Waimea (Hawaii County) 90.8% 88.6% 2.5% 26.4% 27.1% -2.5% 10.5% 10.1% 4.2%
  • 3. Geography Percent HS Percent HS Percent Percent Percent Percent Percent Post- Percent Post- Percent graduates graduates change Bachelor Bachelor change Graduate Graduate change (2009 ACS) (2000 Census) (2009 ACS) (2000 Census) (2009 ACS) (2000 Census) Hawaiian Ocean View 90.6% 87.2% 3.9% 28.2% 16.8% 67.8% 9.1% 6.1% 48.3% Hawaiian Beaches 90.5% 82.4% 9.9% 13.4% 8.1% 66.2% 0.9% 3.6% -73.9% Ainaloa 90.4% 85.4% 5.9% 14.5% 10.4% 38.6% 4.0% 4.2% -4.9% Waimanalo Beach 90.4% 82.3% 9.9% 16.2% 12.0% 35.3% 7.1% 5.0% 40.9% Nanawale Estates 90.4% 75.3% 20.1% 26.8% 9.0% 199.5% 6.7% 1.8% 274.4% Wailuku 90.1% 82.1% 9.8% 27.3% 21.6% 26.3% 11.3% 7.0% 61.5% Halawa 90.0% 83.7% 7.6% 23.9% 22.0% 8.6% 5.7% 6.6% -13.2% Hauula 90.0% 77.6% 15.9% 28.3% 21.7% 30.5% 9.1% 7.6% 18.4% Waikapu 89.8% 84.5% 6.3% 26.4% 27.6% -4.3% 6.7% 8.7% -23.6% Kihei 89.8% 88.3% 1.7% 26.5% 21.8% 21.7% 6.4% 5.6% 14.1% Napili-Honokowai 89.7% 86.0% 4.3% 30.1% 22.0% 36.4% 4.2% 5.4% -22.8% Fern Acres 89.6% 87.0% 3.0% 25.8% 10.2% 154.3% 4.4% 0.0% N/A Orchidlands Estates 89.4% 86.2% 3.7% 21.9% 26.0% -15.8% 10.2% 7.4% 39.0% Kilauea 89.4% 80.0% 11.8% 24.4% 20.0% 21.9% 8.3% 6.6% 24.5% Waikane 89.4% 80.3% 11.3% 18.7% 14.8% 26.2% 5.9% 2.8% 109.2% Kapaau 89.4% 79.6% 12.2% 22.5% 12.2% 84.6% 5.9% 4.8% 23.6% Haleiwa 89.3% 78.6% 13.5% 21.0% 16.8% 24.6% 4.7% 5.3% -11.5% Hana 89.2% 86.2% 3.5% 8.5% 9.6% -10.8% 4.0% 4.0% 0.8% Honalo 89.1% 82.0% 8.6% 27.3% 18.9% 44.2% 10.5% 6.9% 52.2% Kukuihaele 89.1% 80.1% 11.2% 13.2% 16.3% -18.9% 3.4% 8.1% -58.3% Village Park 88.9% 89.8% -1.0% 21.7% 21.6% 0.5% 2.8% 3.7% -23.6% Hilo 88.8% 85.9% 3.4% 28.2% 24.3% 16.3% 9.4% 8.3% 14.0% Waihee-Waiehu 88.8% 80.5% 10.4% 17.0% 19.2% -11.4% 5.8% 3.8% 52.4% Makawao 88.8% 89.9% -1.3% 26.0% 19.3% 34.9% 7.8% 8.0% -2.7% Kurtistown 88.7% 80.4% 10.3% 28.2% 23.9% 18.2% 4.8% 6.4% -25.7% Aiea 88.7% 85.7% 3.5% 31.5% 28.8% 9.3% 11.3% 11.1% 1.4% Honolulu 88.6% 83.4% 6.3% 35.3% 31.1% 13.6% 13.1% 10.7% 22.2% Paia 88.5% 84.2% 5.1% 40.1% 22.4% 78.8% 10.3% 5.3% 93.5% Waipio Acres 88.2% 87.6% 0.7% 17.4% 22.2% -21.6% 4.0% 5.9% -32.2% Fern Forest 87.9% 87.3% 0.7% 18.7% 25.2% -25.9% 5.3% 13.6% -60.7% Wainaku 87.5% 74.5% 17.4% 27.3% 18.6% 46.5% 11.5% 6.2% 85.9% Waialua 87.4% 71.7% 21.9% 15.5% 11.6% 33.0% 4.4% 3.2% 37.5% Kailua (Hawaii County) 87.2% 84.5% 3.3% 22.7% 19.8% 15.0% 4.4% 6.6% -32.6%
  • 4. Geography Percent HS Percent HS Percent Percent Percent Percent Percent Post- Percent Post- Percent graduates graduates change Bachelor Bachelor change Graduate Graduate change (2009 ACS) (2000 Census) (2009 ACS) (2000 Census) (2009 ACS) (2000 Census) Anahola 87.2% 82.5% 5.8% 4.5% 11.0% -59.3% 1.0% 5.1% -79.9% Naalehu 87.1% 70.2% 24.1% 8.5% 7.8% 9.2% 1.3% 2.0% -35.6% Captain Cook 87.0% 87.4% -0.5% 24.8% 24.2% 2.3% 9.8% 8.6% 13.3% Honokaa 86.9% 73.1% 18.9% 18.4% 11.6% 58.5% 3.2% 2.9% 8.5% Hanapepe 86.8% 81.1% 7.1% 16.9% 17.2% -1.6% 1.5% 3.5% -56.9% Kapaa 86.7% 85.2% 1.8% 20.5% 16.6% 23.6% 7.1% 5.4% 30.8% Kualapuu 86.6% 74.0% 17.0% 16.8% 10.4% 61.0% 7.6% 4.2% 82.4% Ewa Villages 86.4% 65.6% 31.7% 5.4% 9.3% -42.2% 3.2% 1.3% 135.1% Eleele 86.4% 73.9% 16.9% 21.7% 12.7% 71.0% 3.1% 2.2% 42.1% Papaikou 86.3% 72.3% 19.4% 13.4% 10.6% 26.6% 3.9% 2.7% 43.5% Kaunakakai 86.0% 76.9% 11.9% 17.9% 13.7% 30.7% 2.9% 2.9% 0.1% Waianae 85.5% 79.7% 7.3% 10.5% 7.5% 40.5% 1.9% 1.7% 8.5% Punaluu 85.0% 78.2% 8.7% 27.2% 24.4% 11.7% 2.6% 12.3% -79.2% Keaau 85.0% 72.1% 17.9% 18.2% 12.8% 42.7% 3.4% 3.5% -2.8% Honomu 84.8% 72.5% 17.1% 26.6% 12.1% 119.3% 7.6% 6.1% 25.3% Koloa 84.7% 74.0% 14.5% 17.3% 11.8% 47.2% 6.2% 3.6% 71.4% Kekaha 84.5% 73.9% 14.4% 15.0% 12.4% 20.9% 2.6% 3.5% -26.4% Eden Roc 84.3% 79.6% 5.9% 12.9% 12.8% 0.6% 3.8% 6.2% -38.5% Makaha 84.1% 78.8% 6.7% 12.6% 10.2% 23.8% 4.6% 3.4% 37.9% Lahaina 84.0% 78.8% 6.6% 14.6% 16.8% -12.9% 4.3% 2.9% 50.1% Waimea (Kauai County) 83.9% 82.5% 1.8% 24.6% 15.9% 54.5% 2.6% 3.9% -34.2% Kahuku 83.8% 76.5% 9.5% 20.4% 13.4% 52.6% 3.8% 2.9% 32.7% Nanakuli 83.8% 75.5% 11.0% 5.4% 6.6% -18.6% 0.8% 1.7% -50.9% Pepeekeo 83.4% 67.5% 23.6% 18.3% 9.6% 91.5% 1.1% 1.9% -43.4% Wahiawa 83.1% 78.0% 6.6% 16.5% 16.8% -1.7% 2.9% 4.8% -38.8% Lihue 83.0% 85.1% -2.4% 26.5% 23.3% 13.5% 6.6% 7.6% -13.0% Hanamaulu 82.6% 71.4% 15.8% 12.1% 6.7% 79.6% 1.5% 0.9% 60.0% Paauilo 82.5% 70.5% 17.1% 6.3% 6.5% -2.0% 2.0% 3.4% -39.9% Lanai City 82.2% 69.4% 18.5% 19.7% 16.5% 19.2% 3.6% 3.5% 0.7% Puhi 82.2% 69.5% 18.2% 14.9% 7.3% 103.1% 2.6% 1.2% 109.2% Leilani Estates 82.0% 84.9% -3.5% 24.6% 19.4% 26.7% 7.4% 5.7% 30.0% Maili 81.4% 76.3% 6.7% 6.0% 6.8% -11.1% 2.6% 1.4% 86.5% Ewa Beach 80.9% 71.5% 13.3% 10.2% 10.6% -3.9% 2.3% 1.9% 18.1%
  • 5. Geography Percent HS Percent HS Percent Percent Percent Percent Percent Post- Percent Post- Percent graduates graduates change Bachelor Bachelor change Graduate Graduate change (2009 ACS) (2000 Census) (2009 ACS) (2000 Census) (2009 ACS) (2000 Census) Waimanalo 79.3% 79.9% -0.8% 9.0% 15.1% -40.2% 2.3% 4.3% -46.4% Pahala 79.0% 62.1% 27.1% 10.5% 8.6% 22.4% 4.0% 1.5% 171.3% Kahului 78.5% 71.0% 10.7% 15.9% 13.5% 18.1% 4.0% 2.9% 38.7% Whitmore Village 77.7% 64.4% 20.7% 12.3% 10.5% 17.5% 2.9% 1.7% 71.7% Pahoa 77.4% 66.6% 16.2% 14.3% 11.3% 26.5% 4.1% 1.0% 307.0% Waipahu 77.4% 68.6% 12.8% 16.0% 11.1% 43.8% 2.9% 0.9% 224.7% Haliimaile 73.8% 60.0% 23.1% 15.9% 11.1% 43.1% 5.0% 2.3% 115.0% Kaumakani 69.1% 62.6% 10.5% 7.2% 7.2% -0.5% 0.9% 1.5% -38.0% Pakala Village 68.5% 55.5% 23.4% 11.3% 4.9% 129.5% 0.8% 1.5% -44.7%