SlideShare a Scribd company logo
1 of 100
An Introduction to Kanban
  What is it & why would I use it?
                          David J. Anderson
             David J. Anderson & Associates
             dja@djandersonassociates.com
Book Published
     April 2010


     A 72,000 word
   intro to the topic
German
published January, 2011


            Translation by
            Arne Roock &
            Henning Wolf
                of IT-Agile
Spanish
published May 2011


            Translated by
      Masa K Maeda, PhD
Portuguese (Brazilian)
published October 2011


            Translation by
             Andrea Pinto
             Recife, Brazil
http://leankanbanuniversity.com
http://www.limitedwipsociety.org


 LinkedIn Groups: Software Kanban
       Yahoo! Groups: kanbandev
       Yahoo! Groups: kanbanops
Taiichi Ohno…

     TPS = JIT + Autonomation

Kanban is the tool that enables these
What is a kanban (pull) system?
An example of a virtual kanban system overlaid on a
                                   software development process
                                 PTC


                                                                   Eng Mgr


            Change              PM
           Requests                             Developers             Testers
                                      Kanban                 Kanban
                                      8 cards                8 cards
                                      (3 WIP
                                     5 Queue)


                                                                                  User Acceptance Test


 Product              Backlog                                           25 Days
Managers
We started visualizing these flows
     on white boards and holding
   standup meetings in front of it


   Provides the 1st (team) level of
     process capability feedback
WIP limits create a pull system and white
      board provides visualization of flow
 WIP Limit – regulates
 “inventory” at each
 stage in the process


                                     Pull


           Flow – from Engineering
           Ready to Release Ready
Queue Replenishment & delivery run on
        independently determined cadence
Queue
Replenishment                   Delivery Cadence
How often can we                    How often can
reasonably meet with                 customers (or
business                     downstream functions)
stakeholders?                    economically take
                                         delivery?
Colors represent
               classes of service
   Expedite
   Fixed Delivery Date
       Significant delay incurred on or
        from a specific date in near future
   Standard Class
       (Near) linear cost of delay
        beginning immediately
   Intangible Class
       No tangible cost of delay within
        reasonable lead time to delivery
        window
We discovered that standup meetings
      could be scaled to a large size


                  In this example more than 40 people
                    attend a standup for a large project
                         with 5 concurrent development
                          teams. The meeting is usually
                         completed in approximately 10
                          minutes. Never more than 15.
Major Project with two-tiered kanban board using swim
                     lanes for each development team


                   Swim lanes control WIP limit –
                   Requirement WIP (green)
                   controlled by number of lanes
Monthly Operations Review using quantitative
measures of capability & demand provides the 2nd
        (organization) level of process feedback
“After Meetings” after stand-ups to focus on
                  immediate process issues
Why do we pursue process
  improvements at all?
Goals for improvement initiatives


      Economically balance
    capability against demand
Available options


    Process
Most process
geeks & IT
managers are
operating over
here


           Process
Agile methods have been
 the favorite approach to improving
    capability in the 21st Century!
However, some people &
organizations have   resisted
    adoption of Agile methods!
If   not every organization is
 ready to adopt an Agile
method, how can we encourage them
    to become more Lean?
Kanban is the gateway to a
    Lean organization
So how do we go about
introducing Lean into
 organizations that have failed to
   adopt an Agile method such as
                           TDD?
The counter-intuitive answer is to
                            use a
    pull system         that limits
 work-in-progress to catalyze the
       introduction of other Lean
                         concepts
So What is the Kanban
     Method?
My   motivation for adopting
      kanban systems was to
 prevent overburdening, & control
    variability that affects flow

        and encourage an
      evolutionary
     approach to change
In developing the
 Kanban Method, a
change management approach that
  uses kanban systems to provoke
      change, we are enabling the
    emergence of Lean
          software development in
                    organizations
How does the

Kanban Method       work?
Kanban is based on 3 principles


1.     Start with what you do now
2.     Agree to pursue incremental,
       evolutionary change
3.     Initially, respect current roles,
       responsibilities & job titles
Then…

              then adopt   5 core
  practices that are observed
  to be present in successful Kanban
                     implementations
5 core practices for successful
            Kanban adoption
                                       Shallow
1.    Visualize
2.    Limit Work-in-Progress


                                         Depth
3.    Manage Flow
4.    Make Process Policies
      Explicit
5.    Improve Collaboratively
      (using models & scientific method) Deep
It‟s not a question of right or
wrong …
                                  Shallow


 It‟s a question of shallow or
             deep!


                                   Depth
  Shallow implementations
 tend to produce fewer, less
       dramatic results

                                   Deep
When…
When all 5 core practices are adopted
    they form the seed conditions for
           complex
       Kanban as a
 adaptive system that
 enables a Lean(er) way of working to
                             emerge
Visualize Workflow
Limit Work-in-Progress

20           3      2    4
Observe Flow (empty test column)
Observe Flow with a CFD

                     Device Management Ike II Cumulative Flow

               240
               220
               200
               180
               160
  Features


               140
               120                     Avg. Lead Time
               100
                80
                60                WIP             Avg. Throughput
                40
                20
                 0
                                             ar


                                                       ar
                eb


                        eb


                                  eb


                                                                 ar


                                                                           ar


                                                                                     ar
                                            M


                                                      M


                                                               -M


                                                                         -M


                                                                                   -M
               -F


                       -F


                                -F


                                         2-


                                                   9-
             10


                     17


                              24


                                                             16


                                                                       23


                                                                                 30
                                                  Time
                      Inventory   Started    Designed       Coded     Complete
From the simple geometry we can observe
                         Little‟s Law


                        WIP
Throughput   =
                    Lead Time

                    From observed capability
Observe Lead Time with a
control chart
Observe Flow with a spectral analysis histogram
                                    of lead time

                                                      Lead Time Distribution

              3.5

               3

              2.5
 CRs & Bugs


               2

              1.5

               1

              0.5

               0


                                                                                           6

                                                                                                3

                                                                                                     0

                                                                                                          7

                                                                                                               4

                                                                                                                    1

                                                                                                                         8
               1

                    8
                        15

                             22

                                  29

                                       36

                                            43

                                                 50

                                                       57

                                                            64

                                                                 71

                                                                      78

                                                                           85

                                                                                92

                                                                                     99
                                                                                          10

                                                                                               11

                                                                                                    12

                                                                                                         12

                                                                                                              13

                                                                                                                   14

                                                                                                                        14
                                                                      Days


                                                            SLA expectation of
Mean of                                                     51 days with 98% on-time
31 days
                                                  SLA expectation of
                                                  44 days with 85% on-time
Development is a Bottleneck


This is an example of using a
model to identify an
improvement opportunity
Analysis is overloaded


Analysis suffers from non-instant
availability of subject matter
experts / business owners
Couple observation of non-
instant availability of expertise
with visual & quantitative
evidence of muri in flow to
encourage better availability
Conversation & Leadership
Leadership is the magic
ingredient

     sprinkle liberally over the 5 seed
                             properties
The WIP limit provokes the
conversation
Without a WIP limit the Idle &
Stuck comments may never
emerge
The team has a choice to break
the WIP limit and ignore the
issues, or face up to the issues
and address them using the
models
The WIP limit simply provokes   the
conversation.
Leadership encourages discussion about
improvement. Use of Models and other
evidence leads to an improvement
suggestion and implementation
Big Projects with Kanban
Major Project with two-tiered kanban board using swim
                                  lanes for feature sets


                    Swim lanes control WIP limit –
                    Requirement WIP (green)
                    controlled by number of lanes
Kanban daily standup meetings can
                     be very large


                In this example more than 40 people
                  attend a standup for a large project
                       with 5 concurrent development
                        teams. The meeting is usually
                       completed in under 15 minutes
Spontaneous Quality Circles form after the standup to
                focus on immediate process issues


                Daily standup provides forum for spontaneous
                 association to attack process issues affecting
                 productivity and lead time

                3 day freeze on test environ was a transaction
                 cost on release that caused a bottleneck at
                 “build” state. Reduced to 24 hrs. Result was
                 improved smoother flow resulting in higher
                 throughput and shorter lead time.
Sticky Buddy scheme was instituted to allow remote
      workers to keep kanban board up-to-date and
               synchronized with electronic tracking


        “Cancelled” area
        With trash can
        For partially worked
        Items obe.
Estimating and
planning major
    projects
Cumulative Flow and
                                Predictive Modeling with S-Curve

                   Device Management Ike II Cumulative Flow

             240
             220
             200
             180
             160
Features


             140                                                  Typical S-curve
             120
             100
              80
              60
              40
              20
               0
                                          ar


                                                   ar
              eb


                      eb


                                eb


                                                             ar


                                                                       ar


                                                                                 ar
                                         M


                                                  M


                                                           -M


                                                                     -M


                                                                               -M
             -F


                     -F


                              -F


                                      2-


                                               9-
           10


                   17


                            24


                                                         16


                                                                   23


                                                                             30
                                               Time
                    Inventory   Started   Designed      Coded     Complete
Simulating S-Curve with a Z


                   Device Management Ike II Cumulative Flow

             240
             220                               60%
             200
             180
             160                Slope in middle
Features


             140
                                3.5x - 5x slope
             120
             100                    at ends                   5x
              80
              60    20%                                                      20%
              40
              20
               0
                                          ar


                                                    ar
              eb


                      eb


                                eb


                                                              ar


                                                                        ar


                                                                                  ar
                                         M


                                                   M


                                                            -M


                                                                      -M


                                                                                -M
             -F


                     -F


                              -F


                                      2-


                                                9-
           10


                   17


                            24


                                                          16


                                                                    23


                                                                              30
                                               Time
                    Inventory   Started    Designed      Coded     Complete
Track actual throughput against projection

                    Device Management Ike II Cumulative Flow

              240
              220
              200
              180
              160
 Features


              140
              120
              100
               80
                                                Track delta between
               60
               40                               planned and actual
               20                                    each day
                0
                                           ar


                                                     ar
               eb


                       eb


                                 eb


                                                               ar


                                                                         ar


                                                                                   ar
                                          M


                                                    M


                                                             -M


                                                                       -M


                                                                                 -M
              -F


                      -F


                               -F


                                       2-


                                                 9-
            10


                    17


                             24


                                                           16


                                                                     23


                                                                               30
                                                Time
                     Inventory   Started   Designed       Coded     Complete
Variability in Throughtput (velocity)
 It is important to understand the role throughput
 plays in long term planning in Kanban but why it
            is not useful for short-term goal setting
Often velocity exhibits a +/-2x spread of variation
  As a result velocity cannot be used as a short-
                               term planning tool
                           See following examples
Velocity Variation


South African Team from 2011plotted per Sprint (2 weekly)
Mean 29, UCL (+1 sigma) 43 (+1.5x), LCL (-1 sigma) 15 (- 2x)
DBA Team Velocity
90


80


70                                                                       Trend

60


50
                                                                         Total Velocity
                                                                         Small support tasks
40


30


20                                                                       Trend
                                                                 (not included
                                                                 in total velocity)

10
                Week of Christmas
 0


     Mattias Skarin client based in Paris in 2009/2010, plotted weekly
     Mean 42, +1 sigma = 55, -1 sigma = 29 (+/- 1.4x)
Investment Bank, London, Extreme Programming
Weekly Mean 10, Max = 16, Min = 6
Spread (+/- 1.6x)
Velocity Control Charts

                                                                   Completion Velocity Chart
            40


            30                UCL                                                                                  29.2


            20
                                                                                                                              Completion
Completion Velocity


                                                                                                                              Velocity
                                                                                                                              UCL
            10                CL                                                                                   7.206896552 Sigma
                                                                                                                             +2

                                                                                                                              +1 Sigma

                      0


       -10
                              LCL                                                                                  -14.8
                          1   2   3   4   5   6   7   8   9 10 11 12 13 14 15 16 17 18 19 20 21 22 23 24 25 26 27 28 29 30
       -20
                                                                            Date
                          Motorola PCS 2003, FDD project plotted
                          Daily Mean 7.2, +1 sigma = 15, -1 sigma = 0 (+/- 2x)
                          Weekly Mean 36, +1 sigma = 63, -1 sigma = 11 (+ 1.7x, -3.3x)
Variability in scope/requirements
It is also important to realize how much variability
         there is in the scope/scale or requirements
and how this must be accommodated in our plans
Unplanned Work Report
                                                             Scope Creep


                                                             Dark Matter
                                                             (emergent features)


                                                             Original Scope


Dark matter planned as a 19% expansion over original scope
Actual Dark Matter over final original scope is 26%
Total scope compared to original commitment is 13% greater
Typical Agile teams using User Stories analysis
                  produce 40-60% dark matter
Stories are recognized as Epics and broken into
                                  more stories.
  The customer does not consider the scope to
                               have changed
TV/Movie Company in USA 2008


Initial Scope is 125 story points
Within days this total scope reaches 190 due to dark matter expansion
Management intervened on 4/21 to stop dark matter (deferring future scope
to product backlog)
Observed dark matter expansion is 52% but real number was much greater
Original CFD shows same top line
                          Dark matter quotient is 19%
                   Device Management Ike II Cumulative Flow

             240
             220
             200
             180
             160
Features


             140
             120
             100
              80
                                               Track delta between
              60
              40                               planned and actual
              20                                    each day
               0
                                          ar


                                                    ar
              eb


                      eb


                                eb


                                                              ar


                                                                        ar


                                                                                  ar
                                         M


                                                   M


                                                            -M


                                                                      -M


                                                                                -M
             -F


                     -F


                              -F


                                      2-


                                                9-
           10


                   17


                            24


                                                          16


                                                                    23


                                                                              30
                                               Time
                    Inventory   Started   Designed       Coded     Complete
Make a long term plan to build
                      platform replacement
                    Device Management Ike II Cumulative Flow
                            Required throughput (velocity)
             240
             220
             200
             180
             160
Features


             140            Slope in middle
             120            3.5x - 5x slope
             100
                                at ends                    5x
              80
              60
              40
              20
               0
                   2006                                                  2008
                                         ar


                                                  ar
              eb


                       eb


                               eb


                                                           ar


                                                                    ar


                                                                             ar
                                        M


                                                 M


                                                         -M


                                                                  -M


                                                                           -M
             -F


                      -F


                              -F


                                     2-


                                              9-
           10


                    17


                            24


                                                       16


                                                                23


                                                                         30
                  During the middle 60% of the project schedule
                                           Time
                  we need Throughput (velocity) to average 13
                     Inventory Started Designed Coded Complete
                                     features per month
Little‟s Law


                             Determines staffing level
Target to achieve plan


                                  WIP
      Throughput         =
                              Lead Time

                               From observed capability

                               Treat as Fixed variable
Changing the WIP limit without
 maintaining the staffing level ratio
represents a change to the way of
     working. It is a change to the
system design. And will produce a
 change in the observed „common
   cause‟ capability of the system
Plan based on currently observed
    capability and current working
practices. Do not assume process
                    improvements.
         If changing WIP to reduce
            undesirable effects (e.g.
multitasking), get new sample data
  (perform a spike) to observe the
                     new capability
Little‟s Law


                              Determines staffing level
Target to achieve plan


                                    WIP
       13 / month        =
                               0.25 months
    WIP = 3.25, round up to 4.
              Might be safe to
                               From observed capability
              round down to 3.

    If current working practice is 1 unit WIP per person
  then 3 people are needed to work this project exclusively
Opportunities for Improvement
Educate the workforce to
recognize process problems that
             affect performance
Manage bottlenecks to increase
                                            throughput
Known max productivity


           Idea                  Analysis                Design                  Code
             ~90                       ~80                    ~50                       ~50
                         Error                   Error                Error

 Working           Acceptance              System                   Unit
  Code                Test                     Test
                                     How do I trim 25%              Test
                           ~80                     ~30
                                                   ~40                     ~50
                                    off the schedule for  Quality
                                      a project going
                                                         Schedule
1.    Identify - Current         CCR is System Test – 30
                                   through this system?
                                                    per month
2.    Exploit - Testers relieved of all non-essential tasks, extra
      PMs assigned to complete administrative tasks, analysts
      assigned to future test plans
3.    Subordinate - Requirements release restricted to ~30 per
      month
       Quality
4.    Elevate - Plan to recruit temporary testing staff immediately
      Schedule
Non-instant Availability

   Looks like a bottleneck
   Same thinking process applies


   Management approach is similar but policies
    will be different depending on type of
    bottleneck CCR vs NIA
Wimbledon comes in on time every year
 How do event planners do it?
Scheduling Wimbledon isn’t an exact
science

                     Except 2004 when it
                    rained on Sunday and
                       the final was on
                         Monday ;-)
                      Games last different lengths of time and weather
                      conditions can stop play altogether but the Men’s
                               Final always happens on the 2nd Sunday
                       If only we could project manage like this!
Quantity of pink issue tickets on board directly
 indicates flow impacting problems that need
                   attention from management


                         Issues are the exception –
                         attached to work items that are
                         blocked for external reasons and
                         call attention to problems
                         preventing smooth flow
Focusing on efficiency produces better cost
    accounting results for large batch sizes
But there are also coordination costs in knowledge
                                    work problems


                    Communication

                    Queue             Task W

             Queue            Task     Wait
Setup                                          Cleanup
          Queue       Task          Wait

        Q    Task             Wait

                       Time
And in knowledge work problems, coordination
        costs grow non-linearly with batch size


                     Communication

                     Queue             Task W

              Queue            Task     Wait
  Setup                                         Cleanup
           Queue       Task          Wait

          Q   Task             Wait

                        Time
Sources of Economic Costs


  Transaction Costs
  Coordination Costs

  Failure Demand
Transaction   Coordination Costs


                                          Transaction
cost


          Costs


                                             Costs
                     Value-added Work

                       Failure Demand
                            time
Good


Bad
Conclusions
Limiting work-in-progress can
catalyze incremental changes
respect
The team must                the
         WIP limit and value the
    conversations it
        provokes about problems
Leadership is the secret
sauce! Encourage it from any team
   member regardless of position,
           experience or authority
Enable the team with transparency of
 process (visualization of invisible
work & process dynamics.) Use models for
             understanding problems and
   improvements will occur.
These improvements will provide
better economic and sociological
            outcomes
Enabling our goal to…


  Economically balance
capability against demand
Thank you!


       dja@agilemanagement.net
http://www.agilemanagement.net/
About…
David Anderson is a thought leader in
managing effective software teams. He leads
a consulting firm dedicated to improving
economic performance of knowledge worker
businesses – improving agility, reducing
cycle times, improving productivity and
efficiency in technology development.
He has 25+ years experience in the software
industry starting with computer games in the
early 1980‟s. He has led software teams
delivering superior productivity and quality using
innovative agile methods. He developed MSF
for CMMI Process Improvement for Microsoft.
He is a co-author of the SEI Technical Note,
CMMI and Agile: Why not embrace both!
David‟s book, Agile Management for Software
Engineering – Applying the Theory of
Constraints for Business Results, introduced
many ideas from Lean and Theory of
Constraints into software engineering.
David was a founder of the Lean Software &
Systems Consortium, a not for profit dedicated
to promoting better standards of professionalism
and effectiveness in software engineering.
Email… dja@agilemanagement.net

More Related Content

What's hot

Vt2014 kanban presentation
Vt2014 kanban presentationVt2014 kanban presentation
Vt2014 kanban presentationplog99
 
Introduction to Kanban boards
Introduction to Kanban boardsIntroduction to Kanban boards
Introduction to Kanban boardsProofHub
 
Introduction to Kanban (June 2015)
Introduction to Kanban (June 2015)Introduction to Kanban (June 2015)
Introduction to Kanban (June 2015)Scrum & Kanban
 
Designing your kanban board to map your process
Designing your kanban board to map your processDesigning your kanban board to map your process
Designing your kanban board to map your processYu Liang
 
Kanban Basics for Beginners Revised
Kanban Basics for Beginners RevisedKanban Basics for Beginners Revised
Kanban Basics for Beginners RevisedZsolt Fabok
 
Kanban - Back to Basics
Kanban - Back to BasicsKanban - Back to Basics
Kanban - Back to BasicsHelen Meek
 
Kanban maturity model visualization examples
Kanban maturity model   visualization examplesKanban maturity model   visualization examples
Kanban maturity model visualization examplesRajesh Viswanathan
 
Kanban
KanbanKanban
Kanbanbramoe
 
Kanban on different flight levels - with an implementation example
Kanban on different flight levels - with an implementation exampleKanban on different flight levels - with an implementation example
Kanban on different flight levels - with an implementation exampleMichael Rumpler
 
Kanban in 4 easy steps
Kanban in 4 easy steps Kanban in 4 easy steps
Kanban in 4 easy steps Shore Labs
 
Kanban vs Scrum: What's the difference, and which should you use?
Kanban vs Scrum: What's the difference, and which should you use?Kanban vs Scrum: What's the difference, and which should you use?
Kanban vs Scrum: What's the difference, and which should you use?Arun Kumar
 
Presentation kanban
Presentation kanbanPresentation kanban
Presentation kanbanNasir Shakil
 
Value Stream Mapping
Value Stream MappingValue Stream Mapping
Value Stream MappingTKMG, Inc.
 
The Lego Kanban Game
The Lego Kanban GameThe Lego Kanban Game
The Lego Kanban GameLiz Keogh
 
Kanban/Scrumban - taking scrum outside its comfort zone
Kanban/Scrumban - taking scrum outside its comfort zoneKanban/Scrumban - taking scrum outside its comfort zone
Kanban/Scrumban - taking scrum outside its comfort zoneYuval Yeret
 

What's hot (20)

Vt2014 kanban presentation
Vt2014 kanban presentationVt2014 kanban presentation
Vt2014 kanban presentation
 
Introduction to Kanban boards
Introduction to Kanban boardsIntroduction to Kanban boards
Introduction to Kanban boards
 
Introduction to Kanban (June 2015)
Introduction to Kanban (June 2015)Introduction to Kanban (June 2015)
Introduction to Kanban (June 2015)
 
Designing your kanban board to map your process
Designing your kanban board to map your processDesigning your kanban board to map your process
Designing your kanban board to map your process
 
Kanban Basics for Beginners Revised
Kanban Basics for Beginners RevisedKanban Basics for Beginners Revised
Kanban Basics for Beginners Revised
 
Introduction to Kanban
Introduction to KanbanIntroduction to Kanban
Introduction to Kanban
 
Kanban - Back to Basics
Kanban - Back to BasicsKanban - Back to Basics
Kanban - Back to Basics
 
Kanban maturity model visualization examples
Kanban maturity model   visualization examplesKanban maturity model   visualization examples
Kanban maturity model visualization examples
 
Kanban
Kanban Kanban
Kanban
 
Kanban
KanbanKanban
Kanban
 
Kanban on different flight levels - with an implementation example
Kanban on different flight levels - with an implementation exampleKanban on different flight levels - with an implementation example
Kanban on different flight levels - with an implementation example
 
Kanban in 4 easy steps
Kanban in 4 easy steps Kanban in 4 easy steps
Kanban in 4 easy steps
 
Kanban vs Scrum: What's the difference, and which should you use?
Kanban vs Scrum: What's the difference, and which should you use?Kanban vs Scrum: What's the difference, and which should you use?
Kanban vs Scrum: What's the difference, and which should you use?
 
Presentation kanban
Presentation kanbanPresentation kanban
Presentation kanban
 
Value Stream Mapping
Value Stream MappingValue Stream Mapping
Value Stream Mapping
 
Lets kanban
Lets kanbanLets kanban
Lets kanban
 
The Lego Kanban Game
The Lego Kanban GameThe Lego Kanban Game
The Lego Kanban Game
 
Kanban
KanbanKanban
Kanban
 
KANBAN
KANBANKANBAN
KANBAN
 
Kanban/Scrumban - taking scrum outside its comfort zone
Kanban/Scrumban - taking scrum outside its comfort zoneKanban/Scrumban - taking scrum outside its comfort zone
Kanban/Scrumban - taking scrum outside its comfort zone
 

Viewers also liked

Kanban explained David Anderson LAS 2011-zurich
Kanban explained David Anderson LAS 2011-zurichKanban explained David Anderson LAS 2011-zurich
Kanban explained David Anderson LAS 2011-zurichWalter Schärer
 
Training - Introducing Agile, Lean and Kanban
Training - Introducing Agile, Lean and KanbanTraining - Introducing Agile, Lean and Kanban
Training - Introducing Agile, Lean and KanbanSudipta Lahiri
 
Advanced Kanban Boards
Advanced Kanban BoardsAdvanced Kanban Boards
Advanced Kanban BoardsSiddhi
 
Kanban Explained in 11 Slides
Kanban Explained in 11 SlidesKanban Explained in 11 Slides
Kanban Explained in 11 SlidesBrent Brewington
 
David Anderson Kanban At Q Con
David Anderson Kanban At Q ConDavid Anderson Kanban At Q Con
David Anderson Kanban At Q Condeimos
 
Kanban boards step by step
Kanban boards step by stepKanban boards step by step
Kanban boards step by stepGiulio Roggero
 

Viewers also liked (6)

Kanban explained David Anderson LAS 2011-zurich
Kanban explained David Anderson LAS 2011-zurichKanban explained David Anderson LAS 2011-zurich
Kanban explained David Anderson LAS 2011-zurich
 
Training - Introducing Agile, Lean and Kanban
Training - Introducing Agile, Lean and KanbanTraining - Introducing Agile, Lean and Kanban
Training - Introducing Agile, Lean and Kanban
 
Advanced Kanban Boards
Advanced Kanban BoardsAdvanced Kanban Boards
Advanced Kanban Boards
 
Kanban Explained in 11 Slides
Kanban Explained in 11 SlidesKanban Explained in 11 Slides
Kanban Explained in 11 Slides
 
David Anderson Kanban At Q Con
David Anderson Kanban At Q ConDavid Anderson Kanban At Q Con
David Anderson Kanban At Q Con
 
Kanban boards step by step
Kanban boards step by stepKanban boards step by step
Kanban boards step by step
 

Similar to Intro to Kanban - AgileDayChile2011 Keynote

LKIN2018: leveraging Lean and Kanban to implement continuous improvement
LKIN2018: leveraging Lean and Kanban to implement continuous improvementLKIN2018: leveraging Lean and Kanban to implement continuous improvement
LKIN2018: leveraging Lean and Kanban to implement continuous improvementRavi Tadwalkar
 
Lean Kanban India 2018 | Leveraging Lean and Kanban to implement Continuous ...
Lean Kanban India 2018 |  Leveraging Lean and Kanban to implement Continuous ...Lean Kanban India 2018 |  Leveraging Lean and Kanban to implement Continuous ...
Lean Kanban India 2018 | Leveraging Lean and Kanban to implement Continuous ...LeanKanbanIndia
 
CMTC Lean Introduction
CMTC Lean IntroductionCMTC Lean Introduction
CMTC Lean Introductionkdvictorine
 
Cmtc Lean Introduction
Cmtc Lean IntroductionCmtc Lean Introduction
Cmtc Lean Introductionkdvictorine
 
Kanban - The Alternate Path to Agile
Kanban - The Alternate Path to AgileKanban - The Alternate Path to Agile
Kanban - The Alternate Path to AgileMahesh Singh
 
David anderson kanban when is it not appropriate
David anderson   kanban when is it not appropriateDavid anderson   kanban when is it not appropriate
David anderson kanban when is it not appropriateAGILEMinds
 
Kanban Overview And Experience Report Export
Kanban Overview And Experience Report ExportKanban Overview And Experience Report Export
Kanban Overview And Experience Report ExportValtech UK
 
Kanban Overview And Experience Report Export
Kanban Overview And Experience Report ExportKanban Overview And Experience Report Export
Kanban Overview And Experience Report Exportdavidpeterjoyce
 
Kanban for Beginners - AgileEE 2011
Kanban for Beginners - AgileEE 2011Kanban for Beginners - AgileEE 2011
Kanban for Beginners - AgileEE 2011Robert Wiechmann
 
Introduction to product development flow
Introduction to product development flowIntroduction to product development flow
Introduction to product development flowYuval Yeret
 
Kanban - Evolutionary or Revolutionary?
Kanban - Evolutionary or Revolutionary?Kanban - Evolutionary or Revolutionary?
Kanban - Evolutionary or Revolutionary?Mahesh Singh
 
Lean Kanban India 2016 | It is not Scrum vs. Kanban! It is Scrum and Kanban! ...
Lean Kanban India 2016 | It is not Scrum vs. Kanban! It is Scrum and Kanban! ...Lean Kanban India 2016 | It is not Scrum vs. Kanban! It is Scrum and Kanban! ...
Lean Kanban India 2016 | It is not Scrum vs. Kanban! It is Scrum and Kanban! ...LeanKanbanIndia
 
It's not Scrum VS. Kanban! It is Scrum AND Kanban!
It's not Scrum VS. Kanban! It is Scrum AND Kanban!It's not Scrum VS. Kanban! It is Scrum AND Kanban!
It's not Scrum VS. Kanban! It is Scrum AND Kanban!Mahesh Singh
 
Manage a Complex Test Effort with Lean and Kanban
Manage a Complex Test Effort with Lean and KanbanManage a Complex Test Effort with Lean and Kanban
Manage a Complex Test Effort with Lean and KanbanTechWell
 
Kanban : optimising for predictability
Kanban : optimising for predictabilityKanban : optimising for predictability
Kanban : optimising for predictabilityNexer Digital
 
Cross-department Kanban Systems - 3 dimensions of scaling #llkd15
Cross-department Kanban Systems - 3 dimensions of scaling #llkd15Cross-department Kanban Systems - 3 dimensions of scaling #llkd15
Cross-department Kanban Systems - 3 dimensions of scaling #llkd15Andy Carmichael
 
Kanban at radical_fusion
Kanban at radical_fusionKanban at radical_fusion
Kanban at radical_fusionSam McAfee
 

Similar to Intro to Kanban - AgileDayChile2011 Keynote (20)

LKIN2018: leveraging Lean and Kanban to implement continuous improvement
LKIN2018: leveraging Lean and Kanban to implement continuous improvementLKIN2018: leveraging Lean and Kanban to implement continuous improvement
LKIN2018: leveraging Lean and Kanban to implement continuous improvement
 
Lean Kanban India 2018 | Leveraging Lean and Kanban to implement Continuous ...
Lean Kanban India 2018 |  Leveraging Lean and Kanban to implement Continuous ...Lean Kanban India 2018 |  Leveraging Lean and Kanban to implement Continuous ...
Lean Kanban India 2018 | Leveraging Lean and Kanban to implement Continuous ...
 
CMTC Lean Introduction
CMTC Lean IntroductionCMTC Lean Introduction
CMTC Lean Introduction
 
Cmtc Lean Introduction
Cmtc Lean IntroductionCmtc Lean Introduction
Cmtc Lean Introduction
 
Kanban 101
Kanban 101Kanban 101
Kanban 101
 
Kanban - The Alternate Path to Agile
Kanban - The Alternate Path to AgileKanban - The Alternate Path to Agile
Kanban - The Alternate Path to Agile
 
David anderson kanban when is it not appropriate
David anderson   kanban when is it not appropriateDavid anderson   kanban when is it not appropriate
David anderson kanban when is it not appropriate
 
Kanban Overview And Experience Report Export
Kanban Overview And Experience Report ExportKanban Overview And Experience Report Export
Kanban Overview And Experience Report Export
 
Kanban Overview And Experience Report Export
Kanban Overview And Experience Report ExportKanban Overview And Experience Report Export
Kanban Overview And Experience Report Export
 
Kanban for Beginners - AgileEE 2011
Kanban for Beginners - AgileEE 2011Kanban for Beginners - AgileEE 2011
Kanban for Beginners - AgileEE 2011
 
Introduction to product development flow
Introduction to product development flowIntroduction to product development flow
Introduction to product development flow
 
Kanban Evolutionary or Revolutionary
Kanban Evolutionary or RevolutionaryKanban Evolutionary or Revolutionary
Kanban Evolutionary or Revolutionary
 
Kanban - Evolutionary or Revolutionary?
Kanban - Evolutionary or Revolutionary?Kanban - Evolutionary or Revolutionary?
Kanban - Evolutionary or Revolutionary?
 
Lean Kanban India 2016 | It is not Scrum vs. Kanban! It is Scrum and Kanban! ...
Lean Kanban India 2016 | It is not Scrum vs. Kanban! It is Scrum and Kanban! ...Lean Kanban India 2016 | It is not Scrum vs. Kanban! It is Scrum and Kanban! ...
Lean Kanban India 2016 | It is not Scrum vs. Kanban! It is Scrum and Kanban! ...
 
It's not Scrum VS. Kanban! It is Scrum AND Kanban!
It's not Scrum VS. Kanban! It is Scrum AND Kanban!It's not Scrum VS. Kanban! It is Scrum AND Kanban!
It's not Scrum VS. Kanban! It is Scrum AND Kanban!
 
Manage a Complex Test Effort with Lean and Kanban
Manage a Complex Test Effort with Lean and KanbanManage a Complex Test Effort with Lean and Kanban
Manage a Complex Test Effort with Lean and Kanban
 
Kanban : optimising for predictability
Kanban : optimising for predictabilityKanban : optimising for predictability
Kanban : optimising for predictability
 
Kanban English
Kanban   EnglishKanban   English
Kanban English
 
Cross-department Kanban Systems - 3 dimensions of scaling #llkd15
Cross-department Kanban Systems - 3 dimensions of scaling #llkd15Cross-department Kanban Systems - 3 dimensions of scaling #llkd15
Cross-department Kanban Systems - 3 dimensions of scaling #llkd15
 
Kanban at radical_fusion
Kanban at radical_fusionKanban at radical_fusion
Kanban at radical_fusion
 

More from ChileAgil

20161121 - Historia de las Politicas de ChileAgil.pdf
20161121 - Historia de las Politicas de ChileAgil.pdf20161121 - Historia de las Politicas de ChileAgil.pdf
20161121 - Historia de las Politicas de ChileAgil.pdfChileAgil
 
LATAM Digital en ChileAgil via @elisenerman
LATAM Digital en ChileAgil via @elisenermanLATAM Digital en ChileAgil via @elisenerman
LATAM Digital en ChileAgil via @elisenermanChileAgil
 
Mesa Redonda Desafios Agilidad en Chile - Rodrigo Contreras
Mesa Redonda Desafios Agilidad en Chile - Rodrigo ContrerasMesa Redonda Desafios Agilidad en Chile - Rodrigo Contreras
Mesa Redonda Desafios Agilidad en Chile - Rodrigo ContrerasChileAgil
 
Mesa Redonda Desafios Agilidad en Chile - Hector contreras - BCI
Mesa Redonda Desafios Agilidad en Chile - Hector contreras  - BCIMesa Redonda Desafios Agilidad en Chile - Hector contreras  - BCI
Mesa Redonda Desafios Agilidad en Chile - Hector contreras - BCIChileAgil
 
Hackers de Culturas Organizacionales - Motivacion
Hackers de Culturas Organizacionales - MotivacionHackers de Culturas Organizacionales - Motivacion
Hackers de Culturas Organizacionales - MotivacionChileAgil
 
AgileDayChile 2013: Construyendo Agilidad Agilmente
AgileDayChile 2013: Construyendo Agilidad AgilmenteAgileDayChile 2013: Construyendo Agilidad Agilmente
AgileDayChile 2013: Construyendo Agilidad AgilmenteChileAgil
 
"The Lean Mindset": Mary & Tom Poppendieck's Keynote at AgileDayChile 2013
"The Lean Mindset": Mary & Tom Poppendieck's Keynote at AgileDayChile 2013"The Lean Mindset": Mary & Tom Poppendieck's Keynote at AgileDayChile 2013
"The Lean Mindset": Mary & Tom Poppendieck's Keynote at AgileDayChile 2013ChileAgil
 
Charla una receta para implantar agilismo en asignaturas de ingeniería de so...
Charla  una receta para implantar agilismo en asignaturas de ingeniería de so...Charla  una receta para implantar agilismo en asignaturas de ingeniería de so...
Charla una receta para implantar agilismo en asignaturas de ingeniería de so...ChileAgil
 
Edmundo leiva lecciones con scrum 26-09-13
Edmundo leiva   lecciones con scrum 26-09-13Edmundo leiva   lecciones con scrum 26-09-13
Edmundo leiva lecciones con scrum 26-09-13ChileAgil
 
Gerardo Cerda - Compartiendo experiencias - 20130926
Gerardo Cerda   - Compartiendo experiencias - 20130926Gerardo Cerda   - Compartiendo experiencias - 20130926
Gerardo Cerda - Compartiendo experiencias - 20130926ChileAgil
 
Agustin Villena - La realidad de la Agilidad en Chile
Agustin Villena  - La realidad de la Agilidad en ChileAgustin Villena  - La realidad de la Agilidad en Chile
Agustin Villena - La realidad de la Agilidad en ChileChileAgil
 
Un camino de 4 años - Experiencia de agilidad en el SII
Un camino de 4 años - Experiencia de agilidad en el SIIUn camino de 4 años - Experiencia de agilidad en el SII
Un camino de 4 años - Experiencia de agilidad en el SIIChileAgil
 
Celeste aguayo - Experiencia de Agilidad en Genera S.A.
Celeste aguayo  - Experiencia de Agilidad en Genera S.A.Celeste aguayo  - Experiencia de Agilidad en Genera S.A.
Celeste aguayo - Experiencia de Agilidad en Genera S.A.ChileAgil
 
Implantando prácticas ágiles en un contexto multiproyecto
Implantando prácticas ágiles en un contexto multiproyectoImplantando prácticas ágiles en un contexto multiproyecto
Implantando prácticas ágiles en un contexto multiproyectoChileAgil
 
Levantamiento Ciudadano Ágil - Nuestra Providencia enero 2012
Levantamiento Ciudadano Ágil - Nuestra Providencia enero 2012Levantamiento Ciudadano Ágil - Nuestra Providencia enero 2012
Levantamiento Ciudadano Ágil - Nuestra Providencia enero 2012ChileAgil
 
10 años de evolución del Taller de metodologias Agiles
10 años de evolución del Taller de metodologias Agiles10 años de evolución del Taller de metodologias Agiles
10 años de evolución del Taller de metodologias AgilesChileAgil
 
Conocer a tus clientes e Inteligencia Colectiva: Claves 2.0
Conocer a tus clientes e Inteligencia Colectiva: Claves 2.0Conocer a tus clientes e Inteligencia Colectiva: Claves 2.0
Conocer a tus clientes e Inteligencia Colectiva: Claves 2.0ChileAgil
 
Un terremoto, cientos de voluntarios y 6 días para levantar un portal
Un terremoto, cientos de voluntarios y 6 días para levantar un portalUn terremoto, cientos de voluntarios y 6 días para levantar un portal
Un terremoto, cientos de voluntarios y 6 días para levantar un portalChileAgil
 
Agile Perú & Agiles 2010
Agile Perú & Agiles 2010Agile Perú & Agiles 2010
Agile Perú & Agiles 2010ChileAgil
 
ALD.cl.09 Caso de Exito - NameAction
ALD.cl.09 Caso de Exito - NameActionALD.cl.09 Caso de Exito - NameAction
ALD.cl.09 Caso de Exito - NameActionChileAgil
 

More from ChileAgil (20)

20161121 - Historia de las Politicas de ChileAgil.pdf
20161121 - Historia de las Politicas de ChileAgil.pdf20161121 - Historia de las Politicas de ChileAgil.pdf
20161121 - Historia de las Politicas de ChileAgil.pdf
 
LATAM Digital en ChileAgil via @elisenerman
LATAM Digital en ChileAgil via @elisenermanLATAM Digital en ChileAgil via @elisenerman
LATAM Digital en ChileAgil via @elisenerman
 
Mesa Redonda Desafios Agilidad en Chile - Rodrigo Contreras
Mesa Redonda Desafios Agilidad en Chile - Rodrigo ContrerasMesa Redonda Desafios Agilidad en Chile - Rodrigo Contreras
Mesa Redonda Desafios Agilidad en Chile - Rodrigo Contreras
 
Mesa Redonda Desafios Agilidad en Chile - Hector contreras - BCI
Mesa Redonda Desafios Agilidad en Chile - Hector contreras  - BCIMesa Redonda Desafios Agilidad en Chile - Hector contreras  - BCI
Mesa Redonda Desafios Agilidad en Chile - Hector contreras - BCI
 
Hackers de Culturas Organizacionales - Motivacion
Hackers de Culturas Organizacionales - MotivacionHackers de Culturas Organizacionales - Motivacion
Hackers de Culturas Organizacionales - Motivacion
 
AgileDayChile 2013: Construyendo Agilidad Agilmente
AgileDayChile 2013: Construyendo Agilidad AgilmenteAgileDayChile 2013: Construyendo Agilidad Agilmente
AgileDayChile 2013: Construyendo Agilidad Agilmente
 
"The Lean Mindset": Mary & Tom Poppendieck's Keynote at AgileDayChile 2013
"The Lean Mindset": Mary & Tom Poppendieck's Keynote at AgileDayChile 2013"The Lean Mindset": Mary & Tom Poppendieck's Keynote at AgileDayChile 2013
"The Lean Mindset": Mary & Tom Poppendieck's Keynote at AgileDayChile 2013
 
Charla una receta para implantar agilismo en asignaturas de ingeniería de so...
Charla  una receta para implantar agilismo en asignaturas de ingeniería de so...Charla  una receta para implantar agilismo en asignaturas de ingeniería de so...
Charla una receta para implantar agilismo en asignaturas de ingeniería de so...
 
Edmundo leiva lecciones con scrum 26-09-13
Edmundo leiva   lecciones con scrum 26-09-13Edmundo leiva   lecciones con scrum 26-09-13
Edmundo leiva lecciones con scrum 26-09-13
 
Gerardo Cerda - Compartiendo experiencias - 20130926
Gerardo Cerda   - Compartiendo experiencias - 20130926Gerardo Cerda   - Compartiendo experiencias - 20130926
Gerardo Cerda - Compartiendo experiencias - 20130926
 
Agustin Villena - La realidad de la Agilidad en Chile
Agustin Villena  - La realidad de la Agilidad en ChileAgustin Villena  - La realidad de la Agilidad en Chile
Agustin Villena - La realidad de la Agilidad en Chile
 
Un camino de 4 años - Experiencia de agilidad en el SII
Un camino de 4 años - Experiencia de agilidad en el SIIUn camino de 4 años - Experiencia de agilidad en el SII
Un camino de 4 años - Experiencia de agilidad en el SII
 
Celeste aguayo - Experiencia de Agilidad en Genera S.A.
Celeste aguayo  - Experiencia de Agilidad en Genera S.A.Celeste aguayo  - Experiencia de Agilidad en Genera S.A.
Celeste aguayo - Experiencia de Agilidad en Genera S.A.
 
Implantando prácticas ágiles en un contexto multiproyecto
Implantando prácticas ágiles en un contexto multiproyectoImplantando prácticas ágiles en un contexto multiproyecto
Implantando prácticas ágiles en un contexto multiproyecto
 
Levantamiento Ciudadano Ágil - Nuestra Providencia enero 2012
Levantamiento Ciudadano Ágil - Nuestra Providencia enero 2012Levantamiento Ciudadano Ágil - Nuestra Providencia enero 2012
Levantamiento Ciudadano Ágil - Nuestra Providencia enero 2012
 
10 años de evolución del Taller de metodologias Agiles
10 años de evolución del Taller de metodologias Agiles10 años de evolución del Taller de metodologias Agiles
10 años de evolución del Taller de metodologias Agiles
 
Conocer a tus clientes e Inteligencia Colectiva: Claves 2.0
Conocer a tus clientes e Inteligencia Colectiva: Claves 2.0Conocer a tus clientes e Inteligencia Colectiva: Claves 2.0
Conocer a tus clientes e Inteligencia Colectiva: Claves 2.0
 
Un terremoto, cientos de voluntarios y 6 días para levantar un portal
Un terremoto, cientos de voluntarios y 6 días para levantar un portalUn terremoto, cientos de voluntarios y 6 días para levantar un portal
Un terremoto, cientos de voluntarios y 6 días para levantar un portal
 
Agile Perú & Agiles 2010
Agile Perú & Agiles 2010Agile Perú & Agiles 2010
Agile Perú & Agiles 2010
 
ALD.cl.09 Caso de Exito - NameAction
ALD.cl.09 Caso de Exito - NameActionALD.cl.09 Caso de Exito - NameAction
ALD.cl.09 Caso de Exito - NameAction
 

Recently uploaded

Unleashing Real-time Insights with ClickHouse_ Navigating the Landscape in 20...
Unleashing Real-time Insights with ClickHouse_ Navigating the Landscape in 20...Unleashing Real-time Insights with ClickHouse_ Navigating the Landscape in 20...
Unleashing Real-time Insights with ClickHouse_ Navigating the Landscape in 20...Alkin Tezuysal
 
Generative Artificial Intelligence: How generative AI works.pdf
Generative Artificial Intelligence: How generative AI works.pdfGenerative Artificial Intelligence: How generative AI works.pdf
Generative Artificial Intelligence: How generative AI works.pdfIngrid Airi González
 
Infrared simulation and processing on Nvidia platforms
Infrared simulation and processing on Nvidia platformsInfrared simulation and processing on Nvidia platforms
Infrared simulation and processing on Nvidia platformsYoss Cohen
 
Microsoft 365 Copilot: How to boost your productivity with AI – Part two: Dat...
Microsoft 365 Copilot: How to boost your productivity with AI – Part two: Dat...Microsoft 365 Copilot: How to boost your productivity with AI – Part two: Dat...
Microsoft 365 Copilot: How to boost your productivity with AI – Part two: Dat...Nikki Chapple
 
Abdul Kader Baba- Managing Cybersecurity Risks and Compliance Requirements i...
Abdul Kader Baba- Managing Cybersecurity Risks  and Compliance Requirements i...Abdul Kader Baba- Managing Cybersecurity Risks  and Compliance Requirements i...
Abdul Kader Baba- Managing Cybersecurity Risks and Compliance Requirements i...itnewsafrica
 
Genislab builds better products and faster go-to-market with Lean project man...
Genislab builds better products and faster go-to-market with Lean project man...Genislab builds better products and faster go-to-market with Lean project man...
Genislab builds better products and faster go-to-market with Lean project man...Farhan Tariq
 
Emixa Mendix Meetup 11 April 2024 about Mendix Native development
Emixa Mendix Meetup 11 April 2024 about Mendix Native developmentEmixa Mendix Meetup 11 April 2024 about Mendix Native development
Emixa Mendix Meetup 11 April 2024 about Mendix Native developmentPim van der Noll
 
Long journey of Ruby standard library at RubyConf AU 2024
Long journey of Ruby standard library at RubyConf AU 2024Long journey of Ruby standard library at RubyConf AU 2024
Long journey of Ruby standard library at RubyConf AU 2024Hiroshi SHIBATA
 
Design pattern talk by Kaya Weers - 2024 (v2)
Design pattern talk by Kaya Weers - 2024 (v2)Design pattern talk by Kaya Weers - 2024 (v2)
Design pattern talk by Kaya Weers - 2024 (v2)Kaya Weers
 
Kuma Meshes Part I - The basics - A tutorial
Kuma Meshes Part I - The basics - A tutorialKuma Meshes Part I - The basics - A tutorial
Kuma Meshes Part I - The basics - A tutorialJoão Esperancinha
 
Irene Moetsana-Moeng: Stakeholders in Cybersecurity: Collaborative Defence fo...
Irene Moetsana-Moeng: Stakeholders in Cybersecurity: Collaborative Defence fo...Irene Moetsana-Moeng: Stakeholders in Cybersecurity: Collaborative Defence fo...
Irene Moetsana-Moeng: Stakeholders in Cybersecurity: Collaborative Defence fo...itnewsafrica
 
UiPath Community: Communication Mining from Zero to Hero
UiPath Community: Communication Mining from Zero to HeroUiPath Community: Communication Mining from Zero to Hero
UiPath Community: Communication Mining from Zero to HeroUiPathCommunity
 
Generative AI - Gitex v1Generative AI - Gitex v1.pptx
Generative AI - Gitex v1Generative AI - Gitex v1.pptxGenerative AI - Gitex v1Generative AI - Gitex v1.pptx
Generative AI - Gitex v1Generative AI - Gitex v1.pptxfnnc6jmgwh
 
A Journey Into the Emotions of Software Developers
A Journey Into the Emotions of Software DevelopersA Journey Into the Emotions of Software Developers
A Journey Into the Emotions of Software DevelopersNicole Novielli
 
All These Sophisticated Attacks, Can We Really Detect Them - PDF
All These Sophisticated Attacks, Can We Really Detect Them - PDFAll These Sophisticated Attacks, Can We Really Detect Them - PDF
All These Sophisticated Attacks, Can We Really Detect Them - PDFMichael Gough
 
Arizona Broadband Policy Past, Present, and Future Presentation 3/25/24
Arizona Broadband Policy Past, Present, and Future Presentation 3/25/24Arizona Broadband Policy Past, Present, and Future Presentation 3/25/24
Arizona Broadband Policy Past, Present, and Future Presentation 3/25/24Mark Goldstein
 
How to Effectively Monitor SD-WAN and SASE Environments with ThousandEyes
How to Effectively Monitor SD-WAN and SASE Environments with ThousandEyesHow to Effectively Monitor SD-WAN and SASE Environments with ThousandEyes
How to Effectively Monitor SD-WAN and SASE Environments with ThousandEyesThousandEyes
 
Varsha Sewlal- Cyber Attacks on Critical Critical Infrastructure
Varsha Sewlal- Cyber Attacks on Critical Critical InfrastructureVarsha Sewlal- Cyber Attacks on Critical Critical Infrastructure
Varsha Sewlal- Cyber Attacks on Critical Critical Infrastructureitnewsafrica
 
A Glance At The Java Performance Toolbox
A Glance At The Java Performance ToolboxA Glance At The Java Performance Toolbox
A Glance At The Java Performance ToolboxAna-Maria Mihalceanu
 
The Future Roadmap for the Composable Data Stack - Wes McKinney - Data Counci...
The Future Roadmap for the Composable Data Stack - Wes McKinney - Data Counci...The Future Roadmap for the Composable Data Stack - Wes McKinney - Data Counci...
The Future Roadmap for the Composable Data Stack - Wes McKinney - Data Counci...Wes McKinney
 

Recently uploaded (20)

Unleashing Real-time Insights with ClickHouse_ Navigating the Landscape in 20...
Unleashing Real-time Insights with ClickHouse_ Navigating the Landscape in 20...Unleashing Real-time Insights with ClickHouse_ Navigating the Landscape in 20...
Unleashing Real-time Insights with ClickHouse_ Navigating the Landscape in 20...
 
Generative Artificial Intelligence: How generative AI works.pdf
Generative Artificial Intelligence: How generative AI works.pdfGenerative Artificial Intelligence: How generative AI works.pdf
Generative Artificial Intelligence: How generative AI works.pdf
 
Infrared simulation and processing on Nvidia platforms
Infrared simulation and processing on Nvidia platformsInfrared simulation and processing on Nvidia platforms
Infrared simulation and processing on Nvidia platforms
 
Microsoft 365 Copilot: How to boost your productivity with AI – Part two: Dat...
Microsoft 365 Copilot: How to boost your productivity with AI – Part two: Dat...Microsoft 365 Copilot: How to boost your productivity with AI – Part two: Dat...
Microsoft 365 Copilot: How to boost your productivity with AI – Part two: Dat...
 
Abdul Kader Baba- Managing Cybersecurity Risks and Compliance Requirements i...
Abdul Kader Baba- Managing Cybersecurity Risks  and Compliance Requirements i...Abdul Kader Baba- Managing Cybersecurity Risks  and Compliance Requirements i...
Abdul Kader Baba- Managing Cybersecurity Risks and Compliance Requirements i...
 
Genislab builds better products and faster go-to-market with Lean project man...
Genislab builds better products and faster go-to-market with Lean project man...Genislab builds better products and faster go-to-market with Lean project man...
Genislab builds better products and faster go-to-market with Lean project man...
 
Emixa Mendix Meetup 11 April 2024 about Mendix Native development
Emixa Mendix Meetup 11 April 2024 about Mendix Native developmentEmixa Mendix Meetup 11 April 2024 about Mendix Native development
Emixa Mendix Meetup 11 April 2024 about Mendix Native development
 
Long journey of Ruby standard library at RubyConf AU 2024
Long journey of Ruby standard library at RubyConf AU 2024Long journey of Ruby standard library at RubyConf AU 2024
Long journey of Ruby standard library at RubyConf AU 2024
 
Design pattern talk by Kaya Weers - 2024 (v2)
Design pattern talk by Kaya Weers - 2024 (v2)Design pattern talk by Kaya Weers - 2024 (v2)
Design pattern talk by Kaya Weers - 2024 (v2)
 
Kuma Meshes Part I - The basics - A tutorial
Kuma Meshes Part I - The basics - A tutorialKuma Meshes Part I - The basics - A tutorial
Kuma Meshes Part I - The basics - A tutorial
 
Irene Moetsana-Moeng: Stakeholders in Cybersecurity: Collaborative Defence fo...
Irene Moetsana-Moeng: Stakeholders in Cybersecurity: Collaborative Defence fo...Irene Moetsana-Moeng: Stakeholders in Cybersecurity: Collaborative Defence fo...
Irene Moetsana-Moeng: Stakeholders in Cybersecurity: Collaborative Defence fo...
 
UiPath Community: Communication Mining from Zero to Hero
UiPath Community: Communication Mining from Zero to HeroUiPath Community: Communication Mining from Zero to Hero
UiPath Community: Communication Mining from Zero to Hero
 
Generative AI - Gitex v1Generative AI - Gitex v1.pptx
Generative AI - Gitex v1Generative AI - Gitex v1.pptxGenerative AI - Gitex v1Generative AI - Gitex v1.pptx
Generative AI - Gitex v1Generative AI - Gitex v1.pptx
 
A Journey Into the Emotions of Software Developers
A Journey Into the Emotions of Software DevelopersA Journey Into the Emotions of Software Developers
A Journey Into the Emotions of Software Developers
 
All These Sophisticated Attacks, Can We Really Detect Them - PDF
All These Sophisticated Attacks, Can We Really Detect Them - PDFAll These Sophisticated Attacks, Can We Really Detect Them - PDF
All These Sophisticated Attacks, Can We Really Detect Them - PDF
 
Arizona Broadband Policy Past, Present, and Future Presentation 3/25/24
Arizona Broadband Policy Past, Present, and Future Presentation 3/25/24Arizona Broadband Policy Past, Present, and Future Presentation 3/25/24
Arizona Broadband Policy Past, Present, and Future Presentation 3/25/24
 
How to Effectively Monitor SD-WAN and SASE Environments with ThousandEyes
How to Effectively Monitor SD-WAN and SASE Environments with ThousandEyesHow to Effectively Monitor SD-WAN and SASE Environments with ThousandEyes
How to Effectively Monitor SD-WAN and SASE Environments with ThousandEyes
 
Varsha Sewlal- Cyber Attacks on Critical Critical Infrastructure
Varsha Sewlal- Cyber Attacks on Critical Critical InfrastructureVarsha Sewlal- Cyber Attacks on Critical Critical Infrastructure
Varsha Sewlal- Cyber Attacks on Critical Critical Infrastructure
 
A Glance At The Java Performance Toolbox
A Glance At The Java Performance ToolboxA Glance At The Java Performance Toolbox
A Glance At The Java Performance Toolbox
 
The Future Roadmap for the Composable Data Stack - Wes McKinney - Data Counci...
The Future Roadmap for the Composable Data Stack - Wes McKinney - Data Counci...The Future Roadmap for the Composable Data Stack - Wes McKinney - Data Counci...
The Future Roadmap for the Composable Data Stack - Wes McKinney - Data Counci...
 

Intro to Kanban - AgileDayChile2011 Keynote

  • 1. An Introduction to Kanban What is it & why would I use it? David J. Anderson David J. Anderson & Associates dja@djandersonassociates.com
  • 2. Book Published April 2010 A 72,000 word intro to the topic
  • 3. German published January, 2011 Translation by Arne Roock & Henning Wolf of IT-Agile
  • 4. Spanish published May 2011 Translated by Masa K Maeda, PhD
  • 5. Portuguese (Brazilian) published October 2011 Translation by Andrea Pinto Recife, Brazil
  • 6. http://leankanbanuniversity.com http://www.limitedwipsociety.org LinkedIn Groups: Software Kanban Yahoo! Groups: kanbandev Yahoo! Groups: kanbanops
  • 7.
  • 8. Taiichi Ohno… TPS = JIT + Autonomation Kanban is the tool that enables these
  • 9. What is a kanban (pull) system?
  • 10. An example of a virtual kanban system overlaid on a software development process PTC Eng Mgr Change PM Requests Developers Testers Kanban Kanban 8 cards 8 cards (3 WIP 5 Queue) User Acceptance Test Product Backlog 25 Days Managers
  • 11. We started visualizing these flows on white boards and holding standup meetings in front of it Provides the 1st (team) level of process capability feedback
  • 12. WIP limits create a pull system and white board provides visualization of flow WIP Limit – regulates “inventory” at each stage in the process Pull Flow – from Engineering Ready to Release Ready
  • 13. Queue Replenishment & delivery run on independently determined cadence Queue Replenishment Delivery Cadence How often can we How often can reasonably meet with customers (or business downstream functions) stakeholders? economically take delivery?
  • 14. Colors represent classes of service  Expedite  Fixed Delivery Date  Significant delay incurred on or from a specific date in near future  Standard Class  (Near) linear cost of delay beginning immediately  Intangible Class  No tangible cost of delay within reasonable lead time to delivery window
  • 15. We discovered that standup meetings could be scaled to a large size In this example more than 40 people attend a standup for a large project with 5 concurrent development teams. The meeting is usually completed in approximately 10 minutes. Never more than 15.
  • 16. Major Project with two-tiered kanban board using swim lanes for each development team Swim lanes control WIP limit – Requirement WIP (green) controlled by number of lanes
  • 17. Monthly Operations Review using quantitative measures of capability & demand provides the 2nd (organization) level of process feedback
  • 18. “After Meetings” after stand-ups to focus on immediate process issues
  • 19. Why do we pursue process improvements at all?
  • 20. Goals for improvement initiatives Economically balance capability against demand
  • 21. Available options Process
  • 22. Most process geeks & IT managers are operating over here Process
  • 23. Agile methods have been the favorite approach to improving capability in the 21st Century!
  • 24. However, some people & organizations have resisted adoption of Agile methods!
  • 25. If not every organization is ready to adopt an Agile method, how can we encourage them to become more Lean?
  • 26. Kanban is the gateway to a Lean organization
  • 27. So how do we go about introducing Lean into organizations that have failed to adopt an Agile method such as TDD?
  • 28. The counter-intuitive answer is to use a pull system that limits work-in-progress to catalyze the introduction of other Lean concepts
  • 29. So What is the Kanban Method?
  • 30. My motivation for adopting kanban systems was to prevent overburdening, & control variability that affects flow and encourage an evolutionary approach to change
  • 31. In developing the Kanban Method, a change management approach that uses kanban systems to provoke change, we are enabling the emergence of Lean software development in organizations
  • 32. How does the Kanban Method work?
  • 33. Kanban is based on 3 principles 1. Start with what you do now 2. Agree to pursue incremental, evolutionary change 3. Initially, respect current roles, responsibilities & job titles
  • 34. Then… then adopt 5 core practices that are observed to be present in successful Kanban implementations
  • 35. 5 core practices for successful Kanban adoption Shallow 1. Visualize 2. Limit Work-in-Progress Depth 3. Manage Flow 4. Make Process Policies Explicit 5. Improve Collaboratively (using models & scientific method) Deep
  • 36. It‟s not a question of right or wrong … Shallow It‟s a question of shallow or deep! Depth Shallow implementations tend to produce fewer, less dramatic results Deep
  • 37. When… When all 5 core practices are adopted they form the seed conditions for complex Kanban as a adaptive system that enables a Lean(er) way of working to emerge
  • 38.
  • 41. Observe Flow (empty test column)
  • 42. Observe Flow with a CFD Device Management Ike II Cumulative Flow 240 220 200 180 160 Features 140 120 Avg. Lead Time 100 80 60 WIP Avg. Throughput 40 20 0 ar ar eb eb eb ar ar ar M M -M -M -M -F -F -F 2- 9- 10 17 24 16 23 30 Time Inventory Started Designed Coded Complete
  • 43. From the simple geometry we can observe Little‟s Law WIP Throughput = Lead Time From observed capability
  • 44. Observe Lead Time with a control chart
  • 45. Observe Flow with a spectral analysis histogram of lead time Lead Time Distribution 3.5 3 2.5 CRs & Bugs 2 1.5 1 0.5 0 6 3 0 7 4 1 8 1 8 15 22 29 36 43 50 57 64 71 78 85 92 99 10 11 12 12 13 14 14 Days SLA expectation of Mean of 51 days with 98% on-time 31 days SLA expectation of 44 days with 85% on-time
  • 46. Development is a Bottleneck This is an example of using a model to identify an improvement opportunity
  • 47. Analysis is overloaded Analysis suffers from non-instant availability of subject matter experts / business owners
  • 48. Couple observation of non- instant availability of expertise with visual & quantitative evidence of muri in flow to encourage better availability
  • 50. Leadership is the magic ingredient sprinkle liberally over the 5 seed properties
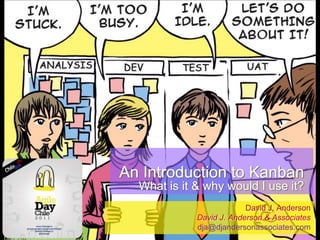
  • 51. The WIP limit provokes the conversation
  • 52. Without a WIP limit the Idle & Stuck comments may never emerge
  • 53. The team has a choice to break the WIP limit and ignore the issues, or face up to the issues and address them using the models
  • 54. The WIP limit simply provokes the conversation. Leadership encourages discussion about improvement. Use of Models and other evidence leads to an improvement suggestion and implementation
  • 56. Major Project with two-tiered kanban board using swim lanes for feature sets Swim lanes control WIP limit – Requirement WIP (green) controlled by number of lanes
  • 57. Kanban daily standup meetings can be very large In this example more than 40 people attend a standup for a large project with 5 concurrent development teams. The meeting is usually completed in under 15 minutes
  • 58. Spontaneous Quality Circles form after the standup to focus on immediate process issues  Daily standup provides forum for spontaneous association to attack process issues affecting productivity and lead time  3 day freeze on test environ was a transaction cost on release that caused a bottleneck at “build” state. Reduced to 24 hrs. Result was improved smoother flow resulting in higher throughput and shorter lead time.
  • 59. Sticky Buddy scheme was instituted to allow remote workers to keep kanban board up-to-date and synchronized with electronic tracking “Cancelled” area With trash can For partially worked Items obe.
  • 61. Cumulative Flow and Predictive Modeling with S-Curve Device Management Ike II Cumulative Flow 240 220 200 180 160 Features 140 Typical S-curve 120 100 80 60 40 20 0 ar ar eb eb eb ar ar ar M M -M -M -M -F -F -F 2- 9- 10 17 24 16 23 30 Time Inventory Started Designed Coded Complete
  • 62. Simulating S-Curve with a Z Device Management Ike II Cumulative Flow 240 220 60% 200 180 160 Slope in middle Features 140 3.5x - 5x slope 120 100 at ends 5x 80 60 20% 20% 40 20 0 ar ar eb eb eb ar ar ar M M -M -M -M -F -F -F 2- 9- 10 17 24 16 23 30 Time Inventory Started Designed Coded Complete
  • 63. Track actual throughput against projection Device Management Ike II Cumulative Flow 240 220 200 180 160 Features 140 120 100 80 Track delta between 60 40 planned and actual 20 each day 0 ar ar eb eb eb ar ar ar M M -M -M -M -F -F -F 2- 9- 10 17 24 16 23 30 Time Inventory Started Designed Coded Complete
  • 64. Variability in Throughtput (velocity) It is important to understand the role throughput plays in long term planning in Kanban but why it is not useful for short-term goal setting Often velocity exhibits a +/-2x spread of variation As a result velocity cannot be used as a short- term planning tool See following examples
  • 65. Velocity Variation South African Team from 2011plotted per Sprint (2 weekly) Mean 29, UCL (+1 sigma) 43 (+1.5x), LCL (-1 sigma) 15 (- 2x)
  • 66. DBA Team Velocity 90 80 70 Trend 60 50 Total Velocity Small support tasks 40 30 20 Trend (not included in total velocity) 10 Week of Christmas 0 Mattias Skarin client based in Paris in 2009/2010, plotted weekly Mean 42, +1 sigma = 55, -1 sigma = 29 (+/- 1.4x)
  • 67. Investment Bank, London, Extreme Programming Weekly Mean 10, Max = 16, Min = 6 Spread (+/- 1.6x)
  • 68. Velocity Control Charts Completion Velocity Chart 40 30 UCL 29.2 20 Completion Completion Velocity Velocity UCL 10 CL 7.206896552 Sigma +2 +1 Sigma 0 -10 LCL -14.8 1 2 3 4 5 6 7 8 9 10 11 12 13 14 15 16 17 18 19 20 21 22 23 24 25 26 27 28 29 30 -20 Date Motorola PCS 2003, FDD project plotted Daily Mean 7.2, +1 sigma = 15, -1 sigma = 0 (+/- 2x) Weekly Mean 36, +1 sigma = 63, -1 sigma = 11 (+ 1.7x, -3.3x)
  • 69. Variability in scope/requirements It is also important to realize how much variability there is in the scope/scale or requirements and how this must be accommodated in our plans
  • 70. Unplanned Work Report Scope Creep Dark Matter (emergent features) Original Scope Dark matter planned as a 19% expansion over original scope Actual Dark Matter over final original scope is 26% Total scope compared to original commitment is 13% greater
  • 71. Typical Agile teams using User Stories analysis produce 40-60% dark matter Stories are recognized as Epics and broken into more stories. The customer does not consider the scope to have changed
  • 72. TV/Movie Company in USA 2008 Initial Scope is 125 story points Within days this total scope reaches 190 due to dark matter expansion Management intervened on 4/21 to stop dark matter (deferring future scope to product backlog) Observed dark matter expansion is 52% but real number was much greater
  • 73. Original CFD shows same top line Dark matter quotient is 19% Device Management Ike II Cumulative Flow 240 220 200 180 160 Features 140 120 100 80 Track delta between 60 40 planned and actual 20 each day 0 ar ar eb eb eb ar ar ar M M -M -M -M -F -F -F 2- 9- 10 17 24 16 23 30 Time Inventory Started Designed Coded Complete
  • 74. Make a long term plan to build platform replacement Device Management Ike II Cumulative Flow Required throughput (velocity) 240 220 200 180 160 Features 140 Slope in middle 120 3.5x - 5x slope 100 at ends 5x 80 60 40 20 0 2006 2008 ar ar eb eb eb ar ar ar M M -M -M -M -F -F -F 2- 9- 10 17 24 16 23 30 During the middle 60% of the project schedule Time we need Throughput (velocity) to average 13 Inventory Started Designed Coded Complete features per month
  • 75. Little‟s Law Determines staffing level Target to achieve plan WIP Throughput = Lead Time From observed capability Treat as Fixed variable
  • 76. Changing the WIP limit without maintaining the staffing level ratio represents a change to the way of working. It is a change to the system design. And will produce a change in the observed „common cause‟ capability of the system
  • 77. Plan based on currently observed capability and current working practices. Do not assume process improvements. If changing WIP to reduce undesirable effects (e.g. multitasking), get new sample data (perform a spike) to observe the new capability
  • 78. Little‟s Law Determines staffing level Target to achieve plan WIP 13 / month = 0.25 months WIP = 3.25, round up to 4. Might be safe to From observed capability round down to 3. If current working practice is 1 unit WIP per person then 3 people are needed to work this project exclusively
  • 80. Educate the workforce to recognize process problems that affect performance
  • 81. Manage bottlenecks to increase throughput Known max productivity Idea Analysis Design Code ~90 ~80 ~50 ~50 Error Error Error Working Acceptance System Unit Code Test Test How do I trim 25% Test ~80 ~30 ~40 ~50 off the schedule for Quality a project going Schedule 1. Identify - Current CCR is System Test – 30 through this system? per month 2. Exploit - Testers relieved of all non-essential tasks, extra PMs assigned to complete administrative tasks, analysts assigned to future test plans 3. Subordinate - Requirements release restricted to ~30 per month Quality 4. Elevate - Plan to recruit temporary testing staff immediately Schedule
  • 82. Non-instant Availability  Looks like a bottleneck  Same thinking process applies  Management approach is similar but policies will be different depending on type of bottleneck CCR vs NIA
  • 83. Wimbledon comes in on time every year How do event planners do it? Scheduling Wimbledon isn’t an exact science Except 2004 when it rained on Sunday and the final was on Monday ;-) Games last different lengths of time and weather conditions can stop play altogether but the Men’s Final always happens on the 2nd Sunday If only we could project manage like this!
  • 84. Quantity of pink issue tickets on board directly indicates flow impacting problems that need attention from management Issues are the exception – attached to work items that are blocked for external reasons and call attention to problems preventing smooth flow
  • 85. Focusing on efficiency produces better cost accounting results for large batch sizes
  • 86. But there are also coordination costs in knowledge work problems Communication Queue Task W Queue Task Wait Setup Cleanup Queue Task Wait Q Task Wait Time
  • 87. And in knowledge work problems, coordination costs grow non-linearly with batch size Communication Queue Task W Queue Task Wait Setup Cleanup Queue Task Wait Q Task Wait Time
  • 88. Sources of Economic Costs  Transaction Costs  Coordination Costs  Failure Demand
  • 89. Transaction Coordination Costs Transaction cost Costs Costs Value-added Work Failure Demand time
  • 93. respect The team must the WIP limit and value the conversations it provokes about problems
  • 94. Leadership is the secret sauce! Encourage it from any team member regardless of position, experience or authority
  • 95. Enable the team with transparency of process (visualization of invisible work & process dynamics.) Use models for understanding problems and improvements will occur.
  • 96. These improvements will provide better economic and sociological outcomes
  • 97. Enabling our goal to… Economically balance capability against demand
  • 98.
  • 99. Thank you! dja@agilemanagement.net http://www.agilemanagement.net/
  • 100. About… David Anderson is a thought leader in managing effective software teams. He leads a consulting firm dedicated to improving economic performance of knowledge worker businesses – improving agility, reducing cycle times, improving productivity and efficiency in technology development. He has 25+ years experience in the software industry starting with computer games in the early 1980‟s. He has led software teams delivering superior productivity and quality using innovative agile methods. He developed MSF for CMMI Process Improvement for Microsoft. He is a co-author of the SEI Technical Note, CMMI and Agile: Why not embrace both! David‟s book, Agile Management for Software Engineering – Applying the Theory of Constraints for Business Results, introduced many ideas from Lean and Theory of Constraints into software engineering. David was a founder of the Lean Software & Systems Consortium, a not for profit dedicated to promoting better standards of professionalism and effectiveness in software engineering. Email… dja@agilemanagement.net

Editor's Notes

  1. Kanban board gives visibility into process issues – ragged flow, transaction costs of releases.Daily standup provides forum for spontaneous association to attack process issues affecting productivity and lead timeFor ex: 3 day freeze on test environment was a transaction cost on release that caused a bottleneck at “build” state. Reduced to 24 hrs. Result was improved smoother flow resulting in higher throughput and shorter lead time.