Las Vegas Sands Corp technical analysis charts
•
0 likes•98 views

http://www.chartician.com/ Las Vegas Sands Corp technical analysis charts

Recommended
More Related Content
More from Chartician
More from Chartician (9)
Recently uploaded
Recently uploaded (20)
Las Vegas Sands Corp technical analysis charts
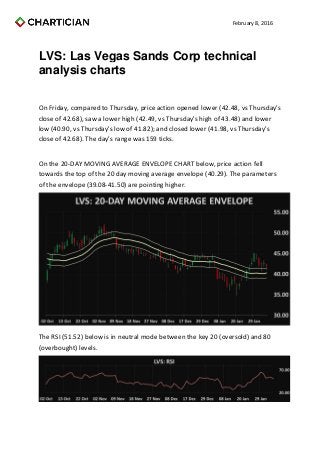
- 1. February 8, 2016 LVS: Las Vegas Sands Corp technical analysis charts On Friday, compared to Thursday, price action opened lower (42.48, vs Thursday's close of 42.68), saw a lower high (42.49, vs Thursday's high of 43.48) and lower low (40.90, vs Thursday's low of 41.82); and closed lower (41.98, vs Thursday's close of 42.68). The day's range was 159 ticks. On the 20-DAY MOVING AVERAGE ENVELOPE CHART below, price action fell towards the top of the 20 day moving average envelope (40.29). The parameters of the envelope (39.08-41.50) are pointing higher. The RSI (51.52) below is in neutral mode between the key 20 (oversold) and 80 (overbought) levels.
- 2. February 8, 2016 The MACD 12 day moving average is below the MACD 26 day moving average; both are above zero. The Slow Stochastics, below, is in neutral mode. The Commodity Channel Index (51.07), below, is in positive mode above the oversold -200 level. On the DAILY BOLLINGER BANDS CHART below, Friday represents the 8th consecutive entire day above the middle of the Bollinger Band envelope (40.29), in negative mode towards the middle of the envelope The Bollinger Bands (35.45- 45.14) are pointing higher; and widened from a width of 965 ticks on Thursday to a width of 969 ticks on Friday.
- 3. February 8, 2016 On the 5 AND 20 DAY MOVING AVERAGES CHART below, the 5 day moving average (42.81, moving down) is above the 20 day moving average (40.29, moving up), in positive mode. The 3-50 day strip of moving averages ranges from the 20 day moving average (40.29) at the bottom of the range to the 5 day moving average (42.81) at the top of the range.
- 4. February 8, 2016 The Parabolic Stop and Reverse (45.11) below is in the 1st day of buy mode. On the WEEKLY BOLLINGER BANDS CHART below, last week represents the 1st consecutive close below the middle of the Bollinger Bands envelope (44.07). The Bollinger Bands (37.02-51.11) are pointing lower; expanding from a width of 1,400 ticks on Thursday to a width of 1,409 ticks on Friday.