Stock Research Report for M as of 7/8/11 - Chaikin Power Tools
•
1 like•149 views

To order a free Chaikin Power Gauge stock research report for M go to http://www.chaikinpowertools.com/reports

Recommended
More Related Content
Viewers also liked
More from Dan Oconnor
More from Dan Oconnor (10)
Recently uploaded
Recently uploaded (20)
Stock Research Report for M as of 7/8/11 - Chaikin Power Tools
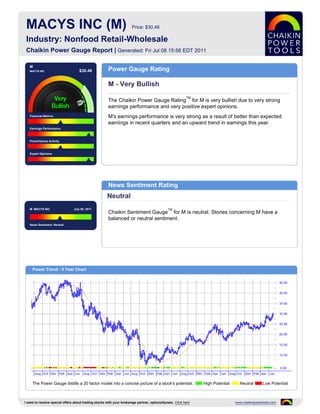
- 1. MACYS INC (M) Price: $30.46 Industry: Nonfood Retail-Wholesale Chaikin Power Gauge Report | Generated: Fri Jul 08 15:56 EDT 2011 M MACYS INC $30.46 Power Gauge Rating M - Very Bullish TM The Chaikin Power Gauge Rating for M is very bullish due to very strong earnings performance and very positive expert opinions. Financial Metrics M's earnings performance is very strong as a result of better than expected earnings in recent quarters and an upward trend in earnings this year. Earnings Performance Price/Volume Activity Expert Opinions News Sentiment Rating Neutral M MACYS INC July 08, 2011 TM Chaikin Sentiment Gauge for M is neutral. Stories concerning M have a balanced or neutral sentiment. News Sentiment :Neutral Power Trend - 5 Year Chart The Power Gauge distills a 20 factor model into a concise picture of a stock's potential. High Potential Neutral Low Potential I want to receive special offers about trading stocks with your brokerage partner, optionsXpress. Click here www.chaikinpowertools.com
- 2. Financials & Earnings Financial Metrics Financial Metrics Rating LT Debt/Equity Ratio Neutral Price to Book Value M's financial metrics are neutral. The company yields a high return on shareholder's equity and is carrying too much long term debt. Return on Equity The rank is based on a high long term debt to equity ratio, high return on equity, high price to sales ratio and relatively high cash flow. Price to Sales Ratio Business Value Assets and Liabilities Valuation Returns Ratio TTM Ratio TTM Ratio TTM Current Ratio 1.26 Price/Book 2.28 Return on Invest 8.2% LT Debt/Equity 1.26 Price/Sales 0.52 Return on Equity 19.0% Earnings Performance Earnings Performance Rating Earnings Growth Very Bullish Earnings Surprise M's earnings performance has been very strong. The company has outperformed analysts' earnings estimates and experienced superior earnings growth in the past 12 months. Earnings Trend The rank is based on poor EPS growth over the past 3-5 years, better than Projected P/E Ratio expected earnings in recent quarters, an upward trend in earnings this year, a relatively low projected P/E ratio and consistent earnings over the past 5 years. Earnings Consistency 5 Year Revenue and Earnings Growth EPS Estimates 01/07 01/08 01/09 01/10 01/11 Factor Actual EPS Prev EST EPS Current Change Revenue(M) 26,970.00 26,313.00 24,892.00 23,489.00 25,003.00 Quarterly EPS $0.35 $0.46 +0.11 Rev % Growth 20.46% -2.44% -5.40% -5.64% 6.45% Yearly EPS $2.00 $2.50 +0.50 EPS $1.84 $2.00 $0.67 $0.83 $2.00 Factor Actual EPS Growth Est EPS Growth Change EPS % Growth -44.24% 8.70% -66.50% 23.88% 140.96% 3-5 year EPS 2.69% 6.50% +3.81 EPS Surprise EPS Quarterly Results Estimate Actual Difference % Difference FY Qtr 1 Qtr 2 Qtr 3 Qtr 4 Total Latest Qtr $0.18 $0.30 $0.12 66.67 01/09 $-0.21 $0.02 $-0.08 $1.10 $0.83 1 Qtr Ago $1.51 $1.59 $0.08 5.30 01/10 $0.05 $0.35 $0.02 $1.57 $1.99 2 Qtr Ago $0.03 $0.08 $0.05 166.67 01/11 $0.31 - - - - 3 Qtr Ago $0.28 $0.35 $0.07 25.00 Fiscal Year End Month is January. I want to receive special offers about trading stocks with your brokerage partner, optionsXpress. Click here www.chaikinpowertools.com
- 3. Price Trend & Expert Opinions Price/Volume Activity Price/Volume Activity Rating Relative Strength vs Market Neutral Chaikin Money Flow Price and volume activity for M is neutral. M has outperformed the S&P 500 over 26 weeks and is in a decelerating price trend compared to 4 months ago. Price Trend The rank for M is based on its price strength versus the market, positive Chaikin Price Trend ROC money flow, a positive Chaikin price trend, a negative Chaikin price trend ROC and a decreasing volume trend. Volume Trend Relative Strength vs S&P500 Index Chaikin Money Flow Chart shows whether M is performing better or worse than the market. Chaikin Money Flow analyzes supply and demand for a company's stock. Price Activity Price Activity Volume Activity Factor Value Factor Value Factor Value 52 Week High 30.46 % Change Price - 4 Weeks 8.28% Average Volume 20 Days 7,395,910 52 Week Low 17.16 % Change Price - 24 Weeks 30.17% Average Volume 90 Days 9,022,399 % Change YTD Rel S&P 500 10.87% % Change Price - 4 Wks Rel to S&P 3.14% Chaikin Money Flow Persistency 61% % Change Price - 24 Wks Rel to S&P 23.15% Expert Opinions Expert Opinions Earnings Estimate Revisions Very Bullish Short Interest Expert opinions about M are very positive. Analysts are raising their EPS estimates for M and analysts's opinions on M have been more positive recently. Insider Activity The rank for M is based on analysts revising earnings estimates upward, a low short interest ratio, insiders not purchasing significant amounts of stock, optimistic Analyst Opinions analyst opinions and price strength of the stock versus the Nonfood Retail- Wholesale industry group. Relative Strength vs Industry Earnings Estimate Revisions Analyst Recommendations EPS Estimates Revision Summary Current 7 Days Ago % Change Factor Value Last Week Last 4 Weeks Current Qtr 0.46 0.44 +4.55% Mean this Week Buy Up Down Up Down Next Qtr 0.13 0.13 0.00% Mean Last Week Buy Curr Qtr 2 0 2 0 Curr Yr 0 0 2 0 Current 30 Days Ago % Change Change 0.00 Next Qtr 1 0 2 0 Current FY 2.50 2.49 0.01 Mean 5 Weeks Ago Buy Next Yr 2 0 3 0 I want to receive special offers about trading stocks with your brokerage partner, optionsXpress. Click here www.chaikinpowertools.com
- 4. The Company & Its Competitors M's Competitors in Nonfood Retail-Wholesale News Headlines for M Company Power Historic EPS Projected EPS Profit Margin PEG PE Revenue(M) Compuware buys dynaTrace for $256 million - Gauge growth growth Jul 6, 2011 M 2.69% 6.50% 3.77% 1.88 13.13 25,003 Owner of parking garage across from Macy's DDS -4.00% - 3.35% - 19.41 6,121 downtown files for Chapter 11 bankruptcy - Jun 27, 2011 BONT 29.55% - 0.30% - 15.71 3,046 Knife sets recall 06 14 - Jun 14, 2011 KSS 6.66% 12.00% 6.25% 1.06 14.45 18,391 Kohl's Raises Profit Forecast, Citing a Stronger Consumer - May 13, 2011 SKS -10.79% 18.75% 2.02% 1.88 50.87 2,786 Matthew Williamson Capsule Collection JCP -1.01% 12.00% 2.21% 1.29 20.82 17,759 Launches Tomorrow Only at Macy’s - Apr 12, 2011 Company Details Company Profile MACYS INC Federated Department Stores, through its subsidiaries, is one of the leading operators of 7 WEST SEVENTH STREET full-line department stores in the United States. The Company's subsidiaries operate CINCINNATI, OH 45202 department stores under the names Bloomingdale's, The Bon Marche, Burdines, USA Goldsmith's, Lazarus, Macy's, Rich's and Stern's. These department stores sell a wide Phone: 5135797000 range of merchandise, including men's, women's and children's apparel and accessories, Fax: 513-579-7555 cosmetics, home furnishings and other consumer goods. Website: http://http://www.macysinc.com Full Time Employees: 166,000 Sector: Retail/Wholesale Power Gauge Ratings are created using a relative ranking system that assigns a rank of 0 to 100 (100 being the highest) to each stock in the universe. Rank is calculated by evaluating each of the stocks factors and combining them into a single number using a weighting formula. A stock's rank ranges from 100-0, where 100 is the strongest, and a rank of 95 indicates the stock is better than 95% of the stocks in the universe. Chaikin Stock Research(CSR) is not registered as a securities broker dealer or investment advisor with either the U.S. Securities and Exchange Commission or with any state securities regulatory authority. CSR is not responsible for trades executed by users of this research report, our web site or mobile app based on the information included herein. The information presented in this report does not represent a recommendation to buy or sell stocks or any financial instrument nor is it intended as an endorsement of any security or investment. The information in this report is generic by nature and is not personalized to the specific financial situation of any individual. The user bears complete responsibility for their own investment research and should seek the advice of a qualified investment professional before making any investment decisions. Copyright (c) 1978-(Present) by ZACKS Investment Research, Inc ("ZACKS"). The information, data, analyses and opinions contained herein (1) includes the confidential and proprietary information of ZACKS, (2) may not be copied or redistributed, for any purpose, (3) does not constitute investment advice offered by ZACKS, (4) are provided solely for informational purposes, and (5) are not warranted or represented to be correct, complete, accurate or timely. ZACKS shall not be responsible for investment decisions, damages or other losses resulting from, or related to, use of this information, data, analyses or opinions. Past performance is no guarantee of future performance. ZACKS is not affiliated with Chaikin Power Tools. This report from Chaikin Power Tools is for informational purposes only and is not a recommendation to buy or sell securities. LM 2.3 DS 3.0 LS 2.1 Data Provided by ZACKS Investment Research, Inc., www.zacks.com Special offers to trade stocks from optionsXpress: www.chaikinpowertools.com