Market Watch TORONTO 2014 SEPTEMBER
•
0 likes•316 views

Toronto real estate by the numbers. September was another busy month in Toronto. The market is well on its way to be a record yet again. Also check out my site, iLOFTU.ca for the latest numbers presented in interactive charts. For more information get in touch: chaba@iLOFTU.ca

Recommended
More Related Content
More from Chaba Tamasi
More from Chaba Tamasi (15)
Recently uploaded
Recently uploaded (20)
Market Watch TORONTO 2014 SEPTEMBER
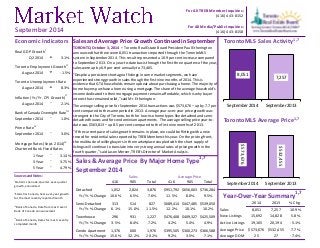
- 1. Sales and Average Price Growth Continued in September TORONTO, October 3, 2014 – Toronto Real Estate Board President Paul Etherington announced that there were 8,051 transactions reported through the TorontoMLS system in September 2014. This result represented a 10.9 per cent increase compared to September 2013. On a year-to-date basis through the first three quarters of the year, sales were up by 6.9 per cent annually to 73,465. "Despite a persistent shortage of listings in some market segments, we have experienced strong growth in sales though the first nine months of 2014. This is evidence that GTA households remain upbeat about purchasing a home. The majority of home buyers purchase a home using a mortgage. The share of the average household's income dedicated to their mortgage payment remains affordable, which is why buyer interest has remained solid," said Mr. Etherington. The average selling price for September 2014 transactions was $573,676 – up by 7.7 per cent compared to the same period in 2013. Average year-over-year price growth was strongest in the City of Toronto, both for low-rise home types like detached and semi-detached houses and for condominium apartments. The average selling price year-to-date was $563,813 – up 8.5 per cent compared to the first nine months of 2013. "If the current pace of sales growth remains in place, we could be flirting with a new record for residential sales reported by TREB Members this year. On the pricing front, the multitude of willing buyers in the marketplace coupled with the short supply of listings will continue to translate into very strong annual rates of price growth in the fourth quarter," said Jason Mercer, TREB's Director of Market Analysis. 8,051 7,257 September 2014 September 2013 $573,676 $532,455 September 2014 September 2013 For All TREB Member Inquiries: (416) 443-8152 For All Media/Public Inquiries: September 2014 (416) 443-8158 Real GDP Growthi Q2 2014 t 3.1% Toronto Employment Growthi i August 2014 u -1.5% Toronto Unemployment Rate August 2014 t 8.3% Inflation (Yr./Yr. CPI Growth)i i August 2014 q 2.1% Bank of Canada Overnight Rateiii September 2014 q 1.0% Prime Rateiv September 2014 q 3.0% Mortgage Rates (Sept. 2014)iv Chartered Bank Fixed Rates 1 Year q 3.14% 3 Year q 3.75% 5 Year q 4.79% Sources and Notes: Economic Indicators iStatistics Canada, Quarter-over-quarter growth, annualized iiStatistics Canada, Year-over-year growth for the most recently reported month iiiBank of Canada, Rate from most recent Bank of Canada announcement ivBank of Canada, Rates for most recently completed month Sales & Average Price By Major Home Type1,7 416 905 Total 416 905 Total Detached 1,052 2,824 3,876 $951,792 $656,003 $736,284 Yr./Yr. % Change 10.6% 6.5% 7.6% 11.5% 8.0% 9.5% Semi-Detached 313 514 827 $689,414 $447,485 $539,050 Yr./Yr. % Change 6.1% 15.0% 11.5% 12.2% 10.1% 10.2% Townhouse 296 931 1,227 $476,408 $409,327 $425,509 Yr./Yr. % Change 3.5% 8.4% 7.2% 4.2% 5.4% 4.9% Condo Apartment 1,376 600 1,976 $395,505 $300,273 $366,588 Yr./Yr. % Change 15.6% 32.2% 20.2% 9.2% 3.5% 7.1% September 2014 Sales Average Price 2014 2013 % Chg. Sales 8,051 7,257 10.9% New Listings 15,692 14,828 5.8% Active Listings 19,165 20,194 -5.1% Average Price $573,676 $532,455 7.7% Average DOM 25 27 -7.4% Year-Over-Year Summary1,7 TorontoMLS Sales Activity1,7 TorontoMLS Average Price1,7
- 2. Price Range Detached Semi-Detached Att/Row/Twnhouse Condo Townhouse Condo Apt Link Co-op Apt Det Condo Co-ownership Apt Total $0 to $99,999 2 0 0 2 9 0 1 0 0 14 $100,000 to $199,999 32 7 0 35 166 0 3 1 0 244 $200,000 to $299,999 140 41 36 141 629 11 1 0 2 1,001 $300,000 to $399,999 385 127 180 213 655 27 3 2 0 1,592 $400,000 to $499,999 656 246 190 136 254 18 0 1 0 1,501 $500,000 to $599,999 647 187 113 38 112 29 0 5 1 1,132 $600,000 to $699,999 519 95 66 17 64 24 0 0 0 785 $700,000 to $799,999 405 53 21 14 35 11 0 0 0 539 $800,000 to $899,999 290 30 7 5 7 2 0 0 0 341 $900,000 to $999,999 198 14 4 1 14 1 0 1 0 233 $1,000,000 to $1,249,999 238 14 3 2 10 0 0 0 0 267 $1,250,000 to $1,499,999 139 5 2 1 8 0 0 0 0 155 $1,500,000 to $1,749,999 72 6 0 0 3 0 0 0 0 81 $1,750,000 to $1,999,999 42 1 0 0 3 0 0 0 0 46 $2,000,000 + 111 1 0 0 7 0 0 1 0 120 Total Sales 3,876 827 622 605 1,976 123 8 11 3 8,051 Share of Total Sales 48.1% 10.3% 7.7% 7.5% 24.5% 1.5% 0.1% 0.1% 0.0% - Average Price $736,284 $539,050 $474,552 $375,088 $366,588 $508,292 $209,874 $668,773 $333,133 $573,676 Price Range Detached Semi-Detached Att/Row/Twnhouse Condo Townhouse Condo Apt Link Co-op Apt Det Condo Co-ownership Apt Total $0 to $99,999 14 0 1 18 86 0 4 0 3 126 $100,000 to $199,999 273 29 6 306 1,611 1 25 1 9 2,261 $200,000 to $299,999 1,397 379 399 1,384 5,450 148 21 7 22 9,207 $300,000 to $399,999 3,715 1,400 1,672 2,038 5,271 244 12 25 11 14,388 $400,000 to $499,999 5,868 2,450 1,808 1,200 2,338 196 14 15 1 13,890 $500,000 to $599,999 6,213 1,714 1,057 321 1,017 239 4 12 2 10,579 $600,000 to $699,999 5,180 800 517 145 530 241 7 8 0 7,428 $700,000 to $799,999 3,674 369 239 103 235 79 1 2 0 4,702 $800,000 to $899,999 2,710 253 85 40 93 13 2 1 0 3,197 $900,000 to $999,999 1,728 157 46 22 84 1 2 2 0 2,042 $1,000,000 to $1,249,999 2,127 96 48 23 95 1 1 1 0 2,392 $1,250,000 to $1,499,999 1,147 42 19 5 57 0 0 0 0 1,270 $1,500,000 to $1,749,999 627 29 4 5 27 0 0 0 0 692 $1,750,000 to $1,999,999 371 10 2 2 17 0 0 0 0 402 $2,000,000 + 822 19 2 3 42 0 0 1 0 889 Total Sales 35,866 7,747 5,905 5,615 16,953 1,163 93 75 48 73,465 Share of Total Sales 48.8% 10.5% 8.0% 7.6% 23.1% 1.6% 0.1% 0.1% 0.1% - Average Price $716,345 $524,178 $474,916 $374,634 $360,144 $492,555 $339,703 $493,765 $258,002 $563,813 SALES BY PRICE RANGE AND HOUSE TYPE1,7 SEPTEMBER 2014 SALES BY PRICE RANGE AND HOUSE TYPE1,7 YEAR-TO-DATE, 2014 Market Watch, September 2014 2 Toronto Real Estate Board
- 3. ALL HOME TYPES, SEPTEMBER 2014 ALL TREB AREAS Number of Sales Dollar Volume1 Average Price1 Median Price1 New Listings2 SNLR (Trend)8 Active Listings3 Mos. Inv. (Trend)9 Avg. SP/LP4 Avg. DOM5 TREB Total 8,051 $4,618,663,338 $573,676 $475,000 15,692 58.9% 19,165 2.2 99% 25 Halton Region 648 $408,574,328 $630,516 $525,000 1,230 64.4% 1,559 2.1 98% 25 Burlington 152 $84,502,343 $555,936 $498,000 243 67.8% 348 2.3 98% 26 Halton Hills 88 $45,327,200 $515,082 $466,250 149 65.5% 198 2.3 98% 26 Milton 172 $83,473,943 $485,314 $447,500 300 66.8% 315 1.6 98% 22 Oakville 236 $195,270,842 $827,419 $677,500 538 60.8% 698 2.4 98% 27 Peel Region 1,612 $785,622,638 $487,359 $440,000 3,110 57.4% 3,812 2.2 98% 26 Brampton 665 $299,915,859 $451,001 $428,000 1,244 58.8% 1,405 2.0 98% 24 Caledon 70 $42,630,900 $609,013 $549,500 156 55.6% 292 3.6 97% 33 Mississauga 877 $443,075,879 $505,218 $449,000 1,710 56.5% 2,115 2.3 98% 26 City of Toronto 3,063 $1,913,918,373 $624,851 $488,900 6,609 55.9% 7,804 2.4 100% 25 York Region 1,477 $1,008,043,512 $682,494 $622,000 2,835 59.0% 3,583 2.2 98% 26 Aurora 89 $57,465,594 $645,681 $524,000 172 63.7% 212 2.2 97% 27 E. Gwillimbury 29 $16,751,500 $577,638 $451,000 55 64.6% 90 2.7 98% 36 Georgina 78 $27,995,050 $358,911 $342,450 124 66.4% 190 2.4 98% 35 King 25 $24,429,000 $977,160 $875,000 71 39.5% 201 6.4 95% 53 Markham 416 $287,376,977 $690,810 $650,000 737 61.8% 793 1.8 100% 23 Newmarket 103 $53,874,838 $523,057 $507,500 192 70.6% 189 1.4 98% 28 Richmond Hill 309 $234,892,690 $760,171 $665,000 632 55.3% 799 2.3 99% 25 Vaughan 350 $253,281,619 $723,662 $670,500 738 55.0% 923 2.4 98% 24 Whitchurch-Stouffville 78 $51,976,244 $666,362 $603,500 114 60.9% 186 2.8 98% 26 Durham Region 970 $389,661,615 $401,713 $380,000 1,471 69.3% 1,523 1.6 99% 21 Ajax 165 $72,061,250 $436,735 $418,000 213 75.0% 157 1.0 100% 14 Brock 12 $3,176,300 $264,692 $239,000 33 53.5% 105 5.4 96% 83 Clarington 154 $53,826,362 $349,522 $335,000 259 67.3% 287 1.6 99% 22 Oshawa 274 $89,359,698 $326,130 $312,500 375 70.0% 312 1.3 99% 19 Pickering 136 $64,814,800 $476,579 $424,125 205 69.6% 182 1.4 99% 16 Scugog 30 $12,422,300 $414,077 $402,750 63 56.0% 137 3.8 98% 41 Uxbridge 28 $16,553,700 $591,204 $468,000 56 61.1% 130 4.1 98% 52 Whitby 171 $77,447,205 $452,908 $413,500 267 71.4% 213 1.2 99% 20 Dufferin County 49 $17,690,400 $361,029 $320,000 97 63.0% 185 3.0 98% 39 Orangeville 49 $17,690,400 $361,029 $320,000 97 63.0% 185 3.0 98% 39 Simcoe County 232 $95,152,472 $410,140 $392,350 340 59.3% 699 3.4 97% 40 Adjala-Tosorontio 16 $8,511,499 $531,969 $488,750 33 49.3% 84 5.8 97% 59 Bradford West Gwillimbury 67 $31,409,490 $468,798 $430,000 106 56.9% 159 2.8 97% 30 Essa 23 $7,582,599 $329,678 $300,000 25 67.0% 66 3.1 98% 41 Innisfil 55 $21,837,500 $397,045 $360,000 103 54.7% 222 3.9 98% 43 New Tecumseth 71 $25,811,384 $363,541 $354,000 73 67.0% 168 3.2 98% 42 SUMMARY OF EXISTING HOME TRANSACTIONS ! TURN PAGE FOR CITY OF TORONTO TABLES OR CLICK HERE: Market Watch, September 2014 3 Toronto Real Estate Board
- 4. Market Watch, September 2014 Page 3 July 2010 4 Toronto Real Estate Board ALL HOME TYPES, SEPTEMBER 2014 CITY OF TORONTO MUNICIPAL BREAKDOWN Number of Sales Dollar Volume1 Average Price1 Median Price1 New Listings2 SNLR (Trend)8 Active Listings3 Mos. Inv. (Trend)9 Avg. SP/LP4 Avg. DOM5 TREB Total 8,051 $4,618,663,338 $573,676 $475,000 15,692 58.9% 19,165 2.2 99% 25 City of Toronto Total 3,063 $1,913,918,373 $624,851 $488,900 6,609 55.9% 7,804 2.4 100% 25 Toronto West 784 $423,479,296 $540,152 $466,750 1,677 56.8% 2,055 2.4 100% 26 Toronto W01 46 $34,567,718 $751,472 $627,000 110 52.1% 143 2.8 106% 22 Toronto W02 82 $56,691,538 $691,360 $660,500 174 67.0% 136 1.3 104% 16 Toronto W03 56 $26,602,024 $475,036 $465,000 141 58.2% 140 1.7 102% 18 Toronto W04 68 $29,355,650 $431,701 $423,000 134 62.1% 175 2.1 99% 26 Toronto W05 91 $36,234,188 $398,178 $408,000 192 59.0% 289 2.6 98% 25 Toronto W06 111 $57,382,476 $516,959 $509,000 271 46.4% 379 3.6 100% 31 Toronto W07 32 $25,933,427 $810,420 $730,000 52 76.2% 39 1.1 102% 15 Toronto W08 166 $102,606,123 $618,109 $384,000 363 53.9% 455 2.7 98% 33 Toronto W09 42 $20,834,200 $496,052 $544,000 99 59.7% 113 2.3 99% 26 Toronto W10 90 $33,271,952 $369,688 $425,000 141 59.9% 186 2.4 97% 33 Toronto Central 1,409 $1,042,176,110 $739,657 $489,000 3,332 50.4% 4,354 3.0 99% 28 Toronto C01 431 $209,766,879 $486,698 $399,900 919 44.0% 1,385 3.7 99% 33 Toronto C02 61 $76,967,278 $1,261,759 $915,000 177 48.4% 246 3.7 98% 31 Toronto C03 47 $60,897,960 $1,295,701 $820,500 131 57.9% 137 2.3 100% 19 Toronto C04 85 $111,340,318 $1,309,886 $1,225,000 214 56.7% 209 2.3 100% 20 Toronto C06 30 $18,768,950 $625,632 $617,500 86 48.6% 119 3.2 97% 36 Toronto C07 109 $70,336,150 $645,286 $468,500 234 51.3% 321 2.9 98% 33 Toronto C08 142 $69,353,705 $488,406 $408,000 317 53.9% 369 2.6 99% 27 Toronto C09 25 $37,549,000 $1,501,960 $1,310,000 85 56.1% 97 2.7 100% 16 Toronto C10 39 $26,950,508 $691,039 $651,000 112 60.4% 123 1.9 103% 26 Toronto C11 48 $35,906,960 $748,062 $517,500 89 68.9% 72 1.4 103% 19 Toronto C12 37 $76,179,578 $2,058,908 $1,460,000 110 47.2% 169 4.0 96% 24 Toronto C13 81 $62,141,711 $767,182 $530,000 152 65.2% 125 1.6 102% 15 Toronto C14 146 $107,653,849 $737,355 $436,000 400 45.4% 593 3.4 98% 34 Toronto C15 128 $78,363,264 $612,213 $449,000 306 55.1% 389 2.4 100% 26 Toronto East 870 $448,262,967 $515,245 $502,500 1,600 66.5% 1,395 1.5 102% 20 Toronto E01 80 $56,146,445 $701,831 $684,650 173 68.1% 115 1.2 107% 14 Toronto E02 64 $46,210,358 $722,037 $673,750 143 64.8% 104 1.2 103% 11 Toronto E03 90 $57,255,729 $636,175 $637,500 168 67.8% 102 1.1 105% 16 Toronto E04 106 $46,175,597 $435,619 $484,500 181 68.3% 154 1.4 101% 20 Toronto E05 94 $45,484,396 $483,877 $402,000 160 71.1% 127 1.2 101% 20 Toronto E06 32 $19,066,440 $595,826 $486,200 104 56.9% 78 1.5 101% 11 Toronto E07 97 $44,797,475 $461,830 $488,000 138 63.9% 172 1.8 101% 22 Toronto E08 57 $27,630,000 $484,737 $479,000 119 65.4% 124 1.8 99% 28 Toronto E09 115 $41,591,151 $361,662 $338,400 197 64.9% 211 1.8 100% 28 Toronto E10 73 $39,774,626 $544,858 $546,000 109 65.3% 97 1.7 100% 21 Toronto E11 62 $24,130,750 $389,206 $376,000 108 70.2% 111 1.5 99% 21 SUMMARY OF EXISTING HOME TRANSACTIONS
- 5. ALL HOME TYPES, YEAR-TO-DATE 2014 ALL TREB AREAS Number of Sales Dollar Volume1 Average Price1 Median Price1 New Listings2 Avg. SP/LP4 Avg. DOM5 TREB Total 73,465 $41,420,553,752 $563,813 $475,000 129,478 99% 24 Halton Region 6,295 $3,918,330,731 $622,451 $530,000 10,193 98% 24 Burlington 1,253 $694,958,171 $554,635 $492,500 1,921 98% 29 Halton Hills 808 $406,817,537 $503,487 $469,700 1,283 98% 24 Milton 1,804 $883,922,304 $489,979 $458,000 2,831 99% 20 Oakville 2,430 $1,932,632,720 $795,322 $681,500 4,158 98% 25 Peel Region 15,558 $7,524,438,188 $483,638 $440,000 27,776 98% 23 Brampton 6,708 $2,978,377,923 $444,004 $420,500 11,576 98% 23 Caledon 751 $457,097,984 $608,652 $557,000 1,388 97% 35 Mississauga 8,099 $4,088,962,281 $504,872 $456,100 14,812 98% 23 City of Toronto 27,116 $16,520,796,141 $609,264 $481,000 50,635 100% 24 York Region 13,560 $9,186,163,570 $677,446 $618,000 24,019 99% 23 Aurora 733 $474,554,262 $647,414 $576,000 1,211 98% 21 E. Gwillimbury 284 $168,292,902 $592,581 $496,500 448 97% 37 Georgina 710 $261,618,313 $368,476 $350,000 1,111 98% 29 King 249 $231,787,691 $930,874 $835,000 652 96% 46 Markham 3,783 $2,649,354,994 $700,332 $648,000 6,363 100% 20 Newmarket 1,186 $626,668,822 $528,389 $506,250 1,746 99% 21 Richmond Hill 2,804 $2,123,252,329 $757,223 $699,000 5,350 99% 21 Vaughan 3,129 $2,207,446,902 $705,480 $649,000 6,009 98% 23 Whitchurch-Stouffville 682 $443,187,357 $649,835 $586,300 1,129 98% 27 Durham Region 8,666 $3,387,440,992 $390,889 $365,000 12,928 99% 20 Ajax 1,617 $689,403,846 $426,347 $400,000 2,193 99% 16 Brock 159 $46,438,963 $292,069 $254,000 303 96% 57 Clarington 1,394 $472,537,474 $338,980 $320,000 2,146 99% 21 Oshawa 2,151 $669,323,829 $311,169 $294,800 3,225 99% 18 Pickering 1,119 $521,658,687 $466,183 $432,000 1,669 99% 18 Scugog 274 $116,234,212 $424,212 $392,000 513 98% 40 Uxbridge 268 $146,554,650 $546,846 $484,500 466 97% 42 Whitby 1,684 $725,289,332 $430,694 $400,000 2,413 99% 17 Dufferin County 466 $169,636,083 $364,026 $340,000 770 98% 36 Orangeville 466 $169,636,083 $364,026 $340,000 770 98% 36 Simcoe County 1,804 $713,748,047 $395,647 $365,000 3,157 98% 39 Adjala-Tosorontio 122 $55,563,143 $455,436 $417,500 250 97% 59 Bradford West Gwillimbury 489 $226,661,014 $463,519 $443,000 892 98% 29 Essa 234 $76,393,606 $326,468 $297,000 356 98% 39 Innisfil 457 $176,052,116 $385,234 $345,000 881 97% 41 New Tecumseth 502 $179,078,168 $356,729 $337,500 778 97% 44 ! TURN PAGE FOR CITY OF TORONTO TABLES OR CLICK HERE: SUMMARY OF EXISTING HOME TRANSACTIONS Market Watch, September 2014 Page 3 July 2010 5 Toronto Real Estate Board
- 6. Market Watch, September 2014 Page 3 July 2010 6 Toronto Real Estate Board ALL HOME TYPES, YEAR-TO-DATE 2014 CITY OF TORONTO MUNICIPAL BREAKDOWN Number of Sales Dollar Volume1 Average Price1 Median Price1 New Listings2 Avg. SP/LP4 Avg. DOM5 TREB Total 73,465 $41,420,553,752 $563,813 $475,000 129,478 99% 24 City of Toronto Total 27,116 $16,520,796,141 $609,264 $481,000 50,635 100% 24 Toronto West 6,729 $3,564,032,823 $529,653 $469,900 12,526 100% 25 Toronto W01 411 $271,277,856 $660,043 $575,000 821 103% 24 Toronto W02 671 $454,232,429 $676,948 $650,000 1,031 105% 16 Toronto W03 525 $250,411,837 $476,975 $475,000 955 102% 18 Toronto W04 586 $252,867,072 $431,514 $432,500 1,020 100% 24 Toronto W05 892 $355,988,917 $399,091 $425,250 1,571 98% 30 Toronto W06 916 $447,479,403 $488,515 $462,012 2,137 100% 31 Toronto W07 235 $194,787,151 $828,881 $775,000 330 102% 15 Toronto W08 1,395 $895,071,566 $641,628 $515,000 2,730 99% 28 Toronto W09 386 $191,486,862 $496,080 $536,000 691 99% 24 Toronto W10 712 $250,429,731 $351,727 $399,400 1,240 98% 29 Toronto Central 12,477 $9,001,910,980 $721,480 $485,000 25,792 99% 26 Toronto C01 3,373 $1,645,960,549 $487,981 $408,000 7,952 99% 30 Toronto C02 554 $613,735,184 $1,107,825 $850,000 1,213 100% 25 Toronto C03 439 $496,778,941 $1,131,615 $769,000 807 100% 22 Toronto C04 805 $1,030,628,727 $1,280,284 $1,200,000 1,476 100% 21 Toronto C06 269 $163,182,890 $606,628 $635,000 570 99% 26 Toronto C07 934 $602,552,230 $645,131 $459,000 1,921 98% 28 Toronto C08 1,238 $588,007,728 $474,966 $415,000 2,405 99% 27 Toronto C09 268 $435,402,462 $1,624,636 $1,387,500 513 98% 23 Toronto C10 474 $355,518,651 $750,039 $666,250 809 102% 19 Toronto C11 435 $322,494,089 $741,366 $426,500 625 102% 20 Toronto C12 346 $641,401,664 $1,853,762 $1,485,000 746 97% 30 Toronto C13 644 $450,292,720 $699,212 $525,000 1,013 102% 19 Toronto C14 1,448 $941,582,743 $650,264 $435,000 3,363 98% 29 Toronto C15 1,250 $714,372,402 $571,498 $443,500 2,379 100% 24 Toronto East 7,910 $3,954,852,338 $499,981 $489,900 12,317 102% 18 Toronto E01 705 $464,242,294 $658,500 $648,888 1,095 107% 13 Toronto E02 622 $465,665,727 $748,659 $668,950 980 103% 13 Toronto E03 812 $504,689,548 $621,539 $600,000 1,234 105% 14 Toronto E04 957 $407,193,305 $425,489 $463,400 1,449 102% 19 Toronto E05 848 $400,272,442 $472,019 $395,500 1,237 102% 17 Toronto E06 351 $195,044,630 $555,683 $505,000 643 101% 14 Toronto E07 794 $355,178,657 $447,328 $435,000 1,321 102% 21 Toronto E08 509 $233,565,644 $458,872 $460,000 817 99% 22 Toronto E09 1,026 $382,123,147 $372,440 $345,000 1,613 100% 23 Toronto E10 555 $277,405,669 $499,830 $487,000 868 101% 20 Toronto E11 731 $269,471,276 $368,634 $367,500 1,060 100% 20 SUMMARY OF EXISTING HOME TRANSACTIONS
- 7. Market Watch, September 2014 Industrial Leasing Page 3 July 2010 7 Toronto Real Estate Board ALL TREB AREAS Sales1 Dollar Volume1 Average Price1 Median Price1 New Listings2 Active Listings3 Avg. SP/LP4 Avg. DOM5 TREB Total 3,8-76 $2,853,-836,116 $736-,284 $615-,000 7,7-58 9,3-09 99-% 2-4 Halton Region 375 $298,947,006 $797,192 $665,000 771 1,066 98% 27 Burlington 83 $59,609,518 $718,187 $620,750 152 238 98% 27 Halton Hills 62 $35,956,750 $579,948 $537,500 123 178 97% 28 Milton 75 $44,602,986 $594,706 $559,900 144 190 98% 26 Oakville 15- 5 $158,7-77,752 $1,02-4,373 $816-,000 35- 2 46- 0 97-% 2-7 Peel Region 708 $456,077,562 $644,177 $585,000 1,530 1,906 98% 25 Brampton 361 $191,695,252 $531,012 $510,000 714 860 98% 25 Caledon 55 $36,115,000 $656,636 $600,000 131 273 97% 38 Mississauga 29- 2 $228,2-67,310 $781-,737 $666-,363 68- 5 77- 3 98-% 2-2 City of Toronto 1,052 $1,001,284,855 $951,792 $730,000 2,291 2,091 100% 20 - - - - - - - - York Region 833 $698,712,996 $838,791 $779,000 1,697 2,206 98% 25 Aurora 46 $38,091,594 $828,078 $710,000 120 153 96% 28 E. Gwillimbury 23 $14,449,100 $628,222 $493,500 49 85 98% 40 Georgina 72 $26,240,550 $364,452 $345,000 109 170 98% 36 King 21 $22,441,500 $1,068,643 $915,000 63 169 95% 56 Markham 186 $173,354,845 $932,015 $849,500 326 346 99% 20 Newmarket 65 $38,210,100 $587,848 $564,000 124 133 98% 31 Richmond Hill 168 $167,926,362 $999,562 $861,500 363 443 99% 21 Vaughan 193 $174,591,701 $904,620 $805,000 449 532 98% 21 Whitchurch-Stouffville 5-9 $43,40- 7,244 $735-,716 $630-,000 9-4 17- 5 98-% 3-0 Durham Region 685 $304,160,415 $444,030 $415,000 1,094 1,240 99% 23 Ajax 102 $50,466,200 $494,767 $471,500 135 106 99% 15 Brock 11 $2,968,300 $269,845 $249,000 30 101 96% 78 Clarington 117 $44,000,662 $376,074 $362,000 199 236 99% 25 Oshawa 203 $73,003,198 $359,622 $343,000 283 230 99% 19 Pickering 83 $46,988,450 $566,126 $492,000 133 131 98% 18 Scugog 29 $12,107,300 $417,493 $417,500 63 137 98% 41 Uxbridge 25 $15,643,700 $625,748 $500,000 51 122 98% 53 Whitby 11- 5 $58,98- 2,605 $512-,892 $450-,000 20- 0 17- 7 99-% 2-3 Dufferin County 34 $13,728,400 $403,776 $359,500 77 156 98% 35 Orangeville 3-4 $13,72- 8,400 $403-,776 $359-,500 7-7 15- 6 98-% 3-5 Simcoe County 189 $80,924,882 $428,174 $407,000 298 644 97% 43 Adjala-Tosorontio 16 $8,511,499 $531,969 $488,750 33 84 97% 59 Bradford West Gwillimbury 49 $24,721,400 $504,518 $460,000 87 142 96% 33 Essa 17 $5,977,099 $351,594 $347,000 20 64 97% 49 Innisfil 53 $21,317,500 $402,217 $372,000 99 215 98% 44 New Tecumseth 54 $20,397,384 $377,729 $377,088 59 139 97% 43 SUMMARY OF EXISTING HOME TRANSACTIONS DETACHED HOUSES, SEPTEMBER 2014 ! TURN PAGE FOR CITY OF TORONTO TABLES OR CLICK HERE:
- 8. Market Watch, September 2014 Industrial Leasing Page 3 July 2010 8 Toronto Real Estate Board CITY OF TORONTO MUNICIPAL BREAKDOWN Sales1 Dollar Volume1 Average Price1 Median Price1 New Listings2 Active Listings3 Avg. SP/LP4 Avg. DOM5 TREB Total 3,876 $2,853,836,116 $736,284 $615,000 7,758 9,309 99% 24 City of Toronto Total 1,052 $1,001,284,855 $951,792 $730,000 2,291 2,091 100% 20 Toronto West 331 $249,545,593 $753,914 $628,888 710 702 100% 21 Toronto W01 17 $20,806,140 $1,223,891 $1,021,000 30 17 107% 11 Toronto W02 21 $20,748,700 $988,033 $811,500 52 41 103% 15 Toronto W03 39 $18,746,000 $480,667 $467,000 79 76 101% 18 Toronto W04 38 $22,100,900 $581,603 $547,500 82 81 99% 17 Toronto W05 19 $12,581,788 $662,199 $628,888 49 69 97% 22 Toronto W06 43 $28,269,273 $657,425 $622,000 78 62 102% 20 Toronto W07 25 $22,344,427 $893,777 $800,000 42 27 102% 14 Toronto W08 60 $66,583,513 $1,109,725 $993,500 179 205 99% 26 Toronto W09 23 $14,711,900 $639,648 $639,900 55 57 100% 22 Toronto W10 46 $22,652,952 $492,455 $465,000 64 67 98% 28 Toronto Central 334 $500,595,304 $1,498,788 $1,227,500 839 854 99% 23 Toronto C01 6 $5,533,500 $922,250 $1,009,250 20 16 102% 13 Toronto C02 14 $25,243,388 $1,803,099 $1,432,500 36 41 97% 22 Toronto C03 31 $51,139,360 $1,649,657 $1,251,000 77 68 99% 23 Toronto C04 63 $96,280,318 $1,528,259 $1,361,000 176 169 100% 21 Toronto C06 15 $13,865,050 $924,337 $780,000 39 42 97% 27 Toronto C07 41 $43,105,000 $1,051,341 $960,000 97 103 98% 29 Toronto C08 1 $695,000 $695,000 $695,000 1 1 99% 8 Toronto C09 12 $26,254,000 $2,187,833 $2,125,000 46 55 99% 23 Toronto C10 6 $7,764,798 $1,294,133 $1,310,000 22 19 99% 21 Toronto C11 16 $22,946,030 $1,434,127 $1,223,515 42 28 104% 9 Toronto C12 24 $64,987,800 $2,707,825 $2,291,500 70 119 96% 28 Toronto C13 30 $41,537,411 $1,384,580 $1,101,056 62 42 103% 11 Toronto C14 41 $63,998,149 $1,560,930 $1,361,100 90 103 97% 36 Toronto C15 34 $37,245,500 $1,095,456 $1,013,650 61 48 101% 16 Toronto East 387 $251,143,958 $648,951 $595,000 742 535 102% 17 Toronto E01 20 $15,796,990 $789,850 $770,750 36 24 105% 14 Toronto E02 24 $20,892,329 $870,514 $819,000 61 39 102% 12 Toronto E03 55 $37,436,787 $680,669 $640,000 113 65 103% 15 Toronto E04 62 $33,845,511 $545,895 $528,500 106 72 103% 16 Toronto E05 28 $21,539,350 $769,263 $770,175 46 33 103% 14 Toronto E06 21 $14,422,640 $686,792 $595,000 77 56 99% 11 Toronto E07 34 $23,548,875 $692,614 $680,500 38 28 102% 15 Toronto E08 32 $20,500,800 $640,650 $576,500 70 65 99% 34 Toronto E09 41 $21,014,500 $512,549 $512,500 89 68 102% 15 Toronto E10 51 $31,967,226 $626,808 $630,000 73 53 100% 19 Toronto E11 19 $10,178,950 $535,734 $548,250 33 32 98% 18 DETACHED HOUSES, SEPTEMBER 2014 SUMMARY OF EXISTING HOME TRANSACTIONS
- 9. Industrial Leasing Toronto Real Estate Board ALL TREB AREAS Sales1 Dollar Volume1 Average Price1 Median Price1 New Listings2 Active Listings3 Avg. SP/LP4 Avg. DOM5 TREB Total 82- 7 $445,7-93,948 $539-,050 $495-,000 1,4-03 1,0-65 10-2% 1-6 Halton Region 36 $16,246,100 $451,281 $448,000 62 53 99% 15 Burlington 6 $2,681,000 $446,833 $435,500 8 5 99% 9 Halton Hills 4 $1,559,000 $389,750 $397,000 4 4 100% 12 Milton 23 $10,441,100 $453,961 $448,000 33 26 99% 18 Oakville 3- $1,56-5,000 $521-,667 $520-,000 1-7 1-8 99-% 9- Peel Region 270 $121,519,318 $450,072 $445,150 471 398 99% 18 Brampton 124 $49,703,191 $400,832 $390,000 234 215 98% 19 Caledon 5 $2,215,000 $443,000 $445,000 9 6 102% 20 Mississauga 14- 1 $69,60- 1,127 $493-,625 $500-,000 22- 8 17- 7 99-% 1-7 City of Toronto 313 $215,786,666 $689,414 $640,000 595 419 105% 14 - - - - - - - - York Region 126 $67,339,064 $534,437 $547,000 175 125 99% 17 Aurora 12 $5,505,000 $458,750 $480,250 14 7 99% 11 E. Gwillimbury 2 $911,000 $455,500 $455,500 - - 98% 34 Georgina 2 $514,000 $257,000 $257,000 5 6 97% 33 King 1 $305,000 $305,000 $305,000 - - 98% 67 Markham 31 $18,193,176 $586,877 $577,000 46 29 101% 16 Newmarket 17 $7,447,700 $438,100 $449,500 23 17 99% 20 Richmond Hill 13 $7,262,188 $558,630 $568,000 24 25 98% 21 Vaughan 43 $24,805,500 $576,872 $565,000 58 39 99% 16 Whitchurch-Stouffville 5- $2,39-5,500 $479-,100 $493-,500 5- 2- 10-0% 7- Durham Region 66 $19,752,300 $299,277 $259,000 83 55 100% 15 Ajax 12 $4,870,900 $405,908 $398,000 16 8 100% 14 Brock - - - - - - - - Clarington 4 $938,000 $234,500 $238,000 4 4 97% 16 Oshawa 37 $8,652,500 $233,851 $240,000 46 31 100% 15 Pickering 10 $4,178,400 $417,840 $422,450 10 7 102% 14 Scugog - - - - - - - - Uxbridge - - - - - 1 - - Whitby 3- $1,11-2,500 $370-,833 $377-,000 7- 4- 10-0% 8- Dufferin County 7 $1,951,500 $278,786 $292,500 7 8 98% 40 Orangeville 7- $1,95-1,500 $278-,786 $292-,500 7- 8- 98-% 4-0 Simcoe County 9 $3,199,000 $355,444 $321,000 10 7 99% 21 Adjala-Tosorontio - - - - - - - - Bradford West Gwillimbury 7 $2,626,500 $375,214 $408,000 6 3 99% 16 Essa 2 $572,500 $286,250 $286,250 2 2 100% 38 Innisfil - - - - - - - - New Tecumseth - - - - 2 2 - - ! TURN PAGE FOR CITY OF TORONTO TABLES OR CLICK HERE: SUMMARY OF EXISTING HOME TRANSACTIONS SEMI-DETACHED HOUSES, SEPTEMBER 2014 Page 3 July 2010 Market Watch, September 2014 9
- 10. Industrial Leasing Page 3 July 2010 Toronto Real Estate Board Market Watch, September 2014 CITY OF TORONTO MUNICIPAL BREAKDOWN Sales1 Dollar Volume1 Average Price1 Median Price1 New Listings2 Active Listings3 Avg. SP/LP4 Avg. DOM5 TREB Total 827 $445,793,948 $539,050 $495,000 1,403 1,065 102% 16 City of Toronto Total 313 $215,786,666 $689,414 $640,000 595 419 105% 14 Toronto West 90 $52,376,548 $581,962 $579,500 189 161 103% 16 Toronto W01 2 $1,334,000 $667,000 $667,000 6 4 107% 9 Toronto W02 32 $22,441,048 $701,283 $685,000 62 30 107% 9 Toronto W03 12 $6,449,000 $537,417 $550,000 48 47 104% 10 Toronto W04 2 $882,000 $441,000 $441,000 5 9 102% 37 Toronto W05 25 $12,269,700 $490,788 $455,000 48 54 99% 20 Toronto W06 5 $3,165,000 $633,000 $630,000 4 4 99% 24 Toronto W07 1 $482,000 $482,000 $482,000 - - 111% 6 Toronto W08 1 $553,000 $553,000 $553,000 3 1 99% 12 Toronto W09 3 $1,623,800 $541,267 $480,000 7 4 98% 24 Toronto W10 7 $3,177,000 $453,857 $436,000 6 8 97% 30 Toronto Central 92 $80,474,180 $874,719 $778,500 173 113 106% 12 Toronto C01 18 $18,873,970 $1,048,554 $1,003,000 35 22 107% 14 Toronto C02 12 $13,692,500 $1,141,042 $911,500 33 25 104% 18 Toronto C03 9 $5,427,600 $603,067 $610,000 19 10 105% 11 Toronto C04 6 $5,855,000 $975,833 $982,500 7 1 110% 7 Toronto C06 1 $600,000 $600,000 $600,000 1 2 100% 15 Toronto C07 2 $1,215,700 $607,850 $607,850 7 8 102% 4 Toronto C08 5 $4,406,500 $881,300 $749,000 8 7 101% 12 Toronto C09 2 $3,399,000 $1,699,500 $1,699,500 5 2 100% 4 Toronto C10 8 $7,126,010 $890,751 $905,000 13 5 114% 6 Toronto C11 6 $4,872,500 $812,083 $725,500 7 1 108% 4 Toronto C12 1 $1,225,000 $1,225,000 $1,225,000 2 1 102% 8 Toronto C13 7 $4,164,800 $594,971 $561,000 11 9 102% 15 Toronto C14 - - - - - - - - Toronto C15 15 $9,615,600 $641,040 $646,000 25 20 104% 18 Toronto East 131 $82,935,938 $633,099 $605,500 233 145 106% 13 Toronto E01 38 $27,872,067 $733,475 $722,500 77 42 109% 14 Toronto E02 26 $17,978,129 $691,467 $640,115 56 35 104% 8 Toronto E03 25 $16,895,542 $675,822 $666,000 39 23 110% 11 Toronto E04 4 $1,783,000 $445,750 $456,500 7 8 106% 10 Toronto E05 6 $3,182,500 $530,417 $517,450 10 7 100% 29 Toronto E06 1 $458,000 $458,000 $458,000 2 3 98% 2 Toronto E07 10 $5,328,300 $532,830 $529,000 15 11 103% 12 Toronto E08 2 $953,000 $476,500 $476,500 1 1 99% 13 Toronto E09 1 $471,000 $471,000 $471,000 5 4 105% 4 Toronto E10 7 $2,987,900 $426,843 $368,000 7 4 102% 23 Toronto E11 11 $5,026,500 $456,955 $445,000 14 7 101% 18 SUMMARY OF EXISTING HOME TRANSACTIONS SEMI-DETACHED HOUSES, SEPTEMBER 2014 10
- 11. Industrial Leasing Page 3 July 2010 Toronto Real Estate Board Market Watch, September 2014 ALL TREB AREAS Sales1 Dollar Volume1 Average Price1 Median Price1 New Listings2 Active Listings3 Avg. SP/LP4 Avg. DOM5 TREB Total 60- 5 $226,9-28,353 $375-,088 $359-,000 1,0-17 1,1-48 99-% 2-5 Halton Region 46 $16,693,500 $362,902 $354,500 74 88 98% 23 Burlington 19 $6,654,800 $350,253 $340,000 29 31 98% 19 Halton Hills 2 $488,900 $244,450 $244,450 7 7 98% 25 Milton 4 $1,133,000 $283,250 $285,000 5 10 97% 38 Oakville 2-1 $8,41-6,800 $400-,800 $404-,500 3-3 4-0 98-% 2-5 Peel Region 234 $80,885,647 $345,665 $336,250 329 370 98% 28 Brampton 67 $19,579,358 $292,229 $292,000 85 98 98% 31 Caledon - - - - 2 2 - - Mississauga 16- 7 $61,30- 6,289 $367-,104 $370-,000 24- 2 27- 0 98-% 2-7 City of Toronto 208 $86,337,956 $415,086 $387,000 403 478 99% 24 - - - - - - - - York Region 64 $29,663,750 $463,496 $428,000 135 143 99% 22 Aurora 8 $4,232,500 $529,063 $430,300 9 19 98% 51 E. Gwillimbury - - - - - - - - Georgina 1 $255,000 $255,000 $255,000 - - 98% 22 King - - - - - - - - Markham 36 $17,163,500 $476,764 $429,400 68 62 99% 18 Newmarket 5 $1,668,150 $333,630 $317,500 16 13 98% 15 Richmond Hill 7 $3,227,100 $461,014 $460,000 19 21 100% 20 Vaughan 6 $2,852,500 $475,417 $463,500 22 27 98% 20 Whitchurch-Stouffville 1- $265-,000 $265-,000 $265-,000 1- 1- 99-% 2-6 Durham Region 47 $11,930,500 $253,840 $260,000 70 62 99% 21 Ajax 8 $2,249,500 $281,188 $288,000 8 8 99% 21 Brock 1 $208,000 $208,000 $208,000 3 4 90% 137 Clarington 2 $609,900 $304,950 $304,950 8 14 98% 15 Oshawa 11 $1,832,900 $166,627 $185,000 13 10 97% 25 Pickering 16 $4,855,900 $303,494 $285,500 27 18 100% 12 Scugog - - - - - - - - Uxbridge 1 $342,000 $342,000 $342,000 2 4 98% 78 Whitby 8- $1,83-2,300 $229-,038 $233-,200 9- 4- 10-1% 1-3 Dufferin County 2 $397,000 $198,500 $198,500 3 3 98% 89 Orangeville 2- $397-,000 $198-,500 $198-,500 3- 3- 98-% 8-9 Simcoe County 4 $1,020,000 $255,000 $253,500 3 4 98% 21 Adjala-Tosorontio - - - - - - - - Bradford West Gwillimbury 2 $560,000 $280,000 $280,000 2 1 98% 16 Essa - - - - - - - - Innisfil - - - - - - - - New Tecumseth 2 $460,000 $230,000 $230,000 1 3 98% 27 ! TURN PAGE FOR CITY OF TORONTO TABLES OR CLICK HERE: SUMMARY OF EXISTING HOME TRANSACTIONS CONDOMINIUM TOWNHOUSES, SEPTEMBER 2014 11
- 12. Industrial Leasing Page 3 July 2010 Toronto Real Estate Board Market Watch, September 2014 12 CITY OF TORONTO MUNICIPAL BREAKDOWN Sales1 Dollar Volume1 Average Price1 Median Price1 New Listings2 Active Listings3 Avg. SP/LP4 Avg. DOM5 TREB Total 605 $226,928,353 $375,088 $359,000 1,017 1,148 99% 25 City of Toronto Total 208 $86,337,956 $415,086 $387,000 403 478 99% 24 Toronto West 60 $21,936,979 $365,616 $349,125 97 135 98% 28 Toronto W01 5 $2,482,079 $496,416 $475,000 7 5 101% 22 Toronto W02 10 $4,702,400 $470,240 $425,000 15 13 99% 29 Toronto W03 1 $268,000 $268,000 $268,000 2 3 98% 60 Toronto W04 3 $1,105,000 $368,333 $415,000 8 12 100% 30 Toronto W05 20 $4,941,250 $247,063 $253,500 23 36 97% 23 Toronto W06 4 $2,037,000 $509,250 $527,000 12 17 99% 16 Toronto W07 - - - - - - - - Toronto W08 7 $3,043,250 $434,750 $445,000 15 20 98% 30 Toronto W09 3 $1,563,000 $521,000 $471,000 6 5 98% 35 Toronto W10 7 $1,795,000 $256,429 $300,000 9 24 96% 39 Toronto Central 78 $40,831,746 $523,484 $459,500 171 203 99% 25 Toronto C01 26 $15,780,558 $606,945 $590,500 44 40 99% 26 Toronto C02 - - - - 2 6 - - Toronto C03 - - - - 3 5 - - Toronto C04 - - - - - 2 - - Toronto C06 - - - - 2 6 - - Toronto C07 11 $5,486,900 $498,809 $445,000 12 15 98% 30 Toronto C08 4 $1,936,900 $484,225 $422,450 8 12 99% 17 Toronto C09 1 $769,000 $769,000 $769,000 2 2 96% 53 Toronto C10 1 $440,000 $440,000 $440,000 4 5 98% 55 Toronto C11 3 $1,110,000 $370,000 $415,000 6 4 98% 31 Toronto C12 2 $1,801,888 $900,944 $900,944 10 19 101% 11 Toronto C13 3 $1,300,000 $433,333 $365,000 7 4 99% 14 Toronto C14 10 $5,111,000 $511,100 $450,000 25 35 99% 33 Toronto C15 17 $7,095,500 $417,382 $413,000 46 48 100% 14 Toronto East 70 $23,569,231 $336,703 $341,750 135 140 100% 21 Toronto E01 3 $1,190,700 $396,900 $445,800 11 8 101% 6 Toronto E02 3 $1,518,900 $506,300 $529,000 4 4 99% 18 Toronto E03 - - - - - - - - Toronto E04 4 $1,500,000 $375,000 $414,000 9 14 100% 14 Toronto E05 22 $8,398,468 $381,749 $380,750 28 18 101% 17 Toronto E06 1 $299,900 $299,900 $299,900 5 4 100% 2 Toronto E07 7 $2,576,300 $368,043 $371,500 20 17 98% 18 Toronto E08 2 $557,000 $278,500 $278,500 11 17 98% 27 Toronto E09 8 $2,268,963 $283,620 $290,500 17 17 98% 27 Toronto E10 7 $1,852,000 $264,571 $290,000 12 16 98% 35 Toronto E11 13 $3,407,000 $262,077 $265,000 18 25 101% 25 SUMMARY OF EXISTING HOME TRANSACTIONS CONDOMINIUM TOWNHOUSES, SEPTEMBER 2014
- 13. Industrial Leasing Page 3 July 2010 Toronto Real Estate Board Market Watch, September 2014 ALL TREB AREAS Sales1 Dollar Volume1 Average Price1 Median Price1 New Listings2 Active Listings3 Avg. SP/LP4 Avg. DOM5 TREB Total 1,9-76 $724,3-78,503 $366-,588 $323-,950 4,2-96 6,6-20 98-% 3-4 Halton Region 75 $24,845,705 $331,276 $305,000 112 184 99% 35 Burlington 30 $8,991,425 $299,714 $268,500 36 59 98% 38 Halton Hills 5 $1,410,900 $282,180 $313,500 3 3 98% 17 Milton 12 $3,631,880 $302,657 $302,500 21 22 99% 26 Oakville 2-8 $10,81- 1,500 $386-,125 $376-,950 5-2 10- 0 99-% 4-0 Peel Region 269 $71,756,665 $266,753 $254,000 564 933 97% 37 Brampton 31 $7,218,900 $232,868 $224,500 65 91 97% 32 Caledon - - - - 1 2 - - Mississauga 23- 8 $64,53- 7,765 $271-,167 $256-,250 49- 8 84- 0 97-% 3-8 City of Toronto 1,376 $544,214,981 $395,505 $343,000 3,082 4,579 98% 33 - - - - - - - - York Region 201 $69,878,562 $347,655 $325,000 470 825 98% 43 Aurora 12 $4,436,600 $369,717 $350,000 12 18 97% 38 E. Gwillimbury - - - - - - - - Georgina - - - - 1 1 - - King 1 $475,000 $475,000 $475,000 5 27 99% 37 Markham 73 $24,259,068 $332,316 $316,000 170 277 97% 45 Newmarket 4 $1,126,000 $281,500 $263,500 6 9 98% 33 Richmond Hill 57 $19,306,676 $338,714 $312,000 143 241 97% 45 Vaughan 53 $19,857,218 $374,664 $370,000 133 247 98% 40 Whitchurch-Stouffville 1- $418-,000 $418-,000 $418-,000 -- 5- 98-% 3-0 Durham Region 50 $12,590,100 $251,802 $242,500 66 79 98% 22 Ajax 8 $1,911,250 $238,906 $229,000 10 10 98% 15 Brock - - - - - - - - Clarington 10 $2,163,500 $216,350 $201,750 14 15 96% 20 Oshawa 8 $1,519,300 $189,913 $165,000 13 23 98% 27 Pickering 15 $4,206,250 $280,417 $270,000 20 18 99% 14 Scugog 1 $315,000 $315,000 $315,000 - - 98% 38 Uxbridge 2 $568,000 $284,000 $284,000 3 3 98% 32 Whitby 6- $1,90-6,800 $317-,800 $291-,700 6- 1-0 98-% 4-6 Dufferin County 2 $466,000 $233,000 $233,000 2 9 96% 29 Orangeville 2- $466-,000 $233-,000 $233-,000 2- 9- 96-% 2-9 Simcoe County 3 $626,490 $208,830 $202,500 - 11 99% 69 Adjala-Tosorontio - - - - - - - - Bradford West Gwillimbury 1 $234,990 $234,990 $234,990 - 4 100% 119 Essa - - - - - - - - Innisfil - - - - - - - - New Tecumseth 2 $391,500 $195,750 $195,750 - 7 98% 44 ! TURN PAGE FOR CITY OF TORONTO TABLES OR CLICK HERE: SUMMARY OF EXISTING HOME TRANSACTIONS CONDOMINIUM APARTMENT, SEPTEMBER 2014 13
- 14. Industrial Leasing Page 3 July 2010 Toronto Real Estate Board Market Watch, September 2014 14 CITY OF TORONTO MUNICIPAL BREAKDOWN Sales1 Dollar Volume1 Average Price1 Median Price1 New Listings2 Active Listings3 Avg. SP/LP4 Avg. DOM5 TREB Total 1,976 $724,378,503 $366,588 $323,950 4,296 6,620 98% 34 City of Toronto Total 1,376 $544,214,981 $395,505 $343,000 3,082 4,579 98% 33 Toronto West 272 $83,566,952 $307,231 $297,000 616 997 98% 38 Toronto W01 19 $7,610,499 $400,553 $351,000 61 112 100% 36 Toronto W02 14 $5,917,890 $422,706 $388,500 33 44 99% 25 Toronto W03 3 $710,000 $236,667 $229,000 7 10 92% 28 Toronto W04 23 $4,408,750 $191,685 $163,250 32 66 96% 40 Toronto W05 23 $4,940,250 $214,793 $184,000 61 111 97% 35 Toronto W06 50 $19,078,203 $381,564 $341,500 166 289 97% 44 Toronto W07 4 $2,153,000 $538,250 $536,000 5 8 99% 27 Toronto W08 95 $30,768,360 $323,877 $305,000 161 226 98% 37 Toronto W09 13 $2,935,500 $225,808 $233,000 29 45 96% 31 Toronto W10 28 $5,044,500 $180,161 $191,750 61 86 97% 41 Toronto Central 876 $397,635,677 $453,922 $379,950 2,058 3,064 98% 32 Toronto C01 374 $164,700,148 $440,375 $381,500 802 1,288 98% 35 Toronto C02 32 $36,376,890 $1,136,778 $677,000 94 156 97% 37 Toronto C03 7 $4,331,000 $618,714 $625,000 31 49 102% 14 Toronto C04 14 $7,985,100 $570,364 $485,500 23 22 98% 20 Toronto C06 14 $4,303,900 $307,421 $311,450 44 69 97% 47 Toronto C07 53 $19,214,550 $362,539 $334,500 109 183 98% 38 Toronto C08 126 $57,826,205 $458,938 $397,000 287 340 99% 29 Toronto C09 9 $5,817,000 $646,333 $549,000 27 29 104% 8 Toronto C10 23 $10,809,700 $469,987 $402,000 69 90 99% 34 Toronto C11 22 $5,628,430 $255,838 $239,250 32 35 99% 29 Toronto C12 9 $5,844,890 $649,432 $579,000 27 29 98% 19 Toronto C13 40 $14,399,500 $359,988 $313,000 67 66 99% 18 Toronto C14 92 $36,664,700 $398,529 $376,900 276 439 98% 31 Toronto C15 61 $23,733,664 $389,076 $322,500 170 269 97% 36 Toronto East 228 $63,012,352 $276,370 $250,250 408 518 99% 30 Toronto E01 11 $5,502,200 $500,200 $525,000 33 32 100% 19 Toronto E02 6 $2,899,000 $483,167 $415,000 16 22 105% 17 Toronto E03 8 $2,133,400 $266,675 $159,950 14 13 96% 39 Toronto E04 30 $5,845,086 $194,836 $189,500 50 51 96% 27 Toronto E05 33 $9,736,778 $295,054 $287,990 60 57 98% 25 Toronto E06 9 $3,885,900 $431,767 $439,900 19 15 105% 13 Toronto E07 39 $9,684,700 $248,326 $255,000 55 108 97% 34 Toronto E08 18 $4,175,200 $231,956 $199,500 33 38 98% 18 Toronto E09 64 $17,379,688 $271,558 $258,400 86 121 98% 36 Toronto E10 1 $200,000 $200,000 $200,000 12 20 98% 61 Toronto E11 9 $1,570,400 $174,489 $192,500 30 41 98% 32 SUMMARY OF EXISTING HOME TRANSACTIONS CONDOMINIUM APARTMENT, SEPTEMBER 2014
- 15. Industrial Leasing Page 3 July 2010 Toronto Real Estate Board Market Watch, September 2014 ALL TREB AREAS Sales1 Dollar Volume1 Average Price1 Median Price1 New Listings2 Active Listings3 Avg. SP/LP4 Avg. DOM5 TREB Total 12- 3 $62,51- 9,906 $508-,292 $525-,000 16- 8 12- 1 10-0% 1-9 Halton Region 4 $1,723,500 $430,875 $406,750 10 10 99% 34 Burlington 2 $770,000 $385,000 $385,000 1 1 98% 39 Halton Hills - - - - - - - - Milton 1 $428,500 $428,500 $428,500 6 5 99% 30 Oakville 1- $525-,000 $525-,000 $525-,000 3- 4- 10-0% 2-7 Peel Region 16 $7,055,918 $440,995 $449,000 11 14 98% 24 Brampton 10 $3,986,418 $398,642 $380,250 7 6 98% 21 Caledon 1 $615,000 $615,000 $615,000 - - 99% 15 Mississauga 5- $2,45-4,500 $490-,900 $484-,000 4- 8- 98-% 3-2 City of Toronto 13 $6,480,700 $498,515 $538,500 23 23 101% 15 - - - - - - - - York Region 57 $36,179,588 $634,730 $626,800 80 47 101% 16 Aurora 1 $520,000 $520,000 $520,000 1 1 98% 27 E. Gwillimbury - - - - - - - - Georgina - - - - - 1 - - King 1 $493,500 $493,500 $493,500 1 1 101% 7 Markham 37 $23,917,400 $646,416 $626,800 57 32 102% 16 Newmarket - - - - - - - - Richmond Hill 11 $6,878,188 $625,290 $642,000 12 5 99% 16 Vaughan 5 $3,296,500 $659,300 $685,000 8 7 100% 10 Whitchurch-Stouffville 2- $1,07-4,000 $537-,000 $537-,000 1- -- 98-% 4-2 Durham Region 23 $7,419,300 $322,578 $315,500 34 20 102% 17 Ajax 4 $1,521,500 $380,375 $386,000 5 3 104% 13 Brock - - - - - - - - Clarington 7 $2,195,500 $313,643 $315,000 12 8 102% 9 Oshawa 7 $1,879,300 $268,471 $260,000 7 3 100% 26 Pickering - - - - 1 1 - - Scugog - - - - - - - - Uxbridge - - - - - - - - Whitby 5- $1,82-3,000 $364-,600 $354-,500 9- 5- 10-1% 1-7 Dufferin County 2 $614,500 $307,250 $307,250 - 1 98% 72 Orangeville 2- $614-,500 $307-,250 $307-,250 -- 1- 98-% 7-2 Simcoe County 8 $3,046,400 $380,800 $397,500 10 6 99% 14 Adjala-Tosorontio - - - - - - - - Bradford West Gwillimbury 6 $2,474,900 $412,483 $415,000 7 4 99% 15 Essa 1 $289,000 $289,000 $289,000 1 - 99% 9 Innisfil - - - - 2 2 - - New Tecumseth 1 $282,500 $282,500 $282,500 - - 99% 15 SUMMARY OF EXISTING HOME TRANSACTIONS LINK, SEPTEMBER 2014 ! TURN PAGE FOR CITY OF TORONTO TABLES OR CLICK HERE: 15
- 16. Industrial Leasing Page 3 July 2010 Toronto Real Estate Board Market Watch, September 2014 16 CITY OF TORONTO MUNICIPAL BREAKDOWN Sales1 Dollar Volume1 Average Price1 Median Price1 New Listings2 Active Listings3 Avg. SP/LP4 Avg. DOM5 TREB Total 123 $62,519,906 $508,292 $525,000 168 121 100% 19 City of Toronto Total 13 $6,480,700 $498,515 $538,500 23 23 101% 15 Toronto West - - - - 3 5 - - Toronto W01 - - - - - - - - Toronto W02 - - - - - - - - Toronto W03 - - - - - - - - Toronto W04 - - - - - - - - Toronto W05 - - - - 2 3 - - Toronto W06 - - - - - - - - Toronto W07 - - - - - - - - Toronto W08 - - - - - - - - Toronto W09 - - - - 1 1 - - Toronto W10 - - - - - 1 - - Toronto Central 2 $1,279,000 $639,500 $639,500 4 4 107% 5 Toronto C01 - - - - - - - - Toronto C02 - - - - - - - - Toronto C03 - - - - - - - - Toronto C04 - - - - - - - - Toronto C06 - - - - - - - - Toronto C07 1 $606,000 $606,000 $606,000 2 3 101% 6 Toronto C08 - - - - - - - - Toronto C09 - - - - - - - - Toronto C10 - - - - - - - - Toronto C11 - - - - - - - - Toronto C12 - - - - - - - - Toronto C13 - - - - - - - - Toronto C14 - - - - - - - - Toronto C15 1 $673,000 $673,000 $673,000 2 1 112% 3 Toronto East 11 $5,201,700 $472,882 $519,000 16 14 99% 17 Toronto E01 - - - - - - - - Toronto E02 - - - - - - - - Toronto E03 - - - - - - - - Toronto E04 - - - - - - - - Toronto E05 2 $1,083,500 $541,750 $541,750 9 8 98% 11 Toronto E06 - - - - - - - - Toronto E07 4 $2,208,300 $552,075 $558,650 4 5 100% 14 Toronto E08 - - - - - - - - Toronto E09 - - - - - - - - Toronto E10 - - - - - 1 - - Toronto E11 5 $1,909,900 $381,980 $392,900 3 - 100% 22 SUMMARY OF EXISTING HOME TRANSACTIONS LINK, SEPTEMBER 2014
- 17. Industrial Leasing Page 3 July 2010 Toronto Real Estate Board Market Watch, September 2014 ALL TREB AREAS Sales1 Dollar Volume1 Average Price1 Median Price1 New Listings2 Active Listings3 Avg. SP/LP4 Avg. DOM5 TREB Total 62- 2 $295,1-71,625 $474-,552 $442-,750 1,0-04 80- 9 10-0% 1-6 Halton Region 111 $49,539,517 $446,302 $423,000 200 155 99% 17 Burlington 11 $5,216,600 $474,236 $435,000 17 14 100% 16 Halton Hills 15 $5,911,650 $394,110 $407,000 12 6 99% 22 Milton 57 $23,236,477 $407,657 $412,500 91 62 99% 15 Oakville 2-8 $15,17- 4,790 $541-,957 $496-,250 8-0 7-3 99-% 1-9 Peel Region 112 $46,337,028 $413,723 $401,750 200 180 99% 17 Brampton 70 $26,685,240 $381,218 $382,000 136 127 99% 19 Caledon 9 $3,685,900 $409,544 $410,000 13 9 99% 10 Mississauga 3-3 $15,96- 5,888 $483-,815 $480-,000 5-1 4-4 99-% 1-4 City of Toronto 88 $54,678,828 $621,350 $612,500 183 153 103% 15 - - - - - - - - York Region 196 $106,269,552 $542,192 $536,250 276 235 100% 19 Aurora 10 $4,679,900 $467,990 $469,000 16 14 100% 12 E. Gwillimbury 4 $1,391,400 $347,850 $354,500 6 5 99% 11 Georgina 3 $985,500 $328,500 $337,500 9 12 99% 11 King 1 $714,000 $714,000 $714,000 2 4 99% 23 Markham 53 $30,488,988 $575,264 $560,100 69 46 101% 16 Newmarket 12 $5,422,888 $451,907 $444,944 23 17 99% 25 Richmond Hill 53 $30,292,176 $571,550 $566,000 71 64 100% 18 Vaughan 50 $27,878,200 $557,564 $547,000 67 70 99% 26 Whitchurch-Stouffville 1-0 $4,41-6,500 $441-,650 $445-,000 1-3 3- 10-0% 6- Durham Region 99 $33,809,000 $341,505 $343,000 123 66 101% 9 Ajax 31 $11,041,900 $356,190 $356,000 39 22 101% 11 Brock - - - - - - - - Clarington 14 $3,918,800 $279,914 $287,450 21 9 101% 6 Oshawa 8 $2,472,500 $309,063 $311,000 13 15 100% 9 Pickering 12 $4,585,800 $382,150 $397,000 14 7 101% 8 Scugog - - - - - - - - Uxbridge - - - - - - - - Whitby 3-4 $11,79- 0,000 $346-,765 $344-,000 3-6 1-3 10-1% 1-0 Dufferin County 2 $533,000 $266,500 $266,500 8 8 99% 31 Orangeville 2- $533-,000 $266-,500 $266-,500 8- 8- 99-% 3-1 Simcoe County 14 $4,004,700 $286,050 $275,750 14 12 98% 16 Adjala-Tosorontio - - - - - - - - Bradford West Gwillimbury 2 $791,700 $395,850 $395,850 4 5 100% 16 Essa 3 $744,000 $248,000 $248,000 2 - 99% 12 Innisfil 2 $520,000 $260,000 $260,000 2 5 97% 30 New Tecumseth 7 $1,949,000 $278,429 $285,000 6 2 98% 14 ! TURN PAGE FOR CITY OF TORONTO TABLES OR CLICK HERE: SUMMARY OF EXISTING HOME TRANSACTIONS ATTACHED/ROW/TOWNHOUSE, SEPTEMBER 2014 17
- 18. Industrial Leasing Page 3 July 2010 Toronto Real Estate Board Market Watch, September 2014 18 CITY OF TORONTO MUNICIPAL BREAKDOWN Sales1 Dollar Volume1 Average Price1 Median Price1 New Listings2 Active Listings3 Avg. SP/LP4 Avg. DOM5 TREB Total 622 $295,171,625 $474,552 $442,750 1,004 809 100% 16 City of Toronto Total 88 $54,678,828 $621,350 $612,500 183 153 103% 15 Toronto West 25 $15,006,524 $600,261 $580,000 50 38 104% 15 Toronto W01 3 $2,335,000 $778,333 $810,000 5 4 113% 5 Toronto W02 4 $2,662,000 $665,500 $652,250 12 8 114% 6 Toronto W03 1 $429,024 $429,024 $429,024 5 4 102% 16 Toronto W04 2 $859,000 $429,500 $429,500 7 7 99% 24 Toronto W05 3 $1,393,000 $464,333 $460,000 3 4 100% 12 Toronto W06 7 $4,555,000 $650,714 $668,000 9 5 100% 19 Toronto W07 1 $649,000 $649,000 $649,000 3 3 108% 8 Toronto W08 3 $1,658,000 $552,667 $570,000 5 3 97% 29 Toronto W09 - - - - - - - - Toronto W10 1 $466,500 $466,500 $466,500 1 - 97% 3 Toronto Central 21 $17,342,516 $825,834 $740,000 67 75 102% 17 Toronto C01 6 $4,575,416 $762,569 $672,550 17 16 105% 17 Toronto C02 1 $1,010,000 $1,010,000 $1,010,000 9 12 102% 9 Toronto C03 - - - - 1 2 - - Toronto C04 1 $695,000 $695,000 $695,000 3 6 99% 29 Toronto C06 - - - - - - - - Toronto C07 1 $708,000 $708,000 $708,000 7 8 101% 4 Toronto C08 6 $4,489,100 $748,183 $739,500 9 4 103% 16 Toronto C09 1 $1,310,000 $1,310,000 $1,310,000 2 2 103% 2 Toronto C10 1 $810,000 $810,000 $810,000 4 3 111% 7 Toronto C11 1 $1,350,000 $1,350,000 $1,350,000 2 4 98% 24 Toronto C12 - - - - - 1 - - Toronto C13 1 $740,000 $740,000 $740,000 5 4 101% 3 Toronto C14 2 $1,655,000 $827,500 $827,500 8 13 98% 43 Toronto C15 - - - - - - - - Toronto East 42 $22,329,788 $531,662 $526,900 66 40 102% 14 Toronto E01 8 $5,784,488 $723,061 $685,444 16 9 107% 10 Toronto E02 5 $2,922,000 $584,400 $615,000 6 3 101% 9 Toronto E03 2 $790,000 $395,000 $395,000 2 1 96% 21 Toronto E04 6 $3,202,000 $533,667 $546,000 9 9 98% 23 Toronto E05 3 $1,543,800 $514,600 $525,000 7 4 105% 7 Toronto E06 - - - - 1 - - - Toronto E07 3 $1,451,000 $483,667 $490,000 6 3 106% 9 Toronto E08 3 $1,444,000 $481,333 $479,000 4 3 103% 27 Toronto E09 1 $457,000 $457,000 $457,000 - - 100% 9 Toronto E10 6 $2,697,500 $449,583 $450,500 5 2 101% 13 Toronto E11 5 $2,038,000 $407,600 $335,000 10 6 99% 10 SUMMARY OF EXISTING HOME TRANSACTIONS ATTACHED/ROW/TOWNHOUSE, SEPTEMBER 2014
- 19. Industrial Leasing Page 3 July 2010 Toronto Real Estate Board Market Watch, September 2014 ALL TREB AREAS Sales1 Dollar Volume1 Average Price1 Median Price1 New Listings2 Active Listings3 Avg. SP/LP4 Avg. DOM5 TREB Total 8- $1,67-8,988 $209-,874 $181-,000 2-0 4-0 98-% 3-6 Halton Region - - - - - - - - Burlington - - - - - - - - Halton Hills - - - - - - - - Milton - - - - - - - - Oakville -- -- -- -- -- -- -- -- Peel Region - - - - - 1 - - Brampton - - - - - - - - Caledon - - - - - - - - Mississauga -- -- -- -- -- 1- -- -- City of Toronto 8 $1,678,988 $209,874 $181,000 18 37 98% 36 - - - - - - - - York Region - - - - 1 1 - - Aurora - - - - - - - - E. Gwillimbury - - - - - - - - Georgina - - - - - - - - King - - - - - - - - Markham - - - - - - - - Newmarket - - - - - - - - Richmond Hill - - - - - - - - Vaughan - - - - 1 1 - - Whitchurch-Stouffville -- -- -- -- -- -- -- -- Durham Region - - - - 1 1 - - Ajax - - - - - - - - Brock - - - - - - - - Clarington - - - - 1 1 - - Oshawa - - - - - - - - Pickering - - - - - - - - Scugog - - - - - - - - Uxbridge - - - - - - - - Whitby -- -- -- -- -- -- -- -- Dufferin County - - - - - - - - Orangeville -- -- -- -- -- -- -- -- Simcoe County - - - - - - - - Adjala-Tosorontio - - - - - - - - Bradford West Gwillimbury - - - - - - - - Essa - - - - - - - - Innisfil - - - - - - - - New Tecumseth - - - - - - - - SUMMARY OF EXISTING HOME TRANSACTIONS CO-OP APARTMENT, SEPTEMBER 2014 ! TURN PAGE FOR CITY OF TORONTO TABLES OR CLICK HERE: 19
- 20. Industrial Leasing Page 3 July 2010 Toronto Real Estate Board Market Watch, September 2014 20 CITY OF TORONTO MUNICIPAL BREAKDOWN Sales1 Dollar Volume1 Average Price1 Median Price1 New Listings2 Active Listings3 Avg. SP/LP4 Avg. DOM5 TREB Total 8 $1,678,988 $209,874 $181,000 20 40 98% 36 City of Toronto Total 8 $1,678,988 $209,874 $181,000 18 37 98% 36 Toronto West 5 $910,700 $182,140 $142,500 9 10 99% 32 Toronto W01 - - - - 1 1 - - Toronto W02 1 $219,500 $219,500 $219,500 - - 110% 7 Toronto W03 - - - - - - - - Toronto W04 - - - - - - - - Toronto W05 1 $108,200 $108,200 $108,200 4 6 101% 16 Toronto W06 2 $278,000 $139,000 $139,000 1 1 96% 60 Toronto W07 1 $305,000 $305,000 $305,000 2 1 94% 15 Toronto W08 - - - - - - - - Toronto W09 - - - - 1 1 - - Toronto W10 - - - - - - - - Toronto Central 2 $698,288 $349,144 $349,144 9 25 98% 45 Toronto C01 1 $303,288 $303,288 $303,288 1 3 98% 38 Toronto C02 1 $395,000 $395,000 $395,000 2 4 99% 51 Toronto C03 - - - - - 1 - - Toronto C04 - - - - 2 4 - - Toronto C06 - - - - - - - - Toronto C07 - - - - - 1 - - Toronto C08 - - - - - - - - Toronto C09 - - - - 3 7 - - Toronto C10 - - - - - 1 - - Toronto C11 - - - - - - - - Toronto C12 - - - - - - - - Toronto C13 - - - - - - - - Toronto C14 - - - - - 2 - - Toronto C15 - - - - 1 2 - - Toronto East 1 $70,000 $70,000 $70,000 - 2 93% 42 Toronto E01 - - - - - - - - Toronto E02 - - - - - - - - Toronto E03 - - - - - - - - Toronto E04 - - - - - - - - Toronto E05 - - - - - - - - Toronto E06 - - - - - - - - Toronto E07 - - - - - - - - Toronto E08 - - - - - - - - Toronto E09 - - - - - 1 - - Toronto E10 1 $70,000 $70,000 $70,000 - 1 93% 42 Toronto E11 - - - - - - - - SUMMARY OF EXISTING HOME TRANSACTIONS CO-OP APARTMENT, SEPTEMBER 2014
- 21. Industrial Leasing Page 3 July 2010 Toronto Real Estate Board Market Watch, September 2014 ALL TREB AREAS Sales1 Dollar Volume1 Average Price1 Median Price1 New Listings2 Active Listings3 Avg. SP/LP4 Avg. DOM5 TREB Total 1-1 $7,35-6,500 $668-,773 $532-,500 1-3 2-9 98-% 6-6 Halton Region 1 $579,000 $579,000 $579,000 1 3 97% 2 Burlington 1 $579,000 $579,000 $579,000 - - 97% 2 Halton Hills - - - - - - - - Milton - - - - - - - - Oakville -- -- -- -- 1- 3- -- -- Peel Region 3 $1,990,500 $663,500 $532,500 5 10 97% 83 Brampton 2 $1,047,500 $523,750 $523,750 3 8 97% 65 Caledon - - - - - - - - Mississauga 1- $943-,000 $943-,000 $943-,000 2- 2- 97-% 11- 9 City of Toronto 2 $2,456,000 $1,228,000 $1,228,000 1 - 101% 44 - - - - - - - - York Region - - - - 1 1 - - Aurora - - - - - - - - E. Gwillimbury - - - - - - - - Georgina - - - - - - - - King - - - - - - - - Markham - - - - 1 1 - - Newmarket - - - - - - - - Richmond Hill - - - - - - - - Vaughan - - - - - - - - Whitchurch-Stouffville -- -- -- -- -- -- -- -- Durham Region - - - - - - - - Ajax - - - - - - - - Brock - - - - - - - - Clarington - - - - - - - - Oshawa - - - - - - - - Pickering - - - - - - - - Scugog - - - - - - - - Uxbridge - - - - - - - - Whitby -- -- -- -- -- -- -- -- Dufferin County - - - - - - - - Orangeville -- -- -- -- -- -- -- -- Simcoe County 5 $2,331,000 $466,200 $481,000 5 15 97% 78 Adjala-Tosorontio - - - - - - - - Bradford West Gwillimbury - - - - - - - - Essa - - - - - - - - Innisfil - - - - - - - - New Tecumseth 5 $2,331,000 $466,200 $481,000 5 15 97% 78 ! TURN PAGE FOR CITY OF TORONTO TABLES OR CLICK HERE: SUMMARY OF EXISTING HOME TRANSACTIONS DETACHED CONDOMINIUM, SEPTEMBER 2014 21
- 22. Industrial Leasing Page 3 July 2010 Toronto Real Estate Board Market Watch, September 2014 22 CITY OF TORONTO MUNICIPAL BREAKDOWN Sales1 Dollar Volume1 Average Price1 Median Price1 New Listings2 Active Listings3 Avg. SP/LP4 Avg. DOM5 TREB Total 11 $7,356,500 $668,773 $532,500 13 29 98% 66 City of Toronto Total 2 $2,456,000 $1,228,000 $1,228,000 1 - 101% 44 Toronto West 1 $136,000 $136,000 $136,000 - - 97% 47 Toronto W01 - - - - - - - - Toronto W02 - - - - - - - - Toronto W03 - - - - - - - - Toronto W04 - - - - - - - - Toronto W05 - - - - - - - - Toronto W06 - - - - - - - - Toronto W07 - - - - - - - - Toronto W08 - - - - - - - - Toronto W09 - - - - - - - - Toronto W10 1 $136,000 $136,000 $136,000 - - 97% 47 Toronto Central 1 $2,320,000 $2,320,000 $2,320,000 1 - 101% 40 Toronto C01 - - - - - - - - Toronto C02 - - - - - - - - Toronto C03 - - - - - - - - Toronto C04 - - - - - - - - Toronto C06 - - - - - - - - Toronto C07 - - - - - - - - Toronto C08 - - - - - - - - Toronto C09 - - - - - - - - Toronto C10 - - - - - - - - Toronto C11 - - - - - - - - Toronto C12 1 $2,320,000 $2,320,000 $2,320,000 1 - 101% 40 Toronto C13 - - - - - - - - Toronto C14 - - - - - - - - Toronto C15 - - - - - - - - Toronto East - - - - - - - - Toronto E01 - - - - - - - - Toronto E02 - - - - - - - - Toronto E03 - - - - - - - - Toronto E04 - - - - - - - - Toronto E05 - - - - - - - - Toronto E06 - - - - - - - - Toronto E07 - - - - - - - - Toronto E08 - - - - - - - - Toronto E09 - - - - - - - - Toronto E10 - - - - - - - - Toronto E11 - - - - - - - - SUMMARY OF EXISTING HOME TRANSACTIONS DETACHED CONDOMINIUM, SEPTEMBER 2014
- 23. Industrial Leasing Page 3 July 2010 Toronto Real Estate Board Market Watch, September 2014 23 ALL TREB AREAS Sales1 Dollar Volume1 Average Price1 Median Price1 New Listings2 Active Listings3 Avg. SP/LP4 Avg. DOM5 TREB Total 3- $999-,400 $333-,133 $249-,500 1-3 2-4 10-2% 12- 4 Halton Region - - - - - - - - Burlington - - - - - - - - Halton Hills - - - - - - - - Milton - - - - - - - - Oakville -- -- -- -- -- -- -- -- Peel Region - - - - - - - - Brampton - - - - - - - - Caledon - - - - - - - - Mississauga -- -- -- -- -- -- -- -- City of Toronto 3 $999,400 $333,133 $249,500 13 24 102% 124 - - - - - - - - York Region - - - - - - - - Aurora - - - - - - - - E. Gwillimbury - - - - - - - - Georgina - - - - - - - - King - - - - - - - - Markham - - - - - - - - Newmarket - - - - - - - - Richmond Hill - - - - - - - - Vaughan - - - - - - - - Whitchurch-Stouffville -- -- -- -- -- -- -- -- Durham Region - - - - - - - - Ajax - - - - - - - - Brock - - - - - - - - Clarington - - - - - - - - Oshawa - - - - - - - - Pickering - - - - - - - - Scugog - - - - - - - - Uxbridge - - - - - - - - Whitby -- -- -- -- -- -- -- -- Dufferin County - - - - - - - - Orangeville -- -- -- -- -- -- -- -- Simcoe County - - - - - - - - Adjala-Tosorontio - - - - - - - - Bradford West Gwillimbury - - - - - - - - Essa - - - - - - - - Innisfil - - - - - - - - New Tecumseth - - - - - - - - ! TURN PAGE FOR CITY OF TORONTO TABLES OR CLICK HERE: SUMMARY OF EXISTING HOME TRANSACTIONS CO-OWNERSHIP APARTMENT, SEPTEMBER 2014
- 24. Industrial Leasing Page 3 July 2010 Toronto Real Estate Board Market Watch, September 2014 24 CITY OF TORONTO MUNICIPAL BREAKDOWN Sales1 Dollar Volume1 Average Price1 Median Price1 New Listings2 Active Listings3 Avg. SP/LP4 Avg. DOM5 TREB Total 3 $999,400 $333,133 $249,500 13 24 102% 124 City of Toronto Total 3 $999,400 $333,133 $249,500 13 24 102% 124 Toronto West - - - - 3 7 - - Toronto W01 - - - - - - - - Toronto W02 - - - - - - - - Toronto W03 - - - - - - - - Toronto W04 - - - - - - - - Toronto W05 - - - - 2 6 - - Toronto W06 - - - - 1 1 - - Toronto W07 - - - - - - - - Toronto W08 - - - - - - - - Toronto W09 - - - - - - - - Toronto W10 - - - - - - - - Toronto Central 3 $999,400 $333,133 $249,500 10 16 102% 124 Toronto C01 - - - - - - - - Toronto C02 1 $249,500 $249,500 $249,500 1 2 98% 124 Toronto C03 - - - - - 2 - - Toronto C04 1 $524,900 $524,900 $524,900 3 5 107% 26 Toronto C06 - - - - - - - - Toronto C07 - - - - - - - - Toronto C08 - - - - 4 5 - - Toronto C09 - - - - - - - - Toronto C10 - - - - - - - - Toronto C11 - - - - - - - - Toronto C12 - - - - - - - - Toronto C13 - - - - - - - - Toronto C14 1 $225,000 $225,000 $225,000 1 1 94% 223 Toronto C15 - - - - 1 1 - - Toronto East - - - - - 1 - - Toronto E01 - - - - - - - - Toronto E02 - - - - - 1 - - Toronto E03 - - - - - - - - Toronto E04 - - - - - - - - Toronto E05 - - - - - - - - Toronto E06 - - - - - - - - Toronto E07 - - - - - - - - Toronto E08 - - - - - - - - Toronto E09 - - - - - - - - Toronto E10 - - - - - - - - Toronto E11 - - - - - - - - SUMMARY OF EXISTING HOME TRANSACTIONS CO-OWNERSHIP APARTMENT, SEPTEMBER 2014
- 25. Industrial Leasing Page 3 July 2010 Toronto Real Estate Board Market Watch, September 2014 25 FOCUS ON THE MLS® HOME PRICE INDEX INDEX AND BENCHMARK PRICE, SEPTEMBER 2014 ALL TREB AREAS Index Benchmark Yr./Yr. % Chg. Index Benchmark Yr./Yr. % Chg. Index Benchmark Yr./Yr. % Chg. Index Benchmark Yr./Yr. % Chg. Index Benchmark Yr./Yr. % Chg. TREB Total 168.3 $513,400 7.82% 170.0 $632,100 8.70% 175.1 $494,700 8.49% 164.3 $359,900 7.67% 155.8 $312,900 4.21% Halton Region 177.1 $580,900 7.40% 173.9 $644,900 7.15% 177.2 $459,900 7.00% 170.0 $336,500 8.21% - - - Burlington 181.2 $522,200 5.29% 176.9 $604,600 3.57% 180.2 $429,500 7.52% 179.7 $360,900 8.12% - - - Halton Hills 160.9 $468,500 4.68% 159.4 $510,000 3.51% 170.8 $420,700 5.50% 159.5 $287,600 6.26% - - - Milton 167.8 $470,600 6.27% 155.6 $542,000 5.42% 170.5 $425,700 6.30% - - - - - - Oakville 186.5 $688,000 8.62% 185.4 $768,400 8.74% 187.5 $507,500 7.88% 170.0 $375,500 8.14% - - - Peel Region 161.2 $440,900 6.83% 162.6 $550,400 7.04% 164.6 $420,000 7.65% 164.3 $340,000 5.86% 144.1 $248,000 4.12% Brampton 154.6 $394,400 7.21% 154.5 $451,500 6.63% 156.6 $368,900 7.41% 149.8 $278,300 8.95% 130.5 $204,200 5.33% Caledon 149.9 $534,100 3.88% 150.3 $551,700 3.87% 165.7 $409,700 6.08% - - - - - - Mississauga 167.4 $467,900 6.90% 174.5 $650,200 8.05% 174.0 $475,500 8.28% 169.0 $362,900 5.23% 146.7 $256,900 4.12% City of Toronto 170.7 $559,400 7.16% 177.4 $769,100 9.24% 183.8 $609,500 8.12% 169.4 $409,700 8.38% 158.2 $326,700 4.01% York Region 181.4 $622,500 10.21% 181.9 $714,600 9.91% 185.7 $538,000 10.80% 166.6 $424,700 9.10% 157.2 $341,500 5.36% Aurora 170.6 $549,300 7.63% 169.7 $630,500 7.68% 175.9 $455,300 8.85% 147.1 $372,600 2.87% 151.4 $314,600 2.92% E. Gwillimbury 159.2 $514,700 8.23% 159.9 $525,200 8.48% 166.1 $351,700 6.13% - - - - - - Georgina 157.1 $326,000 5.79% 162.2 $334,100 5.39% 171.4 $337,800 9.03% - - - - - - King 169.8 $719,800 9.48% 171.7 $724,500 9.78% - - - - - - - - - Markham 189.6 $653,100 13.19% 194.2 $798,600 13.77% 194.6 $579,500 14.81% 172.4 $428,300 12.09% 159.5 $368,900 3.71% Newmarket 163.8 $483,100 8.62% 161.3 $543,000 8.99% 169.4 $399,200 8.87% 167.1 $337,400 4.90% 154.8 $260,700 4.45% Richmond Hill 190.0 $687,900 9.26% 201.2 $852,400 10.19% 195.4 $591,900 9.28% 155.0 $438,300 5.80% 151.3 $315,100 2.58% Vaughan 177.9 $643,100 8.34% 169.9 $707,000 6.25% 181.1 $551,300 7.35% 177.1 $483,900 11.24% 160.5 $356,200 10.16% Whitchurch-Stouffville 183.5 $691,900 15.55% 183.0 $702,200 14.45% 163.4 $448,800 15.64% - - - - - - Durham Region 151.1 $355,500 9.02% 150.1 $391,400 8.85% 156.3 $313,000 9.61% 143.2 $235,400 10.49% 145.2 $259,800 6.06% Ajax 158.2 $390,900 8.80% 157.6 $422,100 9.07% 163.9 $352,500 8.33% 150.7 $275,400 12.30% 139.6 $237,000 3.95% Brock 131.9 $250,000 4.19% 132.4 $251,600 4.01% 141.5 $225,500 4.89% - - - - - - Clarington 145.1 $307,000 7.56% 141.2 $339,300 7.46% 148.8 $284,100 8.45% 157.5 $281,900 6.56% 146.7 $207,600 6.85% Oshawa 144.8 $277,100 8.55% 144.1 $306,800 8.26% 150.3 $251,700 9.07% 124.5 $166,600 9.31% 142.9 $171,000 3.63% Pickering 159.2 $430,700 9.19% 159.9 $500,200 9.22% 163.4 $380,900 9.59% 156.0 $281,400 11.51% 151.0 $295,700 8.09% Scugog 150.5 $390,600 9.14% 154.6 $398,100 8.72% 141.0 $295,100 11.73% - - - - - - Uxbridge 145.1 $443,700 7.56% 144.8 $448,500 6.24% 143.3 $351,600 9.98% - - - - - - Whitby 152.4 $397,600 10.60% 153.2 $440,100 10.69% 156.6 $345,500 12.18% 144.8 $265,500 11.13% 140.4 $273,900 4.70% Dufferin County 155.1 $355,500 6.38% 160.2 $365,000 6.80% 152.3 $285,500 4.46% - - - - - - Orangeville 155.1 $355,500 6.38% 160.2 $365,000 6.80% 152.3 $285,500 4.46% - - - - - - Simcoe County 149.8 $318,300 6.09% 146.2 $322,400 6.17% 153.4 $294,500 4.28% - - - - - - Adjala-Tosorontio 133.4 $420,100 9.08% 133.3 $420,300 9.08% - - - - - - - - - Bradford West Gwillimbury 163.3 $405,900 5.83% 147.3 $451,200 5.59% 166.3 $345,700 4.33% - - - - - - Essa 142.0 $322,000 1.94% 139.3 $344,600 2.43% 145.5 $247,900 1.32% - - - - - - Innisfil 152.3 $282,200 8.55% 153.1 $284,200 8.12% 161.0 $250,400 11.57% - - - - - - New Tecumseth 133.4 $308,100 1.60% 129.8 $334,300 1.33% 140.2 $268,200 1.67% - - - - - - Townhouse Apartment ! TURN PAGE FOR CITY OF TORONTO TABLES OR CLICK HERE: Composite Single-Family Detached Single-Family Attached CLICK HERE FOR MORE BACKGROUND INFORMATION ON THE MLS® HPI
- 26. Industrial Leasing Page 3 July 2010 Toronto Real Estate Board Market Watch, September 2014 26 FOCUS ON THE MLS® HOME PRICE INDEX INDEX AND BENCHMARK PRICE, SEPTEMBER 2014 CITY OF TORONTO Index Benchmark Yr./Yr. % Chg. Index Benchmark Yr./Yr. % Chg. Index Benchmark Yr./Yr. % Chg. Index Benchmark Yr./Yr. % Chg. Index Benchmark Yr./Yr. % Chg. TREB Total 168.3 $513,400 7.82% 170.0 $632,100 8.70% 175.1 $494,700 8.49% 164.3 $359,900 7.67% 155.8 $312,900 4.21% City of Toronto 170.7 $559,400 7.16% 177.4 $769,100 9.24% 183.8 $609,500 8.12% 169.4 $409,700 8.38% 158.2 $326,700 4.01% Toronto W01 164.3 $670,500 3.40% 166.7 $859,200 7.06% 176.4 $680,600 5.95% 209.2 $430,800 -1.18% 142.9 $333,400 1.06% Toronto W02 191.5 $690,700 4.82% 194.3 $797,500 6.99% 217.3 $665,600 5.43% 149.8 $413,000 6.70% 137.7 $572,300 64.12% Toronto W03 179.7 $464,100 7.99% 183.5 $499,000 8.64% 184.6 $472,900 6.40% - - - 139.3 $258,400 26.64% Toronto W04 158.7 $415,600 8.62% 164.8 $520,100 8.71% 159.2 $463,600 7.49% 140.5 $341,800 -1.47% 147.5 $217,300 17.72% Toronto W05 147.8 $351,900 5.05% 159.8 $532,700 4.99% 148.7 $434,900 4.79% 141.3 $232,600 3.21% 131.1 $172,200 5.73% Toronto W06 152.4 $442,400 5.39% 182.4 $578,900 8.38% 153.1 $464,200 4.51% 166.4 $490,300 10.64% 125.6 $310,700 1.70% Toronto W07 165.4 $704,900 7.47% 170.9 $738,600 6.95% 160.5 $658,100 7.72% 136.1 $500,300 10.02% 112.0 $454,200 2.85% Toronto W08 147.5 $600,100 5.43% 158.7 $830,100 6.01% 164.6 $618,300 5.11% 146.5 $358,100 8.44% 135.0 $271,800 5.88% Toronto W09 152.5 $391,900 5.03% 164.7 $616,200 5.31% 155.7 $440,700 9.34% 146.9 $372,600 2.94% 130.7 $167,600 1.71% Toronto W10 149.9 $347,900 8.00% 163.7 $481,700 8.27% 161.3 $438,300 9.21% 137.1 $247,000 8.90% 127.3 $194,400 4.60% Toronto C01 184.7 $458,100 2.84% 196.8 $694,700 5.07% 206.2 $715,400 5.58% 178.3 $535,100 6.64% 180.5 $375,700 1.80% Toronto C02 187.2 $888,800 9.73% 173.8 $1,377,600 10.42% 197.7 $1,040,300 11.38% 185.5 $867,500 16.16% 182.6 $509,200 8.30% Toronto C03 190.3 $979,400 8.13% 186.5 $1,124,000 8.24% 191.9 $710,400 5.56% - - - 194.8 $514,600 10.62% Toronto C04 167.1 $1,035,300 9.14% 171.6 $1,199,600 8.33% 171.5 $819,900 8.89% 156.1 $583,200 2.97% 145.7 $346,400 12.25% Toronto C06 180.6 $714,700 11.62% 185.6 $794,400 12.35% 159.2 $585,500 14.86% 150.4 $410,400 3.23% 177.0 $391,400 10.97% Toronto C07 167.6 $575,600 7.50% 195.6 $895,400 13.06% 166.9 $593,200 8.94% 143.3 $420,700 4.07% 146.6 $345,300 1.24% Toronto C08 171.1 $440,500 4.33% 152.7 $474,600 -1.36% 184.1 $762,000 10.37% 181.6 $550,700 0.39% 170.0 $375,000 3.79% Toronto C09 135.7 $1,007,700 7.78% 131.0 $1,645,600 14.01% 152.8 $1,243,400 13.19% 173.5 $895,600 13.03% 135.3 $448,300 1.05% Toronto C10 189.4 $738,800 5.93% 179.4 $1,100,900 13.62% 182.8 $902,800 12.70% 234.8 $538,400 15.49% 192.7 $461,700 2.12% Toronto C11 171.9 $616,000 17.74% 174.5 $1,168,300 15.03% 200.1 $878,000 15.33% 120.6 $192,400 4.06% 169.1 $240,700 20.27% Toronto C12 158.0 $1,354,100 8.15% 147.0 $1,579,800 7.46% 170.3 $735,900 5.19% 185.8 $629,400 22.00% 179.5 $564,600 3.76% Toronto C13 161.0 $594,000 10.12% 171.3 $917,800 11.31% 159.0 $510,100 8.61% 182.2 $518,800 26.70% 147.7 $292,200 7.57% Toronto C14 177.8 $604,200 6.85% 208.1 $1,129,000 13.53% 191.4 $933,700 5.22% 213.8 $722,400 0.33% 163.0 $409,900 4.02% Toronto C15 171.5 $573,400 8.48% 195.6 $916,900 11.77% 181.2 $591,300 12.62% 182.5 $449,600 7.92% 142.3 $332,600 2.74% Toronto E01 201.7 $626,400 8.21% 198.9 $670,100 8.69% 210.0 $658,900 9.60% 218.0 $440,800 2.73% 185.2 $439,300 3.41% Toronto E02 185.0 $688,200 6.44% 171.0 $753,100 6.48% 194.9 $650,000 7.80% 167.5 $559,900 1.95% 183.6 $485,900 7.49% Toronto E03 170.9 $526,400 7.62% 173.6 $583,200 7.96% 173.0 $563,400 8.40% - - - 136.6 $204,300 4.04% Toronto E04 175.0 $439,300 9.17% 181.2 $535,000 9.35% 173.1 $420,000 8.12% 174.8 $377,800 8.37% 172.2 $260,900 8.03% Toronto E05 168.6 $450,900 12.78% 189.3 $668,400 13.56% 185.4 $511,000 15.44% 172.3 $374,600 13.96% 142.4 $279,800 8.70% Toronto E06 183.5 $518,500 7.44% 184.4 $527,000 7.52% 190.3 $450,100 6.73% - - - 165.1 $364,100 8.91% Toronto E07 180.0 $443,700 11.25% 200.8 $657,200 14.61% 190.4 $497,700 13.94% 185.0 $400,000 16.72% 156.4 $267,800 7.34% Toronto E08 165.9 $406,600 8.86% 176.5 $551,000 7.43% 166.4 $425,900 11.01% 170.5 $345,200 9.51% 142.1 $226,900 12.69% Toronto E09 161.9 $390,900 8.66% 177.6 $505,400 11.84% 164.3 $403,200 10.19% 158.3 $291,700 10.70% 143.9 $269,900 3.67% Toronto E10 171.0 $484,100 8.30% 172.2 $551,200 7.69% 166.5 $433,100 5.25% 175.1 $306,700 11.10% 134.1 $216,100 11.29% Toronto E11 163.9 $361,300 13.03% 183.8 $510,400 13.11% 176.1 $399,600 10.69% 131.8 $259,000 15.41% 133.0 $198,500 9.11% Composite Single-Family Detached Single-Family Attached Townhouse Apartment CLICK HERE FOR MORE BACKGROUND INFORMATION ON THE MLS® HPI
- 27. Page 3 July 2010 Toronto Real Estate Board Market Watch, September 2014 27 YEAR SALES AVERAGE PRICE 2003 78,898 $293,067 2004 83,501 $315,231 2005 84,145 $335,907 2006 83,084 $351,941 2007 93,193 $376,236 2008 74,552 $379,347 2009 87,308 $395,460 2010 85,545 $431,276 2011 89,096 $465,014 2012 85,496 $497,130 2013 87,053 $522,963 January 4,230 $482,028 February 5,615 $509,447 March 7,536 $517,247 April 9,537 $524,823 May 9,945 $540,581 June 8,821 $529,614 July 8,367 $512,286 August 7,391 $501,677 September 7,257 $532,455 October 7,941 $539,286 November 6,355 $538,690 December 4,058 $520,189 Annual 87,053 $522,963 January 4,103 $526,965 February 5,696 $552,857 March 8,053 $557,969 April 9,663 $578,346 May 11,018 $584,925 June 10,138 $569,277 July 9,164 $550,960 August 7,579 $546,743 September 8,051 $573,676 October - - November - - December - - Year-to-Date 73,465 $563,813 HISTORIC ANNUAL STATISTICS1,6,7 2014 MONTHLY STATISTICS1,7 2013 MONTHLY STATISTICS1,7 *For historic annual sales and average price data over a longer time frame go to: http://www.torontorealestateboard.com/market_news/market_watch/histori c_stats/pdf/TREB_historic_statistics.pdf NOTES 8SNLR = Sales-to-New Listings Ratio. Calculated using a 12-month moving average (sales/new listings). 9Mos. Inv. = Months of Inventory. Calculated using a 12-month moving average (active listings/sales). 7Past monthly and year-to-date figures are revised on a monthly basis. 1Sales, dollar volume, average sale prices and median sale prices are based on firm transactions entered into the TorontoMLS® system between the first and last day of the month/period being reported. 2New listings entered into the TorontoMLS® system between the first and last day of the month/period being reported. 3Active listings at the end of the last day of the month/period being reported. 4Ratio of the average selling price to the average listing price for firm transactions entered into the TorontoMLS® system between the first and last day of the month/period being reported. 5Average number of days on the market for firm transactions entered into the TorontoMLS® system between the first and last day of the month/period being reported. 6Due to past changes to TREB's service area, caution should be exercised when making historical comparisons. Copyright® 2014 Toronto Real Estate Board