
Recommended
More Related Content
What's hot
What's hot (20)
Viewers also liked
Viewers also liked (20)
Similar to Climate change: changes in the cryosphere
Similar to Climate change: changes in the cryosphere (20)
More from cdenef
More from cdenef (15)
Recently uploaded
Recently uploaded (20)
Climate change: changes in the cryosphere
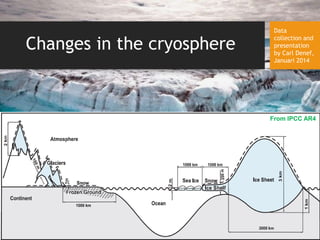
- 1. Changes in the cryosphere Components of the cryosphere Data collection and presentation by Carl Denef, Januari 2014 From IPCC AR4
- 2. Components of the cryosphere 2
- 3. Cryosphere in the Northern Hemisphere From IPCC AR5 Figure 4.1 (modified) Listen to P. Synclair Greenland ice sheet Ice sheet Sea ice Permadrost 3
- 4. Cryosphere in Southern Hemisphere From IPCC AR5 Figure 4.1 (modified) 4
- 5. Polar ice sheets and sea ice Ice sheets on land of the polar zones of the Earth (Greenland and Antarctica) are formed from snow that is compressed and converted to ice by gravity. The ice sheet incorporates glaciers that flow down and release ice at the front into the sea. Ice sheets grow by new snow during winter, while the loss is caused by increased surface temperature during the summer, by ice flow runoff and by calving into the surrounding ocean. For a climate in equilibrium average growth and loss are equal. Look at video of glacier calving Image from Wikipedia 5
- 6. Ice can melt and sublimate. Melt water on the ice sheet can run off directly into the ocean at the edges of the ice sheet and via ‘Moulins’ into the ice interior. A moulin or glacier mill is a roughly circular, vertical to nearly vertical well-like shaft within a glacier through which water enters from the surface. Moulins can reach the bottom of the glacier, hundreds of metres deep. Melting water can accumulate in ice lakes or exit the glacier at the base level and runoff into the sea. Flowing water makes ice to melt faster. The ice sheet itself flows down by gravity to the coastline and onto the ocean surface where it makes ice shelves. These are thick platforms of ice of about 100 to 1000 m thick floating on the sea. Shelves may break off (calving), releasing large pieces of ice into the sea (icebergs). Vast ice shelves sometimes abruptly collapse, releasing massive amounts of ice into the sea. A significant proportion of the ice volume is fast-moving ice or ice streams that move significantly faster than the rest of the ice sheet. For example, the Whillans Ice Stream moves about 0.5 m within approximately 30 minutes,[2] remains still for 12 hours, and then moves another 0.5 m and so on. Sea ice is frozen seawater. It may be attached to land or drift off-shore and move with currents and winds. Because ice is less dense than liquid water, sea ice floats on the ocean's surface. Sea ice covers about 7% of the Earth’s surface, or about 12% of the world’s oceans.[1][2] It may incorporate icebergs. 6
- 7. Source Source Ice stream Source Sea ice Source 7
- 8. Greenland topography Ice sheet Land Bed From IPCC AR5 Figure 4.18 8
- 9. Average daily Arctic temperature The Figure shows the daily mean temperature (in °K) north of the 80th northern parallel, as a function of the day of year for 2012. The blue line is the freezing point of water. The green line is the overall average of data between 1958 and 2008. The red line are the data for 2012. Source9
- 10. Arctic temperature by region and season Average January temperatures range from about −40 to 0 °C, and can drop below −50 °C. Average July temperatures range from about −10 to +10 °C, with some land areas occasionally exceeding 30 °C. The freezing point of sea water is about −2 °C.[1] So, there is considerable sea ice melting during the summer. In the right panel, the dark blue zone is Greenland. Average January temperature Average July temperature Source10
- 11. Loss of Greenland ice sheet mass and thickness The Figures underneath show ice sheet loss, as estimated by three different methods. Ice sheet loss is mainly in the coastal regions. From IPCC AR5 Figure 4.13 Changes in ice sheet surface elevation for 2003–2008 determined from ICESat laser altimetry Ice loss determined from gravimetry, in cm of water per year for the period 2003-2012 Mean surface mass balance for 1989–2004 11
- 12. Melting area of Greenland ice sheet expands The summer melt zone (area where melting is observed) has been expanding at an accelerating rate in recent years. Image source Greenland melt area Image source 12
- 13. Greenland ice sheet melting days increase in number Source: National Snow and Ice Data Centre13
- 14. Causes of Greenland ice loss According to IPCC AR5 WG1 ice sheet loss may be caused by the increased land and sea suface temperature above the freezing point of sea water, by accelerated discharge of ice in ice streams, by accelerated retreat of glaciers and by increased ice shelve calving. Abundant summer meltwater on the surface of the ice sheet forms moulins and large lakes. This water drains to the ice sheet bed, thus providing heat in deep ice layers and fastening further melting. Moreover, this process increases basal water pressure and reduces basal friction on the glaciers, resulting in increased ice flow speed and, hence, more ice loss into the sea. Even when it does not melt there, it will increase sea level. Surface melt that becomes runoff at the edges is a major contributor to mass loss from the periphery of the ice sheet Due to ocean warming, margin regions of ice sheets that are grounded below sea level most likely experience more rapid ice mass loss. Increased temperature in ocean waters beneath ice shelves increase melt rates of the shelves. Increased ice loss is in part due to strongly increased glacier retreat (melting, glacier flow and iceberg calving). The recent rapid retreat of Jakobshavn Glacier was most likely caused by the intrusion of warm ocean water beneath the floating ice tongue of 14
- 15. this glacier. The glacier seemed to be in balance from 1955-1985,[13] with a speed of around 20 m/day.[11] After 1997 it began to accelerate rapidly, reaching an average velocity of 34 m/day in the terminus region. It also thinned at a rate of up to 15 m/year and retreated 5 km in six years. In July 2012, the melt zone extended to 97 percent of the ice cover.[12] Ice core-based reconstruction studies showed that events such as this occur approximately every 150 years on average. The last time a melt this large happened was in 1889. This particular melt may be part of cyclical behavior, but it cannot be excluded that similar events will get more frequent[13] Look the video of the collapse of Ilulissat Glacier in Western Greenland Look at a video of water runoff in Greenland 15
- 16. According to Dr. C Zender black carbon (BC) is a significant contributor to Arctic ice-melt.[72] BC decreases the snow/ice albedo, leading to an increased warming trend. The radiative forcing induced by BC is presently of the order of 1 W/m2 at middle- and high-latitudes in the Northern Hemisphere and over the Arctic Ocean.[73] BC deposition on ice and snow increases surface melt of ice, and the meltwater in turn accelerates ice disintegration.[75] There are long-range pollution pathways to the Arctic during winter and spring,[Ref] causing haze containing BC, which increases surface temperature by 0.5 °C.[77] Albedo has been shown to have decreased in Greenland (see Figure on the right), consistent with the relative higher impact of global warming on Greenland. Decreased albedo leads to more sunlight absorbed by the snow, leading to further melting. Difference from average reflectivity in percent 16
- 17. Arctic sea ice extent steadily decreases Sea ice is frozen ocean water that melts each summer and refreezes each winter. September displays on average the lowest sea ice extent and Februari-March the largest. The image below shows Arctic sea ice on September 12th, 2013 with a yellow line identifying the 30-year average extent, which is much larger. Source 17
- 18. September sea ice has decreased with >30 % since 1979. Plots of decadal averages of daily sea ice extent in the Arctic (1979 to 1988 in red, 1989 to 1998 in blue, 1999 to 2008 in gold and 2009 to 2011 in black) From IPCC AR5 Figure 4.2 Months18
- 19. Arctic sea ice volume decreases Both season-dependent maximum and minimum sea ice volumes are steadily decreasing since 1990. From Wikipedia19
- 20. Arctic sea ice concentration decreases The sea ice concentration index gives the % of the arctic sea surface that is covered with ice. It is regionally uneven ,as shown in the figure (snapshot in August 2013). (Source:National Snow and Ice Data Center). 20
- 21. The Figure shows the trend in % change per decade. The trend is negative particularly above Alaska and East-Asia (Source:National Snow and Ice Data Center). 21
- 22. Sea ice concentration (IC) decreases unevenly. The trend is particularly strong above Alaska in the autumn and above N-Europe in the spring. The figure shows trends (1979–2011) in Autumn and Spring. From IPCC AR5 Figure 4.2 22
- 23. Arctic sea ice is thinning Image source 23
- 24. Arctic ice melts considerably faster than IPCC predicted in 2007 ! Ice melting is 50 years ahead of what the IPCC climate models (AR4/CMIP3 models) predicted for 2100 ! The record lowest sea ice extent was in 2012. The black lines in the Figure are the modelled data, the red line represents the observed data. Source 210024
- 25. Topography of Antarctica Antarctica consists of 3 main parts:1. The East Antarctic ice sheet, largely resting on ground above sea level, and therefore relatively stable; 2. The West Antarctic ice sheet, resting on ground that can extend up to more than 2,500 m below sea level, due to the weight of the ice, and therefore vulnerable to ocean-induced melting. 3. The Antarctic Peninsula ice sheet, a smaller land-based ice sheet. From IPCC AR5 Fig. 4.18 25
- 27. Antarctic ice sheet, shelves and glaciers The Antarctic ice sheet has been in existence for at least 40 million years. It covers about 98% of the Antarctic continent, an area of almost 14 million km2, and contains 26.5 million km3 of ice (26 million gigatons).[2] That is ~61 % of all fresh water on the Earth. Antarctic ice is over 4,200 m thick in some areas. If all Antarctic ice would melt, sea level would rise with 60-70 m. A total of 44 percent of the Antarctic coastline are ice shelves. Their aggregate area is 1,541,700 km² [1] and are about 100 to 1000 m thick. Antarctic ice shelves may calve icebergs that are over 80 kilometers long. Calving accounts for about half the mass lost from ice sheets. Presently, 10% of land area is covered with glaciers that flow and may calve ice. About 10% of the ice volume is fast-moving ice or ice streams that move significantly faster than the surrounding ice. Entire ice shelves or glaciers may suddenly collapse, over hours to days or weeks, releasing massive amounts of ice into the sea, where it drifts away and melts. That happened recently to the Larsen A and B shelve. Large Ice shelves distribution. Image from Ted Scambos, National Snow and Ice Data Center, University of Colorado, Boulder. Look at animation of glacier flow 27
- 28. Antarctic ice sheet losses Based on satellite altimetry, interferometry, and gravimetry data, it was estimated that between 1992 and 2011, the ice sheets of East Antarctica, West Antarctica, and the Antarctic Peninsula changed in mass by +14 ± 43, –65 ± 26, and –20 ± 14 gigatonnes per year, respectively. (Science 30 November 2012). IPCC AR5 comes to a similar conclusion from studies made by 10 different groups with satellite gravimetry, satellite altimetry and the mass balance method. Over the period 1992– 2012 there is “very high confidence that [ice] losses are mainly from the northern Antarctic Peninsula and the Amundsen Sea sector of West Antarctica, and high confidence that they result from the acceleration of outlet ” through fast-moving ice or ice stream. Ice flow can reach velocities of higher than 1 km/year. Satellite records and in situ observations from ocean buoys indicate warming of the Southern Ocean since the 1950s. The mean temperature of the Antarctic Circumpolar Current ranges from -1 to 5°C and studies suggest an ocean warming of 1°C could activate the natural process of basal melting of ice shelves by 10 m/year (IPCC AR4). Melting is due to the interaction between warmer ocean waters and the base of the shelves. Ice-shelf melting is the largest ablation process in Antarctica (Science, 19 July 2013). Basal melt of shelves was estimated to be 1325 ± 235 gigatons per year (Gt/year), while calving flux was 1089 ± 139 Gt/year. Note that shelves that melt no longer impede glacier flow off the continent, so that glacier flow will accelerate and lead to further ice loss. 28
- 29. Ice sheet velocity for 2007–2009 Ice loss as estimated from changes in ice sheet surface elevation for 2003–2008 determined by ICESat satellite altimetry Ice loss determined by satellite gravimetry, in cm of water per year for the period 2003-2012 Images from IPCC AR5 Figure 4.14 29
- 30. According to IPCC AR5, ice shelves are thinning in the Amundsen Sea region of West Antarctica . “There is high confidence that ice shelves round the Antarctic Peninsula continue a long-term trend of retreat and partial collapse that began decades ago.” Ice loss is also related to glacier retreat. Melted water pools increasingly cut through the surface of glaciers, which destabilize it and increase the likelihood of calving. This is believed to have played a role in the rapid disintegration of the Larsen B ice shelf, which crumbled over about six weeks in 2002. Massive amounts of ice were released into the ocean, contributing substantially to sea level rise. Moreover, glaciers, melting from contact with tide water, may destabilize and collapse. 30
- 31. Super warming in Antarctic Peninsula The Antarctic Peninsula is one of the most warming areas of the World. Seven ice shelves have retreated or disintegrated in the last two decades.[20] Every ice front on the southern half of the peninsula experienced a retreat between 1947 and 2009.[24] Glaciers on the Peninsula are also increasing their flow rate.[25] The present warming, however, is not unprecedented. A recent paper in Nature (Nature 489, 141–144, 2012) reports an Antarctic Peninsula ice core study on the temperature trends during the entire Holocene period. About 2,000 years ago average temperatures were as warm as at present. From about 12000 to 9500 years ago it was considerably warmer than today. Another relatively warm period similar to modern-day levels was from about 9,200 to 2,500 years ago. There was a pronounced cooling from 2,500 to 600 years ago, Since then there was again warming over the last 600 years, the rate of which became steeper during the last 100 years (1.56 °C). Although this steep rise is not unprecedented, it is highly unusual in the context of natural variability in the Antarctic Peninsula. Importantly, during the cooling period a permanent ice shelf was established (based on marine sediments studies) on the eastern part of the Peninsula, while it was not conspicuous during the warm periods. This observation suggests that present warming may drive the partial collapse of ice shelves that began decades ago, into a full collapse, which would seriously fasten sea level rise. 31
- 32. Antarctic Peninsula From Nature 489, 141–144, 2012 32
- 33. Antarctica ice shelf calving The photo underneath shows the Filchner Ice Shelf, on the Antarctic coast facing the Atlantic Ocean, as taken by satellites. It is the largest ice shelf by volume on Earth. In the austral winter of 1986, its front edge broke off, forming three large icebergs. Images taken by Landsat 1 (left) and Landsat 5 (right). Source: Earthshots: Satellite Images of Environmental Change, U.S. Geological Survey. 33
- 34. Antarctic sea ice concentration is only slightly affected Sea ice concentration (IC) is slightly decreasing West of the Antarctic Peninsula, and in the sea of West Antarctica, consistent with the high warming rate in this location. The Figure shows the Ice concentration trends (1979–2011) in winter, spring, summer and autumn. From IPCC AR5 Figure 4.7 However, there is no change in total Antarctic sea ice extent (see IPCC AR5 Figure 4.7). 34
- 35. Moutain Glaciers Glaciers store about 75% of the world's freshwater. Total glacier area covers over 15,000,000 km2. During the last Ice Age, glaciers covered 32% of the global land area. North America's longest glacier is the Bering Glacier in Alaska, measuring 204 kilometers long. When glacier ice is white, it usually means that there are many tiny air bubbles still in the ice. Years of compression gradually make the ice denser over time, forcing out the tiny air pockets. When glacier ice becomes extremely dense, it gets a blue color (the ice absorbs all other colors in the spectrum and reflects primarily blue). 35
- 36. Glacier mass loss The left Figure shows the cumulative change in mass balance of a set of "reference" glaciers worldwide beginning in 1945. The line on the graph represents the average of all the glaciers that were measured. Negative values in later years indicate a net loss of ice and snow compared with the base year of 1945. Measurements are in meters of water equivalent, which represent changes in the average thickness of a glacier. The small chart below shows how many glaciers were measured in each year. The right Figure shows the evolution of reference glaciers in the U.S. Read more from EPA, Data sources: WGMS, 2011, 2012 (World Glacier Monitoring Service 36
- 37. Glaciers area loss Mean annual area for 14 glacier regions show decrease without exception. Each line in the Figure refers to the observed relative area loss from a specific publication and its length is related to the period used for averaging. From IPCC AR5 Figure 4.10 37
- 38. Photographs of glacier area loss Shrinkage of the Bear Glacier, Alaska, from 1980 to 2011. Left image taken by Landsat 3. Center image taken by Landsat 4. Right image taken by Landsat 7. Source: U.S. Geological Survey (USGS) Landsat Missions Gallery The Cotopaxi Glacier, Equador (5,897 m) . The glacier has considerable economic, social, and environmental importance. Its melt waters provide fresh water and hydroelectric power to Ecuador’s capital city of Quito. The ice mass decreased 30 % between 1956 and 1976 and another 38.5 % between 1976 and 2006. Source: United Nations Environment Programme (UNEP). From Latin America and the Caribbean Atlas of our Changing Environment (2010). June 5, 1980 May 16, 1989 May 13, 2011 23 March 1986 5 Feb 2007 38
- 39. Glacier length loss The Figure shows the decrease of cumulative glacier length as compiled from long-term in situ measurements in various regions. The lines represent individual glaciers. From IPCC AR5 Figure 4.9 39
- 40. Photographs of mountain ice and snow loss Mount Kilimanjaro in Tanzania. Images taken by the NASA/USGS Landsat satellite. Credit: Jim Williams, NASA GSFC Scientific Visualization Studio, and the Landsat 7 Science Team. The Matterhorn mountain, located in the Alps. 1960 photo taken by Bradford Washburn; 2005 photo taken by David Arnold. Source: Panopticon Gallery, Boston, MA. 16 Aug 1960 18 Aug 2005 February 17, 1993 February 21, 2000 40
- 41. Lake ice loss This figure (from EPA, Data source: NSIDC, 2011 (National Snow and Ice Data Center) ) displays the duration (in days) of ice cover for eight U.S. lakes. They freeze later and thaw earlier than they used to do. Read more 41
- 42. Land snow cover extent Snow cover tends to decrease over the globe, which means that winter albedo will be weaker, favoring warming. The left Figure shows the trend in March-April Northern Hemisphere snow cover extent (SCE) (circles) over the period of available data, and in June snow cover extent (x’s) from satellite data alone. The mean and 95% confidence intervals are given. The right Figure shows that the decrease in snow cover highly correlates with the temperature anomaly between 40° and 60° latitude. From IPCC AR5 Figure 4.19 and 4.20 42
- 43. Permafrost Permafrost is defined as soil that is either frozen for 2 or more years or permanently. Permafrost is mainly found in the Arctic region (land and sea bottom) and contains carbon deposits. There are two variants in carbon deposition: old organic carbon deposits and methane hydrates occurring in deep permafrost soils, ocean shelves, shelf slopes and deeper ocean bottom sediments. Permafrost organic carbon deposits store twice the amount of atmospheric carbon. Permafrost is covered by a surface 'active layer', which thaws during summer, allowing microorganisms to decompose the organic carbon, generating CO2 and, when oxygen is limited, also methane. If spring and summer temperature rises, the active layer will thicken, making more organic carbon available for microbial decomposition. Methane hydrates consist of methane and water clusters, which are only stable at low temperature and high pressure. On land and in the ocean, most of these hydrates originate from marine or terrestrial organic carbon, decomposed in the absence of oxygen to methane, and then trapped as water clusters at low temperatures and high pressure. Warming and/or changes in pressure could destabilize the hydrates, releasing their methane to the ocean. A fraction of that methane might be outgassed to the atmosphere. The amount of methane hydrates is more than 10 times greater than that of present atmospheric methane. Thus, thawing of permafrost represents a serious threat for further warming. 43
- 44. Seasonally frozen ground depth anomalies Thickness of seasonally frozen ground in Russia/Siberia is decreasing (From, Frauenfeld and Zhang, 2011). IPCC AR5 Figure 4.24 44
- 45. Permafrost ground temperature Mean annual ground temperatures at depths between 10 and 20 m increases, as measured in boreholes throughout the circumpolar northern permafrost regions (Romanovsky et al., 2010). Measurement depth is 10 m for Russian boreholes, 15 m for Gulkana and Oldman, and 20 m for all other boreholes. From IPCC AR5 Figure 4.22 45
- 46. Permafrost retreat (Berkeley Earth study) Regions colored in red are regions where the annual air temperature averaged ≤0 °C for the period 1901-1910 but not anymore for the period 2001-2010. Areas in white remain permafrost in 2001-2010. From Berkeley Earth46
- 47. Summary as published by IPCC AR5 WG1 Ch. 4 Text and Figure from IPCC AR5 Figure 4.25 Summary 47
- 48. VIEW OTHER SLIDE SHOWS 48