SlideShare a Scribd company logo
1 of 28
Download to read offline
CONGRESS OF THE UNITED STATES
                                                CONGRESSIONAL BUDGET OFFICE


                                                CBO
                                                         CBO’s 2011
                                                         Long-Term
                                                       Projections for
                                                       Social Security:
                                                         Additional
                                                        Information
     Percentage of GDP
9
                           Actual   Projected

8                                                           Outlays

7


6


5


4                                                                   Tax Revenues


3


2


1


0
    1985      1995       2005        2015       2025         2035         2045     2055   2065   2075   2085

                                                        AUGUST 2011
Pub. No. 4321
CBO
CBO’s 2011 Long-Term Projections for
Social Security: Additional Information
                             August 2011


     The Congress of the United States O Congressional Budget Office
Notes and Definitions
      Unless otherwise noted, all years referred to are calendar years. Numbers in the text and tables may not add up to totals because of
      rounding. Supplemental data are posted on CBO’s Web site (www.cbo.gov).

      For 2011, the Social Security payroll tax on employees was reduced by 2 percentage points; the reduction in Social Security tax
      revenues is being made up by reimbursements from the Treasury’s general fund. In this report, Social Security tax revenues include
      those reimbursements.

      80 percent range of uncertainty: A range of uncertainty based on a distribution of 500 simulations from CBO’s long-term model.
      Outcomes were above the range in 10 percent of the simulations, below the range in 10 percent, and within the range in 80 percent.

      Median: The middle of the distribution. When the median outcome for a group of people (defined in this document by birth cohort and
      lifetime earnings category) is shown, the value is lower for half of the people in that group and higher for half of the group.

      Present value: A single number that expresses a flow of current and future income, or payments, in terms of an equivalent lump sum
      received or paid today.

      Cost rate: The present value of outlays for a period, plus the present value of a year’s worth of benefits as a reserve at the end of the
      period, divided by the present value of the stream of gross domestic product (or taxable payroll) over the same period.

      Income rate: The present value of tax revenues for a period, plus the trust funds’ initial balance, divided by the present value of the
      stream of gross domestic product (or taxable payroll) over the same period.

      Actuarial balance: The difference between the income rate and the cost rate.

      Scheduled benefits: Full benefits as calculated under current law, regardless of the amounts available in the Social Security trust funds.

      Payable benefits: Benefits as calculated under current law, reduced as necessary to make outlays equal the Social Security system’s
      revenues. Upon exhaustion of the Social Security trust funds, the Social Security Administration would reduce all scheduled benefits
      such that outlays from the funds would equal revenues flowing into the funds.

      Replacement rate: Annual benefits as a percentage of annual lifetime earnings.

CBO
Preface


      T      his Congressional Budget Office (CBO) publication provides additional information about long-term projections
      of the Social Security program’s finances that were included in CBO’s 2011 Long-Term Budget Outlook (June 2011).
      Those projections, which cover the 75-year period spanning 2011 to 2085, and the additional information presented in
      this document update projections CBO prepared last year and reported in CBO’s 2010 Long-Term Projections for Social
      Security: Additional Information.

      The analysis was prepared by Noah Meyerson, Charles Pineles-Mark, Jonathan Schwabish, Michael Simpson, and
      Julie Topoleski of CBO’s Long-Term Modeling Group under the supervision of Joyce Manchester.

      John Skeen edited the document, and Kate Kelly proofread it. Maureen Costantino designed the cover, and
      Jeanine Rees prepared the document for publication. Monte Ruffin produced the initial printed copies, and
      Linda Schimmel handled the print distribution. The report is available on the agency’s Web site (www.cbo.gov).


                                                            Douglas W. Elmendorf
                                                            Director

      August 2011


CBO
List of Exhibits

      Exhibit                                                                                                                                      Page
      System Finances
          1.    Social Security Tax Revenues and Outlays, with Scheduled Benefits (Figure)                                                            6

          2.    Social Security Tax Revenues and Outlays, with Scheduled Benefits (Table)                                                             7

          3.    Percentage of Simulations in Which Social Security Outlays Exceed Tax Revenues by Specified Percentages, with Scheduled Benefits      8

          4.    Social Security Tax Revenues and Outlays, with Scheduled and Payable Benefits                                                         9

          5.    Summarized Financial Measures for Social Security Under the Extended-Baseline Scenario, with Scheduled Benefits                      10

          6.    Summarized Financial Measures for Social Security Under the Alternative Fiscal Scenario, with Scheduled Benefits                     11

          7.    Trust Fund Ratio, with Scheduled Benefits                                                                                            12

          8.    Percentage of Simulations That Show the Social Security Trust Funds Exhausted by a Particular Year                                   13

      Distribution of Benefits
          9.    Median Initial Benefits for Retired Workers, with Scheduled and Payable Benefits                                                     15

         10.    Median Initial Replacement Rates for Retired Workers, with Scheduled and Payable Benefits                                            16

         11.    Median Present Value of Lifetime Benefits for Retired Workers, with Scheduled and Payable Benefits                                   17

         12.    Median Benefits and Initial Replacement Rates for Disabled Workers, with Scheduled and Payable Benefits                              18

         13.    Potential Range of Lifetime Social Security Payroll Taxes                                                                            19

         14.    Potential Range of Lifetime Social Security Benefits, with Scheduled and Payable Benefits                                            20

         15.    Potential Range of Lifetime Benefit-to-Tax Ratios, with Scheduled and Payable Benefits                                               21

         16.    Percentage of Simulations in Which Payable Benefits Exceed Specified Percentages of Scheduled Benefits                               22
CBO
CBO’s 2011 Long-Term Projections for
                                                    Social Security: Additional Information

      Social Security is the federal government’s largest               employed workers, who pay the entire 12.4 percent               In calendar year 2010, for the first time since the
      single program.1 About 56 million people will                     tax on earnings themselves).2 The payroll tax                   enactment of the Social Security Amendments of
      receive Social Security benefits this year, the                   applies only to taxable earnings—earnings up to                 1983, annual outlays for the program exceeded
      Congressional Budget Office (CBO) estimates.                      a maximum annual amount ($106,800 in 2011).                     annual revenues excluding interest credited to
      About 69 percent are retired workers, their                       Some Social Security benefits also are subject to               the trust funds. CBO projects that the gap will
      spouses, and children, and another 12 percent are                 taxation: This year, about 3 percent of Social                  continue: Over the next five years, outlays will be
      survivors of deceased workers; all of those benefi-               Security’s tax revenues will come from the income               about 5 percent greater than such revenues.
      ciaries receive payments through Old-Age and                      taxes that higher-income beneficiaries pay on                   However, as more members of the baby-boom
      Survivors Insurance (OASI). The other 19 percent                  their Social Security benefits. Tax revenues credited           generation (that is, people born between 1946
      are disabled workers or their spouses and children;               to the program will total $687 billion in fiscal                and 1964) enter retirement, outlays will increase
      they receive Disability Insurance (DI) benefits.                  year 2011.                                                      relative to the size of the economy, whereas tax rev-
      CBO projects that in fiscal year 2011, Social                                                                                     enues will remain at an almost constant share of
      Security’s outlays will total $733 billion, one-fifth             Revenues from taxes, along with intragovern-                    the economy. As a result, the shortfall will begin to
      of the federal budget; OASI payments will account                 mental interest payments, are credited to Social                grow around 2017.
      for about 82 percent of those outlays, and DI                     Security’s two trust funds—one for OASI and one
      payments, about 18 percent.                                       for DI—and the program’s benefits and adminis-                  CBO projects that the DI trust fund will be
                                                                        trative costs are paid from those funds. Legally, the           exhausted in 2017 and that the OASI trust fund
      Social Security has two primary sources of tax reve-              funds are separate, but they often are described col-           will be exhausted in 2040. Once a trust fund’s bal-
      nues: payroll taxes and income taxes on benefits.                 lectively as the OASDI trust funds. In a given year,            ance has fallen to zero and current revenues are
      This year, roughly 97 percent of tax revenues dedi-               the sum of receipts to a fund along with the inter-             insufficient to cover the benefits that are specified
      cated to Social Security will be collected from a                 est that is credited on previous balances, minus                in law, the corresponding program will be unable
      payroll tax of 12.4 percent that is levied on earn-               spending for benefits and administrative costs,                 to pay full benefits without changes in law. The DI
      ings and split evenly between workers and their                   constitutes that fund’s surplus or deficit.                     trust fund came close to exhaustion in 1994, but
      employers at 6.2 percent apiece (except for self-                                                                                 that outcome was prevented by legislation that
                                                                                                                                        redirected revenues from the OASI trust fund to
                                                                        2. The workers’ portion of the payroll tax was reduced by       the DI trust fund. In part because of that experi-
      1. For a description of the Social Security program, see             2 percentage points for 2011 (as was the tax on the self-
                                                                                                                                        ence, it is a common analytical convention to
         Congressional Budget Office, Social Security Policy Options       employed), and the reduction in tax revenues is being
         (July 2010), “An Overview of Social Security,” pp. 1–4.           made up by reimbursements from the Treasury’s general        consider the DI and OASI trust funds as com-
         Social Security’s financing and trust funds are discussed on      fund. In this report, Social Security tax revenues include   bined. CBO projects that, if legislation to shift
         pp. 3–5 of that study.                                            those reimbursements.                                        resources from the OASI trust fund to the DI trust


CBO
INTRODUCTION                                                                                          CBO’S 2011 LONG-TERM PROJECTIONS FOR SOCIAL SECURITY: ADDITIONAL INFORMATION       2


      fund was enacted, the combined OASDI trust              The first, CBO’s extended-baseline scenario,                    fund balances would remain essentially at zero.
      funds would be exhausted in 2038.                       adheres closely to current law. For example, that               When presenting projections of Social Security’s
                                                              scenario reflects the assumption that the cuts in               finances, CBO generally focuses on scheduled
      The amount of Social Security taxes paid by vari-       individual income taxes enacted since 2001 and                  benefits because, by definition, the system would
      ous groups of people differs, as do the benefits that   most recently extended in 2010 expire as scheduled              be fully financed if payable benefits were all that
      different groups receive. For example, people with      in 2012 and 2013. CBO also has developed an                     was disbursed.
      higher earnings pay more in Social Security payroll     alternative fiscal scenario, which incorporates sev-
      taxes than do lower-earning participants, and they      eral changes to current law that are widely expected            Quantifying Uncertainty
      also receive larger benefits (although not propor-      to occur or that would modify some provisions of                To quantify the amount of uncertainty in its Social
      tionately larger). Because of the progressive nature    law that might be difficult to sustain for a long               Security projections, CBO created a distribution
      of Social Security’s benefit formula, replacement       period. Unless otherwise noted, the projections                 of outcomes from 500 simulations using its long-
      rates—annual benefits as a percentage of annual         presented in this analysis are based on the assump-             term model. In those simulations, the assumed
      lifetime earnings—are lower, on average, for work-      tions of the extended-baseline scenario. In that                values for most of the key demographic and eco-
      ers who have had higher earnings. As another            scenario, income taxes, including the income taxes              nomic factors that underlie the analysis—for
      example, the amount of taxes paid and benefits          on Social Security benefits that are credited to the            example, fertility and mortality rates, interest rates,
      received will be greater for people in later birth      trust funds, are higher than they are in the alterna-           and the rate of growth of productivity—were var-
      cohorts because they typically will have higher         tive fiscal scenario.                                           ied on the basis of historical patterns of variation.4
      earnings over a lifetime, even after an adjustment
                                                                                                                              Several of the exhibits in this publication show the
      for inflation, CBO projects. However, initial           Scheduled and Payable Benefits                                  simulations’ 80 percent range of uncertainty: That
      replacement rates will be slightly lower, on average,
                                                              CBO prepares two types of benefit projections.                  is, in 80 percent of the 500 simulations, the value
      for people in later birth groups because their full
                                                              Benefits as calculated under the Social Security                in question fell within the range shown; in 10 per-
      retirement age (the age at which they can receive
                                                              Act, regardless of the balances in the trust funds,             cent of the simulations, the values were above that
      unreduced retirement benefits) will be higher. The
                                                              are called scheduled benefits. However, the Social              range; and in 10 percent they were below. Long-
      increase in that age is equivalent to a reduction in
                                                              Security Administration has no legal authority to               term projections are necessarily uncertain, and that
      benefits at any age at which benefits are claimed.
                                                              pay scheduled benefits if their amounts exceed the              uncertainty is illustrated in this publication; never-
                                                              balances in the trust funds. Therefore, if the trust            theless, the general conclusions of this analysis are
                                                              funds became exhausted, payments to current and                 unchanged under a variety of assumptions.
      About This Analysis                                     new beneficiaries would need to be reduced to
      CBO regularly prepares long-term projections of         make the outlays from the funds equal the revenues              System Finances
      revenues and outlays for the Social Security pro-       flowing into the funds.3 Benefits thus reduced are              The first part of this publication (Exhibits 1
      gram. The most recent projections, for the 75 years     called payable benefits. In such a case, all receipts           through 8) examines Social Security’s financial
      from 2011 through 2085, were published in Chap-         to the trust funds would be used, and the trust
      ter 4 of CBO’s 2011 Long-Term Budget Outlook
      (June 2011). This publication presents additional                                                                       4. For more information, see Congressional Budget Office,
      information about those projections.                    3. See Christine Scott, Social Security: What Would Happen If      Quantifying Uncertainty in the Analysis of Long-Term Social
                                                                 the Trust Funds Ran Out? Report for Congress RL33514            Security Projections, Background Paper (November 2005).
      The budget projections published in CBO’s 2011             (Congressional Research Service, updated August 20,             The methodology used here differs slightly from the
      Long-Term Budget Outlook involved two scenarios:           2009).                                                          techniques described in that report.


CBO
INTRODUCTION                                                                                                    CBO’S 2011 LONG-TERM PROJECTIONS FOR SOCIAL SECURITY: ADDITIONAL INFORMATION   3


      status from several vantage points. The fullest per-               estimates for individuals; household status is used            Changes in CBO’s Long-Term
      spective is provided by projected streams of annual                only to place people into earnings groups.
      revenues and outlays. A more succinct analysis is                                                                                 Social Security Projections Since
      given by measures that summarize the annual                        In this part of the analysis, benefits are calculated          2010
      streams in a single number. The system’s finances                  net of income taxes paid on benefits by higher-                The shortfalls for Social Security that CBO is cur-
      are also described by projecting what is called the                income recipients and credited to the Social                   rently projecting are marginally smaller than those
      trust fund ratio, the amount in the trust funds at                 Security trust funds.6 Median values are estimated             projected in CBO’s 2010 Long-Term Projections for
      the beginning of a year in proportion to the outlays               for each group: Estimates for half of the people in            Social Security: Additional Information (October
      in that year.                                                      the group are lower, and estimates for half are                2010). The 75-year imbalance is almost
                                                                         higher.                                                        unchanged. It has decreased from 1.63 percent
      Distribution of Benefits                                           Most retired and disabled workers receive Social               to 1.58 percent of taxable payroll under the
      In the second part (Exhibits 9 through 16),                        Security benefits on the basis of their own work               extended-baseline scenario (see Exhibit 5), and
      CBO examines the program’s effects on people by                    history. This publication first presents measures of           from 2.06 percent to 2.00 percent of taxable pay-
      grouping Social Security participants by various                   those benefits that do not include benefits received           roll under the alternative fiscal scenario (see
      characteristics and presenting the average taxes and               by dependents or survivors who are entitled to                 Exhibit 6).
      benefits for those groups. In its analysis, CBO                    them on the basis of another person’s work history.
      divided people into groups by the decade in which                                                                                 When measured as a share of taxable payroll, long-
                                                                         Then, for a more comprehensive perspective on the              term tax revenues and outlays are both slightly
      they were born and by the quintile of their lifetime               distribution of Social Security benefits, this analy-
      household earnings.5 For example, one 10-year                                                                                     lower than those projected in 2010. The 75-year
                                                                         sis presents measures of the total amount of Social            income rate—a measure of Social Security’s tax
      cohort consists of people born in the 1940s, and                   Security payroll taxes that each participant pays
      the top fifth of earners constitutes the highest earn-                                                                            revenues—is about 0.4 percent lower under both
                                                                         over his or her lifetime as well as the total Social           scenarios because revenues from income taxes on
      ings quintile. CBO’s modeling approach produces                    Security benefits—including payments received as               benefits are projected to be slightly lower. The
                                                                         a worker’s dependent or as a survivor—that each                75-year cost rate—a measure of outlays—is about
                                                                         receives over a lifetime.                                      0.7 percent lower. Outlays are a slightly higher
      5. Each person who lives at least to age 45 is ranked by life-
                                                                                                                                        share of taxable payroll over the next decade
         time household earnings. Lifetime earnings for someone
         who is single in all years equals the present value of his or                                                                  because of near-term economic weakness, but they
         her real (inflation-adjusted) earnings over a lifetime. In                                                                     are lower after 2025, primarily because CBO now
         any year that a person is married, the earnings measure is a                                                                   assumes higher immigration rates and projects
         function of his or her earnings plus those of his or her                                                                       slightly faster growth in real (inflation-adjusted)
         spouse (adjusted for economies of scale in household
                                                                                                                                        wages than it did in 2010.7
         consumption). A person’s lifetime earnings consist of the
         present value of those annual amounts. To compute pres-
         ent values in Social Security analyses, CBO uses a real
         discount rate of 3.0 percent, which equals the long-term        6. Benefits are not reduced by the portion of those income     7. See Congressional Budget Office, CBO’s 2011 Long-Term
         rate used to compute interest for the Social Security trust        taxes that is credited to Medicare’s Hospital Insurance        Budget Outlook (June 2011), Appendix A, “Changes in
         funds.                                                             Trust Fund.                                                    CBO’s Long-Term Projections Since June 2010.”


CBO
INTRODUCTION                                                                                        CBO’S 2011 LONG-TERM PROJECTIONS FOR SOCIAL SECURITY: ADDITIONAL INFORMATION      4


      When measured as a share of gross domestic prod-           Related CBO Analyses                                           in CBO’s Long-Term Model: An Overview,
      uct (GDP), however, the projections of the income                                                                         Background Paper (June 2009).
                                                                 Further information about Social Security and
      rate and the cost rate are slightly higher than they
                                                                 CBO’s projections is available in other CBO                    For an explanation of the values used for
      were in last year’s report. Social Security’s taxable                                                                 B
                                                                 publications:                                                  the demographic and economic variables
      payroll is a larger share of GDP in this year’s report
      because CBO’s projection of the share of compen-           B   Various approaches to changing the program                 underlying the projections, see “CBO’s Long-
      sation that workers receive as wages is higher than            are presented in Social Security Policy Options            Term Economic Benchmark” in CBO’s 2011
      it was last year. (The change stems from a revision            (July 2010).                                               Long-Term Budget Outlook, pp. 22–26. (The
      to CBO’s estimate of how people will respond to                                                                           projections are based on the demographic
      the excise tax on certain employment-based health          B   The current long-term projections are consis-              assumptions of the 2010 report of the Social
      insurance plans that was established by the March              tent with the 10-year baseline CBO published               Security trustees, except for the assumptions
      2010 health care legislation.)8 The 75-year imbal-             in An Analysis of the President’s Budgetary                about immigration, which are CBO’s.)9
      ance measured as a share of GDP is marginally less             Proposals for Fiscal Year 2012 (April 2011).
      than was projected in 2010 (just as it is when                 (Data in that report and in CBO’s 2011 Long-           B   For an “infographic” summarizing some of
      measured as a share of taxable payroll). Under the             Term Budget Outlook are generally presented for            CBO’s projections and providing background
      extended-baseline scenario, it has decreased from              fiscal years; this analysis and Social Security            information, see CBO’s Long-Term Projections:
      0.60 percent of GDP to 0.58 percent, and under                 Policy Options use calendar year data.)                    Social Security (August 2011).
      the alternative fiscal scenario, it has decreased from
                                                                     The current projections update those in CBO’s          B   Numerous other aspects of the program are
      0.75 percent to 0.74 percent.                              B
                                                                     2010 Long-Term Projections for Social Security:            addressed in various publications available from
                                                                     Additional Information. Differences in the two             CBO’s Web site.
                                                                     sets of projections are the result of newly avail-
                                                                     able programmatic and economic data, updated
                                                                     assumptions about future economic trends, and          9. See Social Security Administration, The 2010 Annual
                                                                     improvements in models.                                   Report of the Board of Trustees of the Federal Old-Age and
                                                                                                                               Survivors Insurance and Federal Disability Insurance Trust
      8. See Congressional Budget Office, CBO’s 2011 Long-Term   B   The methodology used to develop the                       Funds (August 9, 2010), www.ssa.gov/oact/TR/2010/
         Budget Outlook, p. 74.                                      projections in this publication is described              tr2010.pdf.


CBO
System Finances


CBO
SYSTEM FINANCES                                                                                  CBO’S 2011 LONG-TERM PROJECTIONS FOR SOCIAL SECURITY: ADDITIONAL INFORMATION   6


      Exhibit 1.
                                                                                                                            In 2010, Social Security’s total outlays (benefits
      Social Security Tax Revenues and Outlays, with Scheduled Benefits                                                     plus administrative costs) equaled 4.9 percent of
                                                                                                                            the country’s gross domestic product (GDP); tax
      (Percentage of gross domestic product)                                                                                revenues dedicated to the program equaled 4.6 per-
      9
                                                                                                                            cent of GDP. Most of the program’s tax revenues
                                Actual   Projected                                                                          come from Social Security payroll taxes, although a
      8                                                      Outlaysb                                                       small portion comes from income taxes on benefits
                                                                                                                            paid to higher-income beneficiaries. In addition to
      7                                                                                                                     those tax revenues, the trust funds are credited with
               Tax Revenuesa
      6
                                                                                                                            interest.

                                                                                                                            During the next few decades, the number of benefi-
      5
                                                                                                                            ciaries will grow as the baby-boom generation ages,
      4                                                                                                                     and by 2035, scheduled spending will climb to
                                                            Tax Revenuesa
                                                                                                                            6.1 percent of GDP, CBO estimates. Over the
      3         Outlaysb                                                                                                    ensuing decade, spending will decline slightly, rela-
                                                                                                                            tive to the size of the economy, as people in the
      2
                                                                                                                            baby-boom generation die. Demographers gener-
      1                                                                                                                     ally predict that life expectancy will continue to rise
                                                                                                                            and that birth rates will remain as they are now, so
      0                                                                                                                     scheduled outlays are projected to resume their
      1985       1995          2005      2015        2025     2035          2045   2055   2065      2075      2085          upward trajectory around 2050, reaching 6.4 per-
      Source: Congressional Budget Office.                                                                                  cent of GDP in 2085.

      Note: The lines indicate CBO’s projections of expected outcomes. The shaded areas indicate the 80 percent             The amount of tax revenues credited to the trust
            range of uncertainty.                                                                                           funds is projected to grow slightly as a share of
      a. Includes payroll taxes and income taxes on benefits.                                                               GDP over the next 75 years, rising from 4.6 per-
                                                                                                                            cent of GDP in 2010 to 4.9 percent in 2035 and
      b. Includes scheduled benefits and administrative costs.                                                              then edging up to 5.1 percent in 2085. Three
                                                                                                                            factors are important in determining that pattern.
                                                                                                                            First, revenues from payroll taxes will increase as
                                                                                                                            the economy recovers. Second, CBO projects that
                                                                                                                            although people’s total compensation will be nearly
                                                                                                                            constant as a percentage of GDP in the long run,
                                                                                                                            the share of compensation that workers receive
                                                                                                                            as wages will rise from 81 percent in 2021 to
                                                                                                                            84 percent in about 2050 as the excise tax on high-
                                                                                                                            premium health insurance plans causes some
                                                                                                                            employers and workers to shift to less expensive
                                                                                                                            plans. Subsequently, as the cost of health care
                                                                                                                            continues to rise, the share of compensation
CBO                                                                                                                                                                    (Continued)
SYSTEM FINANCES                                                                                      CBO’S 2011 LONG-TERM PROJECTIONS FOR SOCIAL SECURITY: ADDITIONAL INFORMATION   7


      Exhibit 2.
                                                                                                                                received as wages will fall, ending up back near
      Social Security Tax Revenues and Outlays, with Scheduled Benefits                                                         81 percent by 2085. Third, when earnings inequal-
                                                                                                                                ity increases (and the distribution of earnings wid-
      (Percentage of gross domestic product)                                                                                    ens), as it has in recent decades, the taxable share
                              Actual                                          Projected                                         of earnings declines because more earnings are
                              2010                     2035                     2060                     2085                   above the maximum amount that is taxed for Social
      Tax Revenues             4.59                     4.93                     5.11                     5.11                  Security. CBO projects that earnings inequality will
      Outlays                  4.88                     6.13                     6.09                     6.41                  increase somewhat during the next few decades and
      Difference              -0.28                    -1.20                    -0.97                    -1.30                  that the share of earnings subject to the payroll tax,
                                                                                                                                which has been above 85 percent in recent years,
                                           80 Percent Range of Uncertainty for CBO's Projections                                will decline to around 82 percent in 2035.
      Tax Revenues                                    4.8 to 5.1               4.9 to 5.4              4.8 to 5.5
                                                                                                                                The uncertainty in CBO’s projections for Social
      Outlays                                         5.3 to 7.3               5.0 to 7.8              5.1 to 8.8
                                                                                                                                Security is illustrated by the range of the outcomes
      Differencea                                    -2.2 to -0.5             -2.6 to 0.1             -3.6 to -0.2
                                                                                                                                from a series of 500 simulations that vary most of
                                                                                                                                the key demographic and economic factors in the
      Source: Congressional Budget Office.                                                                                      analysis according to historical patterns. Although
      Note: Tax revenues consist of payroll taxes and income taxes on benefits that are credited to the Social Security         CBO projects that the program’s outlays will equal
            trust funds in the specified year. Outlays consist of scheduled benefits and administrative costs; scheduled        6.1 percent of GDP in 2035, in 10 percent of the
            benefits are benefits as calculated under the Social Security Act, regardless of the balances in the trust          simulations outlays in 2035 are below 5.3 percent
            funds.                                                                                                              of GDP, and in 10 percent they exceed 7.3 percent
      a. The differences displayed generally do not equal the difference between the outlays and revenues shown                 of GDP. In most simulations, outlays in 2035 are
         because the low and high values of the ranges (for tax revenues, outlays, and the difference) are drawn from           projected to account for a much larger share of
         different simulations.                                                                                                 GDP than the current 4.9 percent.

                                                                                                                                Because payroll taxes are a fixed share of taxable
                                                                                                                                earnings and because earnings generally grow with
                                                                                                                                GDP, there is less uncertainty about tax revenues as
                                                                                                                                a share of GDP than there is about outlays. The
                                                                                                                                range of uncertainty reported here is larger than
                                                                                                                                that shown in CBO’s 2010 Long-Term Projections for
                                                                                                                                Social Security: Additional Information. That report
                                                                                                                                incorporated the estimated effects of the health care
                                                                                                                                legislation enacted in March 2010 on the share of
                                                                                                                                compensation paid in wages but (because the tim-
                                                                                                                                ing of the report did not allow for doing so) did not
                                                                                                                                incorporate variation in that share into the analysis
                                                                                                                                of uncertainty. The range of uncertainty presented
                                                                                                                                in the current analysis is similar to what CBO
                                                                                                                                reported in 2009. 


CBO
SYSTEM FINANCES                                                                                      CBO’S 2011 LONG-TERM PROJECTIONS FOR SOCIAL SECURITY: ADDITIONAL INFORMATION   8


      Exhibit 3.
                                                                                                                                Another perspective on the uncertainty in
      Percentage of Simulations in Which Social Security Outlays Exceed                                                         projections of Social Security’s finances
      Tax Revenues by Specified Percentages, with Scheduled Benefits                                                            involves the percentage of CBO’s simulations
                                                                                                                                in which total outlays exceed tax revenues by
      (Percent)                                                                                                                 a given amount in a particular year. In the
              By 0 Percent of   By 1 Percent of   By 2 Percent of    By 3 Percent of   By 4 Percent of   By 5 Percent of        500 simulations, most of the key demographic
               GDP or More       GDP or More       GDP or More        GDP or More       GDP or More       GDP or More           and economic factors in the analysis vary
      2020          93                 9                 0                  0                 0                 0               according to historical patterns. In 99 percent
      2030          99                60                11                  1                 0                 0               of them, outlays equal or exceed tax revenues
      2040          97                57                13                  1                 0                 0               in 2030. Outlays are at least 1 percentage
      2050          89                45                11                  2                 0                 0               point greater than tax revenues (when both are
      2060          89                52                19                  6                 1                 0               measured as shares of GDP) in 60 percent of
      2070          91                59                25                 10                 4                 1               simulations for that year and at least 2 per-
      2080          93                66                31                 13                 5                 2               centage points greater in 11 percent of those
                                                                                                                                simulations. In later decades, projections of
      Source: Congressional Budget Office.                                                                                      outlays are less certain. As a result, the percent-
      Notes: Tax revenues consist of payroll taxes and income taxes on benefits that are credited to the Social Security        age of simulations in which outlays equal or
             trust funds in the specified year. Outlays consist of scheduled benefits and administrative costs; scheduled       exceed tax revenues is a slightly smaller share
             benefits are benefits as calculated under the Social Security Act, regardless of the balances in the trust         than in 2030 but remains close to 90 percent
             funds. This analysis is based on 500 simulations from CBO's long-term model.                                       in 2050 and beyond. The increase in uncer-
                                                                                                                                tainty about outlays also causes the portion of
             GDP = gross domestic product.
                                                                                                                                simulations in which outlays exceed tax
                                                                                                                                revenues (as shares of GDP) by at least 2 per-
                                                                                                                                centage points to rise; that portion reaches
                                                                                                                                31 percent by 2080. 


CBO
SYSTEM FINANCES                                                                                     CBO’S 2011 LONG-TERM PROJECTIONS FOR SOCIAL SECURITY: ADDITIONAL INFORMATION   9


      Exhibit 4.
                                                                                                                               The projected gap between outlays and reve-
      Social Security Tax Revenues and Outlays, with Scheduled and                                                             nues ultimately will eliminate the balance in
      Payable Benefits                                                                                                         the trust funds and make it impossible, under
                                                                                                                               current law, to pay the full amount of sched-
      (Percentage of gross domestic product)                                                                                   uled benefits. Payable benefits will equal
      7
                                                                                                                               scheduled benefits until the trust funds are
                               Actual   Projected
                                                                     Outlays with Scheduled Benefitsb
                                                                                                                               exhausted; after that, they will equal the Social
      6                                                                                                                        Security program’s annual revenues. CBO
                                                                                                                               projects that the trust funds will be exhausted
      5                                                                                                                        in 2038. In the following year, revenues are
                                                    Tax Revenuesa                                                              projected to equal 81 percent of scheduled
                                                                      Outlays with Payable Benefitsb
      4                 Outlaysb                                                                                               outlays. Thus, payable benefits will be 19 per-
                                                                                                                               cent lower than scheduled benefits. The gap
      3                                                                                                                        between scheduled and payable benefits will
                                                                                                                               shrink slightly for the following decade, falling
      2
                                                                                                                               to 15 percent in 2050. It will then widen, and
                                                                                                                               by 2085, payable benefits will be 23 percent
      1
                                                                                                                               smaller than scheduled benefits. 
      0
      1985       1995         2005       2015       2025      2035    2045       2055       2065        2075      2085

      Source: Congressional Budget Office.
      a. Includes payroll taxes and income taxes on benefits. Tax revenues shown are consistent with payable benefits
         and would decline slightly if the trust funds became exhausted because revenues from income taxes paid on
         benefits would decline.
      b. Includes benefits and administrative costs.


CBO
SYSTEM FINANCES                                                                                         CBO’S 2011 LONG-TERM PROJECTIONS FOR SOCIAL SECURITY: ADDITIONAL INFORMATION   10


      Exhibit 5.
                                                                                                                                   To present the results of long-term projections
      Summarized Financial Measures for Social Security Under the                                                                  succinctly, analysts often summarize scheduled
      Extended-Baseline Scenario, with Scheduled Benefits                                                                          outlays and revenues as a single number that
                                                                                                                                   covers a given period (for example, total out-
                                          As a Percentage of GDP                  As a Percentage of Taxable Payroll               lays over 75 years). The data are summarized
                                   Income          Cost        Actuarial         Income         Cost        Actuarial              by computing the present value of outlays or
                                     Rate          Rate        Balance             Rate         Rate         Balance               tax revenues for a period and dividing that fig-
                                                                                                                                   ure by the present value of the stream for GDP
                                                                    CBO's Projections
                                                                                                                                   (or taxable payroll) over the same period.
      25 Years (2011–2035)           5.64          5.69          -0.05            15.28          15.42           -0.14             (Present value is a single number that expresses
      50 Years (2011–2060)           5.38          5.80          -0.41            14.51          15.62           -1.11
                                                                                                                                   a flow of current and future income, or pay-
      75 Years (2011–2085)           5.31          5.90          -0.58            14.34          15.92           -1.58
                                                                                                                                   ments, in terms of an equivalent lump sum
                                                 80 Percent Range of Uncertainty for CBO's Projectionsa                            received or paid today. That computation uses
      25 Years (2011–2035)        5.5 to 5.8     5.2 to 6.2     -0.5 to 0.3     15.0 to 15.6   14.2 to 16.8     -1.3 to 0.9
                                                                                                                                   the interest rate used to compute interest cred-
      50 Years (2011–2060)        5.2 to 5.5     5.4 to 6.3     -0.9 to 0.0     14.3 to 14.8   14.5 to 17.1    -2.4 to -0.1        ited to the trust funds.) The income rate is the
      75 Years (2011–2085)        5.2 to 5.5     5.4 to 6.5    -1.1 to -0.2     14.1 to 14.6   14.7 to 17.6    -3.1 to -0.6        present value of annual noninterest revenues
                                                                                                                                   (including the initial trust fund balance), and
      Source: Congressional Budget Office.                                                                                         the cost rate is the present value of annual out-
                                                                                                                                   lays (including a target trust fund balance at
      Note: Over the relevant periods, the income rate is the present value of annual tax revenues (plus the initial trust         the end of the period), each divided by the
            fund balance), and the cost rate is the present value of annual outlays (plus the present value of a year’s            present value of taxable payroll or GDP. The
            worth of benefits as a reserve at the end of the period), each divided by the present value of taxable
                                                                                                                                   actuarial balance is the difference between the
            payroll or gross domestic product (GDP). The actuarial balance is the difference between the income and
                                                                                                                                   income and cost rates.
            cost rates.
      a. The balances displayed generally do not equal the difference between the outlays and revenues shown                       This analysis focuses on CBO’s extended-
         because the low and high values of the ranges (for the income rate, the cost rate, and the actuarial balance)             baseline scenario, which adheres closely to cur-
         are drawn from different simulations.                                                                                     rent law. In that scenario, federal income taxes
                                                                                                                                   on benefits would increase over time, and the
                                                                                                                                   estimated 75-year actuarial balance would be
                                                                                                                                   -0.58 percent of GDP or -1.58 percent of tax-
                                                                                                                                   able payroll. That means, for example, that if
                                                                                                                                   the Social Security payroll tax rate was
                                                                                                                                   increased immediately and permanently by
                                                                                                                                   1.58 percentage points—from the current rate
                                                                                                                                   of 12.40 percent to 13.98 percent—or if
                                                                                                                                   scheduled benefits were reduced by an equiva-
                                                                                                                                   lent amount, then the trust funds’ projected
                                                                                                                                   balance at the end of 2085 would equal pro-
                                                                                                                                   jected outlays for 2086. 
CBO
SYSTEM FINANCES                                                                                         CBO’S 2011 LONG-TERM PROJECTIONS FOR SOCIAL SECURITY: ADDITIONAL INFORMATION   11


      Exhibit 6.
                                                                                                                                   This publication focuses mostly on CBO’s
      Summarized Financial Measures for Social Security Under the                                                                  extended-baseline scenario, which adheres
      Alternative Fiscal Scenario, with Scheduled Benefits                                                                         closely to current law. CBO also has made
                                                                                                                                   long-term budget projections using an alterna-
                                          As a Percentage of GDP                  As a Percentage of Taxable Payroll               tive fiscal scenario that incorporates several
                                   Income          Cost        Actuarial         Income         Cost        Actuarial              changes to current law that are widely expected
                                     Rate          Rate        Balance             Rate         Rate         Balance               to occur or that would modify some provisions
                                                                    CBO's Projections
                                                                                                                                   of law that might be difficult to sustain for a
      25 Years (2011–2035)           5.58          5.69          -0.11            15.12          15.42           -0.30             long period. (Details of the two scenarios are
      50 Years (2011–2060)           5.27          5.80          -0.53            14.20          15.62           -1.42             outlined in Table 1-1 of CBO’s 2011 Long-
      75 Years (2011–2085)           5.16          5.90          -0.74            13.91          15.91           -2.00             Term Budget Outlook.)

                                                 80 Percent Range of Uncertainty for CBO's Projectionsa                            The financial outlook for Social Security is
      25 Years (2011–2035)        5.4 to 5.7     5.2 to 6.2     -0.6 to 0.3     14.9 to 15.4   14.2 to 16.8     -1.5 to 0.8        less favorable under the alternative fiscal
      50 Years (2011–2060)        5.1 to 5.4     5.4 to 6.3    -1.0 to -0.1     14.0 to 14.5   14.5 to 17.1    -2.8 to -0.4        scenario (shown in this exhibit) than under
      75 Years (2011–2085)        5.0 to 5.3     5.4 to 6.5    -1.3 to -0.4     13.7 to 14.2   14.7 to 17.6    -3.5 to -1.0        the extended-baseline scenario (shown in
                                                                                                                                   Exhibit 5). Income taxes paid on benefits are
      Source: Congressional Budget Office.                                                                                         assumed to be lower under the alternative fis-
                                                                                                                                   cal scenario, resulting in lower revenues from
      Note: Over the relevant periods, the income rate is the present value of annual tax revenues (plus the initial trust
                                                                                                                                   the taxation of Social Security benefits and
            fund balance), and the cost rate is the present value of annual outlays (plus the present value of a year’s
                                                                                                                                   therefore a lower Social Security income rate.
            worth of benefits as a reserve at the end of the period), each divided by the present value of taxable
                                                                                                                                   Under the alternative fiscal scenario, the 75-
            payroll or gross domestic product (GDP). The actuarial balance is the difference between the income and
                                                                                                                                   year income rate is 5.16 percent of GDP, com-
            cost rates.
                                                                                                                                   pared with a rate of 5.31 percent under the
      a. The balances displayed generally do not equal the difference between the outlays and revenues shown                       extended-baseline scenario. As a result, the
         because the low and high values of the ranges (for the income rate, the cost rate, and the actuarial balance)             75-year actuarial deficit is larger: 0.74 percent
         are drawn from different simulations.                                                                                     of GDP or 2.00 percent of taxable payroll
                                                                                                                                   under the alternative fiscal scenario, compared
                                                                                                                                   with a deficit of 0.58 percent of GDP or
                                                                                                                                   1.58 percent of taxable payroll under the
                                                                                                                                   extended-baseline scenario. 


CBO
SYSTEM FINANCES                                                                                      CBO’S 2011 LONG-TERM PROJECTIONS FOR SOCIAL SECURITY: ADDITIONAL INFORMATION   12


      Exhibit 7.
                                                                                                                                The trust fund ratio—the balance in the Social
      Trust Fund Ratio, with Scheduled Benefits                                                                                 Security trust funds at the beginning of the
                                                                                                                                year divided by the system’s outlays projected
       10                                                                                                                       for that year—indicates the proportion of a
                                Actual   Projected
                                                                                                                                year’s cost that could be paid with the funds
        5                                                                                                                       available. The trust fund ratio for 2010 was
                                                                                                                                3.6, and CBO projects that it will fall to 3.5
        0                                                                                                                       this year. The rate of decline will accelerate in
                                                                                                                                subsequent decades, and the ratio will reach
       -5                                                                                                                       zero in 2038, CBO projects. At that point,
                                                                                                                                payments to current and new beneficiaries
                                                                                                                                would need to be reduced to make the outlays
      -10
                                                                                                                                from the funds equal to the revenues flowing
                                                                                                                                into the funds.
      -15
                                                                                                                                The year in which the trust funds will be
      -20                                                                                                                       exhausted could differ significantly from
                                                                                                                                CBO’s projection, however. In 10 percent of
      -25                                                                                                                       CBO’s simulations, the trust funds are
        1985       1995       2005       2015        2025    2035       2045       2055      2065       2075       2085         exhausted in 2030 or earlier, and in 10 per-
                                                                                                                                cent, they are exhausted in 2059 or later; in
      Source: Congressional Budget Office.
                                                                                                                                those simulations, most of the key demo-
      Note: The trust fund ratio is the ratio of the trust fund balance (the amount in the trust funds) at the beginning        graphic and economic factors in the analysis
            of a year to outlays in that year. Outlays consist of benefits and administrative costs. The trust funds are        were varied according to historical patterns.
            exhausted when the trust fund ratio reaches zero. Under current law, the trust funds cannot incur negative          (The shaded area in the figure shows the
            balances. The negative balances shown in this exhibit indicate a projected shortfall, reflecting the trust          80 percent range of uncertainty. The inter-
            funds’ inability to pay scheduled benefits out of current-law revenues. The dark line indicates CBO’s               section between the shaded area and the
            projection of expected outcomes; the shaded area indicates the 80 percent range of uncertainty around               horizontal line at zero, spanning the years
            the projection.                                                                                                     between 2030 and 2059, corresponds to the
                                                                                                                                80 percent range of uncertainty about the year
                                                                                                                                in which the trust funds will become
                                                                                                                                exhausted.) The negative balances represent
                                                                                                                                CBO’s estimates of the cumulative amount of
                                                                                                                                scheduled benefits that cannot be paid from
                                                                                                                                the program’s current-law revenues (expressed
                                                                                                                                as a ratio to outlays in each year). 


CBO
SYSTEM FINANCES                                                                                   CBO’S 2011 LONG-TERM PROJECTIONS FOR SOCIAL SECURITY: ADDITIONAL INFORMATION   13


      Exhibit 8.
                                                                                                                             An alternative way to consider uncertainty is
      Percentage of Simulations That Show the Social Security                                                                to examine the percentage of simulations in
      Trust Funds Exhausted by a Particular Year                                                                             which the trust funds are exhausted by a spe-
                                                                                                                             cific year. In those simulations, most of the
                                                                                                                             key demographic and economic factors in the
      100                                                                                                                    analysis were varied according to historical pat-
                                                                                                                             terns. In 42 percent of CBO’s simulations, the
       80
                                                                                                                             funds are exhausted by 2035. In 84 percent of
                                                                                                                             the simulations, the trust funds are exhausted
                                                                                                                             by 2050. In 97 percent of the simulations, the
       60                                                                                                                    trust funds are exhausted by 2085. 

       40


       20


        0
         2011   2016    2021   2026   2031   2036   2041   2046   2051   2056   2061   2066   2071   2076   2081 2085

      Source: Congressional Budget Office.
      Note: The data are based on 500 simulations from CBO’s long-term model.


CBO
Distribution of Benefits


CBO
DISTRIBUTION OF BENEFITS                                                                             CBO’S 2011 LONG-TERM PROJECTIONS FOR SOCIAL SECURITY: ADDITIONAL INFORMATION   15


      Exhibit 9.
                                                                                                                                Future retired workers are projected to receive
      Median Initial Benefits for Retired Workers, with Scheduled and                                                           higher initial annual Social Security benefits
      Payable Benefits                                                                                                          than today’s beneficiaries receive—both sched-
                                                                                                                                uled and payable benefits (net of income taxes
      (Thousands of 2011 dollars)                                                                                               paid on those benefits and adjusted for the
                                               Lowest Quintile of         Middle Quintile of      Highest Quintile of           effects of inflation).
      10-Year                                 Lifetime Household         Lifetime Household       Lifetime Household
                                                                                                                                CBO considered a hypothetical benefit
      Birth          All Retired Workers            Earnings                   Earnings                 Earnings
                                                                                                                                amount: the median initial benefit a worker
      Cohort        Scheduled Payable        Scheduled Payable          Scheduled Payable        Scheduled Payable
                                                                                                                                would receive if everyone claimed benefits at
                                                                  All                                                           age 65, based on earnings through age 61. The
      1940s             16         16             9           9            18          18            24          24             median initial scheduled benefit rises over time
      1960s             17         17            10          10            18          18            29          29             because of growth in average earnings. How-
      1980s             21         18            12          11            22          19            38          32             ever, the effect of growing earnings will be
      2000s             28         22            16          13            30          24            51          41             partly offset for several cohorts by the sched-
                                                                  Men                                                           uled rise in the full retirement age, from 65 for
                                                                                                                                people born before 1938 to 67 for those born
      1940s             20         20            10          10            21          21            26          26
                                                                                                                                after 1959. The effect is equivalent to a reduc-
      1960s             20         20            11          11            21          21            31          31
                                                                                                                                tion in benefits at any age at which benefits are
      1980s             24         20            13          12            25          21            40          35
      2000s             32         26            18          14            33          27            54          44
                                                                                                                                claimed. Once the older retirement age is in
                                                                                                                                place, median initial benefits will grow at
                                                               Women                                                            about the same rate as median earnings.
      1940s             13         13             8           8            14          14            20          20
                                                                                                                                When the trust funds are exhausted, payable
      1960s             15         15             9           9            16          16            25          25
      1980s             18         15            11           9            20          17            33          28
                                                                                                                                benefits will fall, but then they will rise again
      2000s             24         19            14          11            26          21            45          36             as earnings (and therefore tax revenues) grow.
                                                                                                                                Although payable initial benefits are lower
                                                                                                                                than scheduled initial benefits for people born
      Source: Congressional Budget Office.
                                                                                                                                in 1974 and later, they will be higher than cur-
      Note: Initial annual benefits are computed for all individuals who are eligible to claim retirement benefits at           rent initial benefits, CBO projects.
            age 62 and who have not yet claimed any other benefit. All workers are assumed to claim benefits at
            age 65. All values are net of income taxes paid on benefits and credited to the Social Security trust funds.        Projected benefits are lower for women than
                                                                                                                                for men in all cohorts because women have
                                                                                                                                lower average earnings; the gap is narrower (as
                                                                                                                                a share of men’s benefits) for later cohorts
                                                                                                                                because men’s and women’s earnings have
                                                                                                                                become more equal. For the 1940s cohort,
                                                                                                                                projected initial benefits for women are about
                                                                                                                                35 percent below those for men, but for the
                                                                                                                                1980s cohort and later groups, they are about
CBO                                                                                                                             25 percent below those for men. 
DISTRIBUTION OF BENEFITS                                                                          CBO’S 2011 LONG-TERM PROJECTIONS FOR SOCIAL SECURITY: ADDITIONAL INFORMATION   16


      Exhibit 10.
                                                                                                                             Initial replacement rates—initial annual bene-
      Median Initial Replacement Rates for Retired Workers, with                                                             fits net of income taxes paid on those benefits
      Scheduled and Payable Benefits                                                                                         as a percentage of average annual lifetime earn-
                                                                                                                             ings—provide a perspective on retired workers’
      (Percent)                                                                                                              benefits that is different from that provided by
                                              Lowest Quintile of         Middle Quintile of     Highest Quintile of          looking simply at dollar amounts.
      10-Year                                 Lifetime Household        Lifetime Household      Lifetime Household
                                                                                                                             Several factors affect the patterns shown here.
      Birth          All Retired Workers            Earnings                  Earnings                Earnings
                                                                                                                             First, the progressive nature of Social Security’s
      Cohort        Scheduled Payable        Scheduled Payable         Scheduled Payable       Scheduled Payable
                                                                                                                             benefit formula results in replacement rates
                                                                 All                                                         that are higher for workers within a birth
      1940s             45         45           71          71            43          43           30         30             cohort who have had lower earnings. Second,
      1960s             42         42           62          62            41          41           28         28             with payable benefits, the replacement rate will
      1980s             43         37           64          56            42          36           28         24             drop noticeably at all earnings amounts for
      2000s             42         34           62          50            41          33           27         22             people in the cohorts that first receive benefits
                                                                 Men                                                         after the trust funds are exhausted.
      1940s             40         40           65          65            39          39           25         25             Third, the scheduled increase in the full retire-
      1960s             39         39           58          58            38          38           22         22             ment age will lower the replacement rate for
      1980s             40         35           61          53            40          34           23         20             future beneficiaries (for any chosen age for
      2000s             39         32           58          47            39          32           22         18             claiming benefits) compared with the rate for
                                                              Women                                                          people who are claiming benefits now. In
                                                                                                                             particular, if Social Security benefits are paid as
      1940s             51         51           76          76            49          49           40         40
      1960s             47         47           67          67            44          44           37         37
                                                                                                                             scheduled, the median replacement rate for
      1980s             47         40           67          58            45          38           36         31             beneficiaries born in the 2000s (about 42 per-
      2000s             46         37           65          53            44          35           34         28             cent) will be slightly lower than the rate for
                                                                                                                             beneficiaries born in the 1940s (about 45 per-
      Source: Congressional Budget Office.                                                                                   cent), CBO estimates. People in later cohorts,
                                                                                                                             however, are expected to collect benefits for a
      Note: The average initial replacement rate is a worker’s initial benefit as a percentage of a worker’s average         longer time as life expectancy increases.
            annual lifetime earnings. (To compute lifetime earnings, past earnings are adjusted for average growth in
            economywide earnings.) Replacement rates are computed for all individuals who are eligible to claim              Fourth, because women tend to have lower
            retirement benefits at age 62 and who have not yet claimed any other benefit. All workers are assumed to         lifetime earnings, their average replacement
            claim benefits at age 65. All values are net of income taxes paid on benefits and credited to the Social         rates are higher than men’s are, especially for
            Security trust funds.                                                                                            earlier birth cohorts. The difference between
                                                                                                                             the rates for women and men in the highest
                                                                                                                             quintile is large, in part because that group
                                                                                                                             includes many women who spend time out of
                                                                                                                             the labor force or who work part time. In con-
                                                                                                                             trast, most men in households with high earn-
CBO                                                                                                                          ings are employed full time. 
DISTRIBUTION OF BENEFITS                                                                             CBO’S 2011 LONG-TERM PROJECTIONS FOR SOCIAL SECURITY: ADDITIONAL INFORMATION   17


      Exhibit 11.
                                                                                                                                CBO calculates lifetime retirement benefits as
      Median Present Value of Lifetime Benefits for Retired Workers, with                                                       the present value, discounted to the year in
      Scheduled and Payable Benefits                                                                                            which the beneficiary turns 62, of all retired-
                                                                                                                                worker benefits that a worker receives from the
      (Thousands of 2011 dollars)                                                                                               program. CBO estimates that real median life-
                                              Lowest Quintile of          Middle Quintile of      Highest Quintile of           time benefits (both scheduled and payable
      10-Year                                 Lifetime Household         Lifetime Household       Lifetime Household            benefits, adjusted for inflation) for each birth
      Birth          All Retired Workers            Earnings                   Earnings                 Earnings                cohort will be greater than those for the pre-
      Cohort        Scheduled Payable        Scheduled Payable          Scheduled Payable        Scheduled Payable              ceding cohort, because benefits grow with
                                                                  All                                                           earnings and earnings are expected to continue
                                                                                                                                to rise over time. For example, real median
      1940s            169        168            82          82           189         188           309         309
      1960s            200        187           103          98           221         206           387         355
                                                                                                                                scheduled lifetime benefits for people born in
      1980s            256        214           135         114           286         239           517         433
                                                                                                                                the 2000s will be more than double those for
      2000s            351        275           182         147           394         309           712         567             people born in the 1940s; real median payable
                                                                                                                                lifetime benefits for the 2000s cohort will be
                                                                  Men                                                           about 65 percent greater.
      1940s            204        204            83          82           234         234           350         349
      1960s            226        211           105         100           251         233           432         396             The projected trends in median lifetime retire-
      1980s            284        237           140         119           313         261           570         478             ment benefits differ from the trends in median
      2000s            393        308           192         154           440         341           785         624             initial benefits for two reasons. First, as life
                                                                                                                                expectancy increases, people will collect bene-
                                                               Women                                                            fits for longer periods, so scheduled lifetime
      1940s            145        145            82          82           161         161           247         245             benefits will grow faster than scheduled initial
      1960s            182        169           101          96           203         187           316         293             benefits. Second, although cohorts that begin
      1980s            233        195           129         110           260         217           441         372             to receive benefits before the trust funds are
      2000s            318        249           174         142           354         280           610         481             exhausted will collect their scheduled initial
                                                                                                                                benefits, some members of those cohorts will
      Source: Congressional Budget Office.                                                                                      still be receiving benefits when the trust funds
      Note: Benefits are the present value of all retired-worker benefits received. To calculate their present value,           are exhausted. At that point, payable benefits
            benefits are adjusted for inflation (to produce constant dollars) and discounted to age 62. All values are          will decline, and the payable lifetime benefits
            net of income taxes paid on benefits and credited to the Social Security trust funds.                               for those recipients will be less than their
                                                                                                                                scheduled lifetime benefits.
                                                                                                                                Lifetime benefits are lower for women than
                                                                                                                                for men. However, the gap is smaller than it is
                                                                                                                                for initial benefits because women live longer,
                                                                                                                                on average, and thus tend to collect benefits
                                                                                                                                for a longer time. 


CBO
CBO's 2011 Long-Term Projections for Social Security: Additional Information

More Related Content

What's hot

Charts from CBO's August 2012 Budget and Economic Outlook
Charts from CBO's August 2012 Budget and Economic OutlookCharts from CBO's August 2012 Budget and Economic Outlook
Charts from CBO's August 2012 Budget and Economic OutlookCongressional Budget Office
 
The Status of Federal Housing Assistance for Low-Income Households
The Status of Federal Housing Assistance for Low-Income HouseholdsThe Status of Federal Housing Assistance for Low-Income Households
The Status of Federal Housing Assistance for Low-Income HouseholdsCongressional Budget Office
 
Use of Tax Incentives for Retirement Saving in 2006
Use of Tax Incentives for Retirement Saving in 2006Use of Tax Incentives for Retirement Saving in 2006
Use of Tax Incentives for Retirement Saving in 2006Congressional Budget Office
 
The Budgetary Treatment of Surface Transportation Programs and Federal Financ...
The Budgetary Treatment of Surface Transportation Programs and Federal Financ...The Budgetary Treatment of Surface Transportation Programs and Federal Financ...
The Budgetary Treatment of Surface Transportation Programs and Federal Financ...Congressional Budget Office
 
The FAST Act and the Budgetary Treatment of Federal Financing Instruments
The FAST Act and the Budgetary Treatment of Federal Financing InstrumentsThe FAST Act and the Budgetary Treatment of Federal Financing Instruments
The FAST Act and the Budgetary Treatment of Federal Financing InstrumentsCongressional Budget Office
 
Overview of the Debt Limit and Extraordinary Measures
Overview of the Debt Limit and Extraordinary MeasuresOverview of the Debt Limit and Extraordinary Measures
Overview of the Debt Limit and Extraordinary MeasuresCongressional Budget Office
 
Modeling the budgetary cost of fha's single family mortgage insurance
Modeling the budgetary cost of fha's single family mortgage insuranceModeling the budgetary cost of fha's single family mortgage insurance
Modeling the budgetary cost of fha's single family mortgage insuranceCongressional Budget Office
 
The Status of the Highway Trust Fund and Budget Basics for the Treatment of N...
The Status of the Highway Trust Fund and Budget Basics for the Treatment of N...The Status of the Highway Trust Fund and Budget Basics for the Treatment of N...
The Status of the Highway Trust Fund and Budget Basics for the Treatment of N...Congressional Budget Office
 
How CBO Uses Data for Budget Projections and Cost Estimates
How CBO Uses Data for Budget Projections and Cost EstimatesHow CBO Uses Data for Budget Projections and Cost Estimates
How CBO Uses Data for Budget Projections and Cost EstimatesCongressional Budget Office
 
Children’s Health Insurance Program: Financing Issues
Children’s Health Insurance Program: Financing IssuesChildren’s Health Insurance Program: Financing Issues
Children’s Health Insurance Program: Financing IssuesCongressional Budget Office
 
Analysis of Approaches to Reduce Federal Spending on Military Compensation
Analysis of Approaches to Reduce Federal Spending on Military CompensationAnalysis of Approaches to Reduce Federal Spending on Military Compensation
Analysis of Approaches to Reduce Federal Spending on Military CompensationCongressional Budget Office
 
CBO Director Doug Elmendorf's Presentation at Harvard University
CBO Director Doug Elmendorf's Presentation at Harvard UniversityCBO Director Doug Elmendorf's Presentation at Harvard University
CBO Director Doug Elmendorf's Presentation at Harvard UniversityCongressional Budget Office
 

What's hot (20)

Charts from CBO's August 2012 Budget and Economic Outlook
Charts from CBO's August 2012 Budget and Economic OutlookCharts from CBO's August 2012 Budget and Economic Outlook
Charts from CBO's August 2012 Budget and Economic Outlook
 
The Status of Federal Housing Assistance for Low-Income Households
The Status of Federal Housing Assistance for Low-Income HouseholdsThe Status of Federal Housing Assistance for Low-Income Households
The Status of Federal Housing Assistance for Low-Income Households
 
Use of Tax Incentives for Retirement Saving in 2006
Use of Tax Incentives for Retirement Saving in 2006Use of Tax Incentives for Retirement Saving in 2006
Use of Tax Incentives for Retirement Saving in 2006
 
How CBO Promotes Integrity in Its Analyses
How CBO Promotes Integrity in Its AnalysesHow CBO Promotes Integrity in Its Analyses
How CBO Promotes Integrity in Its Analyses
 
The Budget Outlook
The Budget OutlookThe Budget Outlook
The Budget Outlook
 
Productivity and Growth in CBO's Forecasts
Productivity and Growth in CBO's ForecastsProductivity and Growth in CBO's Forecasts
Productivity and Growth in CBO's Forecasts
 
The Budgetary Treatment of Surface Transportation Programs and Federal Financ...
The Budgetary Treatment of Surface Transportation Programs and Federal Financ...The Budgetary Treatment of Surface Transportation Programs and Federal Financ...
The Budgetary Treatment of Surface Transportation Programs and Federal Financ...
 
The FAST Act and the Budgetary Treatment of Federal Financing Instruments
The FAST Act and the Budgetary Treatment of Federal Financing InstrumentsThe FAST Act and the Budgetary Treatment of Federal Financing Instruments
The FAST Act and the Budgetary Treatment of Federal Financing Instruments
 
CBO’s Role in the Legislative Process
CBO’s Role in the Legislative ProcessCBO’s Role in the Legislative Process
CBO’s Role in the Legislative Process
 
Overview of the Debt Limit and Extraordinary Measures
Overview of the Debt Limit and Extraordinary MeasuresOverview of the Debt Limit and Extraordinary Measures
Overview of the Debt Limit and Extraordinary Measures
 
Trends in Federal Tax Revenues and Rates
Trends in Federal Tax Revenues and RatesTrends in Federal Tax Revenues and Rates
Trends in Federal Tax Revenues and Rates
 
The Uncertainty of Long-Term Budget Projections
The Uncertainty of Long-Term Budget ProjectionsThe Uncertainty of Long-Term Budget Projections
The Uncertainty of Long-Term Budget Projections
 
Modeling the budgetary cost of fha's single family mortgage insurance
Modeling the budgetary cost of fha's single family mortgage insuranceModeling the budgetary cost of fha's single family mortgage insurance
Modeling the budgetary cost of fha's single family mortgage insurance
 
The Status of the Highway Trust Fund and Budget Basics for the Treatment of N...
The Status of the Highway Trust Fund and Budget Basics for the Treatment of N...The Status of the Highway Trust Fund and Budget Basics for the Treatment of N...
The Status of the Highway Trust Fund and Budget Basics for the Treatment of N...
 
How CBO Uses Data for Budget Projections and Cost Estimates
How CBO Uses Data for Budget Projections and Cost EstimatesHow CBO Uses Data for Budget Projections and Cost Estimates
How CBO Uses Data for Budget Projections and Cost Estimates
 
The Status of the Highway Trust Fund, June 2014
The Status of the Highway Trust Fund, June 2014The Status of the Highway Trust Fund, June 2014
The Status of the Highway Trust Fund, June 2014
 
Children’s Health Insurance Program: Financing Issues
Children’s Health Insurance Program: Financing IssuesChildren’s Health Insurance Program: Financing Issues
Children’s Health Insurance Program: Financing Issues
 
Analysis of Approaches to Reduce Federal Spending on Military Compensation
Analysis of Approaches to Reduce Federal Spending on Military CompensationAnalysis of Approaches to Reduce Federal Spending on Military Compensation
Analysis of Approaches to Reduce Federal Spending on Military Compensation
 
Infographic: Discretionary Spending in 2013
Infographic: Discretionary Spending in 2013Infographic: Discretionary Spending in 2013
Infographic: Discretionary Spending in 2013
 
CBO Director Doug Elmendorf's Presentation at Harvard University
CBO Director Doug Elmendorf's Presentation at Harvard UniversityCBO Director Doug Elmendorf's Presentation at Harvard University
CBO Director Doug Elmendorf's Presentation at Harvard University
 

Similar to CBO's 2011 Long-Term Projections for Social Security: Additional Information

The 2013 Long-Term Projections for Social Security: Additional Information
The 2013 Long-Term Projections for Social Security: Additional InformationThe 2013 Long-Term Projections for Social Security: Additional Information
The 2013 Long-Term Projections for Social Security: Additional InformationCongressional Budget Office
 
CBO: Its Role, Long-Term Projections, and Use of Research
CBO: Its Role, Long-Term Projections, and Use of ResearchCBO: Its Role, Long-Term Projections, and Use of Research
CBO: Its Role, Long-Term Projections, and Use of ResearchCongressional Budget Office
 
Choices for Federal Spending and Taxes: CBO Director Doug Elmendorf's Goldman...
Choices for Federal Spending and Taxes: CBO Director Doug Elmendorf's Goldman...Choices for Federal Spending and Taxes: CBO Director Doug Elmendorf's Goldman...
Choices for Federal Spending and Taxes: CBO Director Doug Elmendorf's Goldman...Congressional Budget Office
 
Choices for Federal Spending and Taxes: CBO Director Doug Elmendorf's Present...
Choices for Federal Spending and Taxes: CBO Director Doug Elmendorf's Present...Choices for Federal Spending and Taxes: CBO Director Doug Elmendorf's Present...
Choices for Federal Spending and Taxes: CBO Director Doug Elmendorf's Present...Congressional Budget Office
 
Pre 30 June Checklist 2012
Pre 30 June Checklist 2012Pre 30 June Checklist 2012
Pre 30 June Checklist 2012rylancet
 
Pre 30 June Checklist 2012
Pre 30 June Checklist 2012Pre 30 June Checklist 2012
Pre 30 June Checklist 2012Bonifanth
 
Social Security Reform and the Joint Budget Committee Process
Social Security Reform and the Joint Budget Committee ProcessSocial Security Reform and the Joint Budget Committee Process
Social Security Reform and the Joint Budget Committee ProcessMercatus Center
 
CONGRESS OF THE UNITED STATESCONGRESSIONAL BUDGET OFFICE
CONGRESS OF THE UNITED STATESCONGRESSIONAL BUDGET OFFICECONGRESS OF THE UNITED STATESCONGRESSIONAL BUDGET OFFICE
CONGRESS OF THE UNITED STATESCONGRESSIONAL BUDGET OFFICEAlleneMcclendon878
 
The Alphabet Forest: OPEB, GASB and Pensions
The Alphabet Forest: OPEB, GASB and PensionsThe Alphabet Forest: OPEB, GASB and Pensions
The Alphabet Forest: OPEB, GASB and PensionsJim van Iwaarden
 
Pension & OPEB Funding Strategies for Illinois Public Plans
Pension & OPEB Funding Strategies for Illinois Public PlansPension & OPEB Funding Strategies for Illinois Public Plans
Pension & OPEB Funding Strategies for Illinois Public PlansJim van Iwaarden
 
2012 01-bis-the sustainability of pension schemes
2012 01-bis-the sustainability of pension schemes2012 01-bis-the sustainability of pension schemes
2012 01-bis-the sustainability of pension schemesJean-Baptiste Pethe
 
Comparing CBO’s Long-Term Projections With Those of the Social Security Trustees
Comparing CBO’s Long-Term Projections With Those of the Social Security TrusteesComparing CBO’s Long-Term Projections With Those of the Social Security Trustees
Comparing CBO’s Long-Term Projections With Those of the Social Security TrusteesCongressional Budget Office
 
Pension Reforms in India
Pension Reforms in IndiaPension Reforms in India
Pension Reforms in IndiaCognizant
 
How CBO Develops the Economic Projections Underlying Its Long-Term Budget Pro...
How CBO Develops the Economic Projections Underlying Its Long-Term Budget Pro...How CBO Develops the Economic Projections Underlying Its Long-Term Budget Pro...
How CBO Develops the Economic Projections Underlying Its Long-Term Budget Pro...Congressional Budget Office
 
Expanding insurance coverage to informal sector populations: Experience from ...
Expanding insurance coverage to informal sector populations: Experience from ...Expanding insurance coverage to informal sector populations: Experience from ...
Expanding insurance coverage to informal sector populations: Experience from ...Dr Lendy Spires
 

Similar to CBO's 2011 Long-Term Projections for Social Security: Additional Information (20)

The 2013 Long-Term Projections for Social Security: Additional Information
The 2013 Long-Term Projections for Social Security: Additional InformationThe 2013 Long-Term Projections for Social Security: Additional Information
The 2013 Long-Term Projections for Social Security: Additional Information
 
CBO: Its Role, Long-Term Projections, and Use of Research
CBO: Its Role, Long-Term Projections, and Use of ResearchCBO: Its Role, Long-Term Projections, and Use of Research
CBO: Its Role, Long-Term Projections, and Use of Research
 
Choices for Federal Spending and Taxes: CBO Director Doug Elmendorf's Goldman...
Choices for Federal Spending and Taxes: CBO Director Doug Elmendorf's Goldman...Choices for Federal Spending and Taxes: CBO Director Doug Elmendorf's Goldman...
Choices for Federal Spending and Taxes: CBO Director Doug Elmendorf's Goldman...
 
CBO’s Projections of Tax Revenues
CBO’s Projections of Tax RevenuesCBO’s Projections of Tax Revenues
CBO’s Projections of Tax Revenues
 
Choices for Federal Spending and Taxes: CBO Director Doug Elmendorf's Present...
Choices for Federal Spending and Taxes: CBO Director Doug Elmendorf's Present...Choices for Federal Spending and Taxes: CBO Director Doug Elmendorf's Present...
Choices for Federal Spending and Taxes: CBO Director Doug Elmendorf's Present...
 
Pre 30 June Checklist 2012
Pre 30 June Checklist 2012Pre 30 June Checklist 2012
Pre 30 June Checklist 2012
 
Pre 30 June Checklist 2012
Pre 30 June Checklist 2012Pre 30 June Checklist 2012
Pre 30 June Checklist 2012
 
Social Security Reform and the Joint Budget Committee Process
Social Security Reform and the Joint Budget Committee ProcessSocial Security Reform and the Joint Budget Committee Process
Social Security Reform and the Joint Budget Committee Process
 
CONGRESS OF THE UNITED STATESCONGRESSIONAL BUDGET OFFICE
CONGRESS OF THE UNITED STATESCONGRESSIONAL BUDGET OFFICECONGRESS OF THE UNITED STATESCONGRESSIONAL BUDGET OFFICE
CONGRESS OF THE UNITED STATESCONGRESSIONAL BUDGET OFFICE
 
The Alphabet Forest: OPEB, GASB and Pensions
The Alphabet Forest: OPEB, GASB and PensionsThe Alphabet Forest: OPEB, GASB and Pensions
The Alphabet Forest: OPEB, GASB and Pensions
 
Pension & OPEB Funding Strategies for Illinois Public Plans
Pension & OPEB Funding Strategies for Illinois Public PlansPension & OPEB Funding Strategies for Illinois Public Plans
Pension & OPEB Funding Strategies for Illinois Public Plans
 
Perspective on the Employment Insurance System
Perspective on the Employment Insurance SystemPerspective on the Employment Insurance System
Perspective on the Employment Insurance System
 
Long-Term Budget Outlook
Long-Term Budget OutlookLong-Term Budget Outlook
Long-Term Budget Outlook
 
2012 01-bis-the sustainability of pension schemes
2012 01-bis-the sustainability of pension schemes2012 01-bis-the sustainability of pension schemes
2012 01-bis-the sustainability of pension schemes
 
Comparing CBO’s Long-Term Projections With Those of the Social Security Trustees
Comparing CBO’s Long-Term Projections With Those of the Social Security TrusteesComparing CBO’s Long-Term Projections With Those of the Social Security Trustees
Comparing CBO’s Long-Term Projections With Those of the Social Security Trustees
 
Pension Reforms in India
Pension Reforms in IndiaPension Reforms in India
Pension Reforms in India
 
New Pension Rules
New Pension RulesNew Pension Rules
New Pension Rules
 
How CBO Develops the Economic Projections Underlying Its Long-Term Budget Pro...
How CBO Develops the Economic Projections Underlying Its Long-Term Budget Pro...How CBO Develops the Economic Projections Underlying Its Long-Term Budget Pro...
How CBO Develops the Economic Projections Underlying Its Long-Term Budget Pro...
 
Pa Pension Reform Plc 04 16 2010
Pa Pension Reform Plc  04 16 2010Pa Pension Reform Plc  04 16 2010
Pa Pension Reform Plc 04 16 2010
 
Expanding insurance coverage to informal sector populations: Experience from ...
Expanding insurance coverage to informal sector populations: Experience from ...Expanding insurance coverage to informal sector populations: Experience from ...
Expanding insurance coverage to informal sector populations: Experience from ...
 

More from Congressional Budget Office

How the Congressional Budget Office Assists Lawmakers
How the Congressional Budget Office Assists LawmakersHow the Congressional Budget Office Assists Lawmakers
How the Congressional Budget Office Assists LawmakersCongressional Budget Office
 
Introduction to the Role of the Congressional Budget Office
Introduction to the Role of the Congressional Budget OfficeIntroduction to the Role of the Congressional Budget Office
Introduction to the Role of the Congressional Budget OfficeCongressional Budget Office
 
CBO’s Work on Health Care and a Call for New Research
CBO’s Work on Health Care and a Call for New ResearchCBO’s Work on Health Care and a Call for New Research
CBO’s Work on Health Care and a Call for New ResearchCongressional Budget Office
 
The Federal Perspective on Coverage of Medications to Treat Obesity: Consider...
The Federal Perspective on Coverage of Medications to Treat Obesity: Consider...The Federal Perspective on Coverage of Medications to Treat Obesity: Consider...
The Federal Perspective on Coverage of Medications to Treat Obesity: Consider...Congressional Budget Office
 
CBO’s Approach to Estimating the Budgetary Effects of the No Surprises Act of...
CBO’s Approach to Estimating the Budgetary Effects of the No Surprises Act of...CBO’s Approach to Estimating the Budgetary Effects of the No Surprises Act of...
CBO’s Approach to Estimating the Budgetary Effects of the No Surprises Act of...Congressional Budget Office
 
The Budget and Economic Outlook for 2024 to 2034: Press Briefing Slides
The Budget and Economic Outlook for 2024 to 2034: Press Briefing SlidesThe Budget and Economic Outlook for 2024 to 2034: Press Briefing Slides
The Budget and Economic Outlook for 2024 to 2034: Press Briefing SlidesCongressional Budget Office
 
The Economic Outlook for 2024 to 2034 in 19 Slides
The Economic Outlook for 2024 to 2034 in 19 SlidesThe Economic Outlook for 2024 to 2034 in 19 Slides
The Economic Outlook for 2024 to 2034 in 19 SlidesCongressional Budget Office
 
Using Multiple Data Sources to Learn About the Race and Ethnicity of Taxpayers
Using Multiple Data Sources to Learn About the Race and Ethnicity of TaxpayersUsing Multiple Data Sources to Learn About the Race and Ethnicity of Taxpayers
Using Multiple Data Sources to Learn About the Race and Ethnicity of TaxpayersCongressional Budget Office
 
Perspectives on the Navy’s 2024 Shipbuilding Plan
Perspectives on the Navy’s 2024 Shipbuilding PlanPerspectives on the Navy’s 2024 Shipbuilding Plan
Perspectives on the Navy’s 2024 Shipbuilding PlanCongressional Budget Office
 
The 2024 Outlook for Navy Shipbuilding: Familiar Plans and Higher Costs
The 2024 Outlook for Navy Shipbuilding: Familiar Plans and Higher CostsThe 2024 Outlook for Navy Shipbuilding: Familiar Plans and Higher Costs
The 2024 Outlook for Navy Shipbuilding: Familiar Plans and Higher CostsCongressional Budget Office
 
Exploring the Effects of Medicaid During Childhood on the Economy and the Budget
Exploring the Effects of Medicaid During Childhood on the Economy and the BudgetExploring the Effects of Medicaid During Childhood on the Economy and the Budget
Exploring the Effects of Medicaid During Childhood on the Economy and the BudgetCongressional Budget Office
 
CBO’s Role and Most Recent Long-Term Budget Projections
CBO’s Role and Most Recent Long-Term Budget ProjectionsCBO’s Role and Most Recent Long-Term Budget Projections
CBO’s Role and Most Recent Long-Term Budget ProjectionsCongressional Budget Office
 
Approaches to Estimating the Noncyclical Rate of Unemployment
 Approaches to Estimating the Noncyclical Rate of Unemployment Approaches to Estimating the Noncyclical Rate of Unemployment
Approaches to Estimating the Noncyclical Rate of UnemploymentCongressional Budget Office
 
CBO’s Analysis of the Long-Term Budgetary Outlook
CBO’s Analysis of the Long-Term Budgetary OutlookCBO’s Analysis of the Long-Term Budgetary Outlook
CBO’s Analysis of the Long-Term Budgetary OutlookCongressional Budget Office
 
Projecting the Effects of U.S. Federal Policies on Electric Vehicle Demand an...
Projecting the Effects of U.S. Federal Policies on Electric Vehicle Demand an...Projecting the Effects of U.S. Federal Policies on Electric Vehicle Demand an...
Projecting the Effects of U.S. Federal Policies on Electric Vehicle Demand an...Congressional Budget Office
 
CBO’s Recent Appeals for New Research to Enhance Its Work for the Congress
CBO’s Recent Appeals for New Research to Enhance Its Work for the CongressCBO’s Recent Appeals for New Research to Enhance Its Work for the Congress
CBO’s Recent Appeals for New Research to Enhance Its Work for the CongressCongressional Budget Office
 
Trends in the Distribution of Household Income From 1979 to 2020
Trends in the Distribution of Household Income From 1979 to 2020Trends in the Distribution of Household Income From 1979 to 2020
Trends in the Distribution of Household Income From 1979 to 2020Congressional Budget Office
 

More from Congressional Budget Office (20)

The Federal Budget and Health Care Policy
The Federal Budget and Health Care PolicyThe Federal Budget and Health Care Policy
The Federal Budget and Health Care Policy
 
How the Congressional Budget Office Assists Lawmakers
How the Congressional Budget Office Assists LawmakersHow the Congressional Budget Office Assists Lawmakers
How the Congressional Budget Office Assists Lawmakers
 
Introduction to the Role of the Congressional Budget Office
Introduction to the Role of the Congressional Budget OfficeIntroduction to the Role of the Congressional Budget Office
Introduction to the Role of the Congressional Budget Office
 
CBO’s Work on Health Care and a Call for New Research
CBO’s Work on Health Care and a Call for New ResearchCBO’s Work on Health Care and a Call for New Research
CBO’s Work on Health Care and a Call for New Research
 
The Federal Perspective on Coverage of Medications to Treat Obesity: Consider...
The Federal Perspective on Coverage of Medications to Treat Obesity: Consider...The Federal Perspective on Coverage of Medications to Treat Obesity: Consider...
The Federal Perspective on Coverage of Medications to Treat Obesity: Consider...
 
CBO’s Approach to Estimating the Budgetary Effects of the No Surprises Act of...
CBO’s Approach to Estimating the Budgetary Effects of the No Surprises Act of...CBO’s Approach to Estimating the Budgetary Effects of the No Surprises Act of...
CBO’s Approach to Estimating the Budgetary Effects of the No Surprises Act of...
 
The Budget and Economic Outlook for 2024 to 2034: Press Briefing Slides
The Budget and Economic Outlook for 2024 to 2034: Press Briefing SlidesThe Budget and Economic Outlook for 2024 to 2034: Press Briefing Slides
The Budget and Economic Outlook for 2024 to 2034: Press Briefing Slides
 
The Economic Outlook for 2024 to 2034 in 19 Slides
The Economic Outlook for 2024 to 2034 in 19 SlidesThe Economic Outlook for 2024 to 2034 in 19 Slides
The Economic Outlook for 2024 to 2034 in 19 Slides
 
Using Multiple Data Sources to Learn About the Race and Ethnicity of Taxpayers
Using Multiple Data Sources to Learn About the Race and Ethnicity of TaxpayersUsing Multiple Data Sources to Learn About the Race and Ethnicity of Taxpayers
Using Multiple Data Sources to Learn About the Race and Ethnicity of Taxpayers
 
Perspectives on the Navy’s 2024 Shipbuilding Plan
Perspectives on the Navy’s 2024 Shipbuilding PlanPerspectives on the Navy’s 2024 Shipbuilding Plan
Perspectives on the Navy’s 2024 Shipbuilding Plan
 
The 2024 Outlook for Navy Shipbuilding: Familiar Plans and Higher Costs
The 2024 Outlook for Navy Shipbuilding: Familiar Plans and Higher CostsThe 2024 Outlook for Navy Shipbuilding: Familiar Plans and Higher Costs
The 2024 Outlook for Navy Shipbuilding: Familiar Plans and Higher Costs
 
CBO’s Use of GitHub
CBO’s Use of GitHubCBO’s Use of GitHub
CBO’s Use of GitHub
 
Exploring the Effects of Medicaid During Childhood on the Economy and the Budget
Exploring the Effects of Medicaid During Childhood on the Economy and the BudgetExploring the Effects of Medicaid During Childhood on the Economy and the Budget
Exploring the Effects of Medicaid During Childhood on the Economy and the Budget
 
CBO’s Role and Most Recent Long-Term Budget Projections
CBO’s Role and Most Recent Long-Term Budget ProjectionsCBO’s Role and Most Recent Long-Term Budget Projections
CBO’s Role and Most Recent Long-Term Budget Projections
 
Atlas of Military Compensation
Atlas of Military CompensationAtlas of Military Compensation
Atlas of Military Compensation
 
Approaches to Estimating the Noncyclical Rate of Unemployment
 Approaches to Estimating the Noncyclical Rate of Unemployment Approaches to Estimating the Noncyclical Rate of Unemployment
Approaches to Estimating the Noncyclical Rate of Unemployment
 
CBO’s Analysis of the Long-Term Budgetary Outlook
CBO’s Analysis of the Long-Term Budgetary OutlookCBO’s Analysis of the Long-Term Budgetary Outlook
CBO’s Analysis of the Long-Term Budgetary Outlook
 
Projecting the Effects of U.S. Federal Policies on Electric Vehicle Demand an...
Projecting the Effects of U.S. Federal Policies on Electric Vehicle Demand an...Projecting the Effects of U.S. Federal Policies on Electric Vehicle Demand an...
Projecting the Effects of U.S. Federal Policies on Electric Vehicle Demand an...
 
CBO’s Recent Appeals for New Research to Enhance Its Work for the Congress
CBO’s Recent Appeals for New Research to Enhance Its Work for the CongressCBO’s Recent Appeals for New Research to Enhance Its Work for the Congress
CBO’s Recent Appeals for New Research to Enhance Its Work for the Congress
 
Trends in the Distribution of Household Income From 1979 to 2020
Trends in the Distribution of Household Income From 1979 to 2020Trends in the Distribution of Household Income From 1979 to 2020
Trends in the Distribution of Household Income From 1979 to 2020
 

Recently uploaded

complaint-ECI-PM-media-1-Chandru.pdfra;;prfk
complaint-ECI-PM-media-1-Chandru.pdfra;;prfkcomplaint-ECI-PM-media-1-Chandru.pdfra;;prfk
complaint-ECI-PM-media-1-Chandru.pdfra;;prfkbhavenpr
 
Global Terrorism and its types and prevention ppt.
Global Terrorism and its types and prevention ppt.Global Terrorism and its types and prevention ppt.
Global Terrorism and its types and prevention ppt.NaveedKhaskheli1
 
Manipur-Book-Final-2-compressed.pdfsal'rpk
Manipur-Book-Final-2-compressed.pdfsal'rpkManipur-Book-Final-2-compressed.pdfsal'rpk
Manipur-Book-Final-2-compressed.pdfsal'rpkbhavenpr
 
57 Bidens Annihilation Nation Policy.pdf
57 Bidens Annihilation Nation Policy.pdf57 Bidens Annihilation Nation Policy.pdf
57 Bidens Annihilation Nation Policy.pdfGerald Furnkranz
 
VIP Girls Available Call or WhatsApp 9711199012
VIP Girls Available Call or WhatsApp 9711199012VIP Girls Available Call or WhatsApp 9711199012
VIP Girls Available Call or WhatsApp 9711199012ankitnayak356677
 
Rohan Jaitley: Central Gov't Standing Counsel for Justice
Rohan Jaitley: Central Gov't Standing Counsel for JusticeRohan Jaitley: Central Gov't Standing Counsel for Justice
Rohan Jaitley: Central Gov't Standing Counsel for JusticeAbdulGhani778830
 
16042024_First India Newspaper Jaipur.pdf
16042024_First India Newspaper Jaipur.pdf16042024_First India Newspaper Jaipur.pdf
16042024_First India Newspaper Jaipur.pdfFIRST INDIA
 
IndiaWest: Your Trusted Source for Today's Global News
IndiaWest: Your Trusted Source for Today's Global NewsIndiaWest: Your Trusted Source for Today's Global News
IndiaWest: Your Trusted Source for Today's Global NewsIndiaWest2
 
Experience the Future of the Web3 Gaming Trend
Experience the Future of the Web3 Gaming TrendExperience the Future of the Web3 Gaming Trend
Experience the Future of the Web3 Gaming TrendFabwelt
 
Quiz for Heritage Indian including all the rounds
Quiz for Heritage Indian including all the roundsQuiz for Heritage Indian including all the rounds
Quiz for Heritage Indian including all the roundsnaxymaxyy
 

Recently uploaded (10)

complaint-ECI-PM-media-1-Chandru.pdfra;;prfk
complaint-ECI-PM-media-1-Chandru.pdfra;;prfkcomplaint-ECI-PM-media-1-Chandru.pdfra;;prfk
complaint-ECI-PM-media-1-Chandru.pdfra;;prfk
 
Global Terrorism and its types and prevention ppt.
Global Terrorism and its types and prevention ppt.Global Terrorism and its types and prevention ppt.
Global Terrorism and its types and prevention ppt.
 
Manipur-Book-Final-2-compressed.pdfsal'rpk
Manipur-Book-Final-2-compressed.pdfsal'rpkManipur-Book-Final-2-compressed.pdfsal'rpk
Manipur-Book-Final-2-compressed.pdfsal'rpk
 
57 Bidens Annihilation Nation Policy.pdf
57 Bidens Annihilation Nation Policy.pdf57 Bidens Annihilation Nation Policy.pdf
57 Bidens Annihilation Nation Policy.pdf
 
VIP Girls Available Call or WhatsApp 9711199012
VIP Girls Available Call or WhatsApp 9711199012VIP Girls Available Call or WhatsApp 9711199012
VIP Girls Available Call or WhatsApp 9711199012
 
Rohan Jaitley: Central Gov't Standing Counsel for Justice
Rohan Jaitley: Central Gov't Standing Counsel for JusticeRohan Jaitley: Central Gov't Standing Counsel for Justice
Rohan Jaitley: Central Gov't Standing Counsel for Justice
 
16042024_First India Newspaper Jaipur.pdf
16042024_First India Newspaper Jaipur.pdf16042024_First India Newspaper Jaipur.pdf
16042024_First India Newspaper Jaipur.pdf
 
IndiaWest: Your Trusted Source for Today's Global News
IndiaWest: Your Trusted Source for Today's Global NewsIndiaWest: Your Trusted Source for Today's Global News
IndiaWest: Your Trusted Source for Today's Global News
 
Experience the Future of the Web3 Gaming Trend
Experience the Future of the Web3 Gaming TrendExperience the Future of the Web3 Gaming Trend
Experience the Future of the Web3 Gaming Trend
 
Quiz for Heritage Indian including all the rounds
Quiz for Heritage Indian including all the roundsQuiz for Heritage Indian including all the rounds
Quiz for Heritage Indian including all the rounds
 

CBO's 2011 Long-Term Projections for Social Security: Additional Information

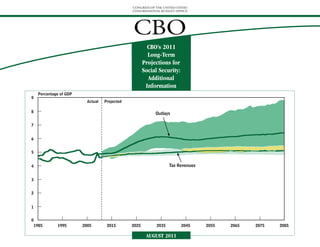
  • 1. CONGRESS OF THE UNITED STATES CONGRESSIONAL BUDGET OFFICE CBO CBO’s 2011 Long-Term Projections for Social Security: Additional Information Percentage of GDP 9 Actual Projected 8 Outlays 7 6 5 4 Tax Revenues 3 2 1 0 1985 1995 2005 2015 2025 2035 2045 2055 2065 2075 2085 AUGUST 2011
  • 3. CBO CBO’s 2011 Long-Term Projections for Social Security: Additional Information August 2011 The Congress of the United States O Congressional Budget Office
  • 4. Notes and Definitions Unless otherwise noted, all years referred to are calendar years. Numbers in the text and tables may not add up to totals because of rounding. Supplemental data are posted on CBO’s Web site (www.cbo.gov). For 2011, the Social Security payroll tax on employees was reduced by 2 percentage points; the reduction in Social Security tax revenues is being made up by reimbursements from the Treasury’s general fund. In this report, Social Security tax revenues include those reimbursements. 80 percent range of uncertainty: A range of uncertainty based on a distribution of 500 simulations from CBO’s long-term model. Outcomes were above the range in 10 percent of the simulations, below the range in 10 percent, and within the range in 80 percent. Median: The middle of the distribution. When the median outcome for a group of people (defined in this document by birth cohort and lifetime earnings category) is shown, the value is lower for half of the people in that group and higher for half of the group. Present value: A single number that expresses a flow of current and future income, or payments, in terms of an equivalent lump sum received or paid today. Cost rate: The present value of outlays for a period, plus the present value of a year’s worth of benefits as a reserve at the end of the period, divided by the present value of the stream of gross domestic product (or taxable payroll) over the same period. Income rate: The present value of tax revenues for a period, plus the trust funds’ initial balance, divided by the present value of the stream of gross domestic product (or taxable payroll) over the same period. Actuarial balance: The difference between the income rate and the cost rate. Scheduled benefits: Full benefits as calculated under current law, regardless of the amounts available in the Social Security trust funds. Payable benefits: Benefits as calculated under current law, reduced as necessary to make outlays equal the Social Security system’s revenues. Upon exhaustion of the Social Security trust funds, the Social Security Administration would reduce all scheduled benefits such that outlays from the funds would equal revenues flowing into the funds. Replacement rate: Annual benefits as a percentage of annual lifetime earnings. CBO
  • 5. Preface T his Congressional Budget Office (CBO) publication provides additional information about long-term projections of the Social Security program’s finances that were included in CBO’s 2011 Long-Term Budget Outlook (June 2011). Those projections, which cover the 75-year period spanning 2011 to 2085, and the additional information presented in this document update projections CBO prepared last year and reported in CBO’s 2010 Long-Term Projections for Social Security: Additional Information. The analysis was prepared by Noah Meyerson, Charles Pineles-Mark, Jonathan Schwabish, Michael Simpson, and Julie Topoleski of CBO’s Long-Term Modeling Group under the supervision of Joyce Manchester. John Skeen edited the document, and Kate Kelly proofread it. Maureen Costantino designed the cover, and Jeanine Rees prepared the document for publication. Monte Ruffin produced the initial printed copies, and Linda Schimmel handled the print distribution. The report is available on the agency’s Web site (www.cbo.gov). Douglas W. Elmendorf Director August 2011 CBO
  • 6. List of Exhibits Exhibit Page System Finances 1. Social Security Tax Revenues and Outlays, with Scheduled Benefits (Figure) 6 2. Social Security Tax Revenues and Outlays, with Scheduled Benefits (Table) 7 3. Percentage of Simulations in Which Social Security Outlays Exceed Tax Revenues by Specified Percentages, with Scheduled Benefits 8 4. Social Security Tax Revenues and Outlays, with Scheduled and Payable Benefits 9 5. Summarized Financial Measures for Social Security Under the Extended-Baseline Scenario, with Scheduled Benefits 10 6. Summarized Financial Measures for Social Security Under the Alternative Fiscal Scenario, with Scheduled Benefits 11 7. Trust Fund Ratio, with Scheduled Benefits 12 8. Percentage of Simulations That Show the Social Security Trust Funds Exhausted by a Particular Year 13 Distribution of Benefits 9. Median Initial Benefits for Retired Workers, with Scheduled and Payable Benefits 15 10. Median Initial Replacement Rates for Retired Workers, with Scheduled and Payable Benefits 16 11. Median Present Value of Lifetime Benefits for Retired Workers, with Scheduled and Payable Benefits 17 12. Median Benefits and Initial Replacement Rates for Disabled Workers, with Scheduled and Payable Benefits 18 13. Potential Range of Lifetime Social Security Payroll Taxes 19 14. Potential Range of Lifetime Social Security Benefits, with Scheduled and Payable Benefits 20 15. Potential Range of Lifetime Benefit-to-Tax Ratios, with Scheduled and Payable Benefits 21 16. Percentage of Simulations in Which Payable Benefits Exceed Specified Percentages of Scheduled Benefits 22 CBO
  • 7. CBO’s 2011 Long-Term Projections for Social Security: Additional Information Social Security is the federal government’s largest employed workers, who pay the entire 12.4 percent In calendar year 2010, for the first time since the single program.1 About 56 million people will tax on earnings themselves).2 The payroll tax enactment of the Social Security Amendments of receive Social Security benefits this year, the applies only to taxable earnings—earnings up to 1983, annual outlays for the program exceeded Congressional Budget Office (CBO) estimates. a maximum annual amount ($106,800 in 2011). annual revenues excluding interest credited to About 69 percent are retired workers, their Some Social Security benefits also are subject to the trust funds. CBO projects that the gap will spouses, and children, and another 12 percent are taxation: This year, about 3 percent of Social continue: Over the next five years, outlays will be survivors of deceased workers; all of those benefi- Security’s tax revenues will come from the income about 5 percent greater than such revenues. ciaries receive payments through Old-Age and taxes that higher-income beneficiaries pay on However, as more members of the baby-boom Survivors Insurance (OASI). The other 19 percent their Social Security benefits. Tax revenues credited generation (that is, people born between 1946 are disabled workers or their spouses and children; to the program will total $687 billion in fiscal and 1964) enter retirement, outlays will increase they receive Disability Insurance (DI) benefits. year 2011. relative to the size of the economy, whereas tax rev- CBO projects that in fiscal year 2011, Social enues will remain at an almost constant share of Security’s outlays will total $733 billion, one-fifth Revenues from taxes, along with intragovern- the economy. As a result, the shortfall will begin to of the federal budget; OASI payments will account mental interest payments, are credited to Social grow around 2017. for about 82 percent of those outlays, and DI Security’s two trust funds—one for OASI and one payments, about 18 percent. for DI—and the program’s benefits and adminis- CBO projects that the DI trust fund will be trative costs are paid from those funds. Legally, the exhausted in 2017 and that the OASI trust fund Social Security has two primary sources of tax reve- funds are separate, but they often are described col- will be exhausted in 2040. Once a trust fund’s bal- nues: payroll taxes and income taxes on benefits. lectively as the OASDI trust funds. In a given year, ance has fallen to zero and current revenues are This year, roughly 97 percent of tax revenues dedi- the sum of receipts to a fund along with the inter- insufficient to cover the benefits that are specified cated to Social Security will be collected from a est that is credited on previous balances, minus in law, the corresponding program will be unable payroll tax of 12.4 percent that is levied on earn- spending for benefits and administrative costs, to pay full benefits without changes in law. The DI ings and split evenly between workers and their constitutes that fund’s surplus or deficit. trust fund came close to exhaustion in 1994, but employers at 6.2 percent apiece (except for self- that outcome was prevented by legislation that redirected revenues from the OASI trust fund to 2. The workers’ portion of the payroll tax was reduced by the DI trust fund. In part because of that experi- 1. For a description of the Social Security program, see 2 percentage points for 2011 (as was the tax on the self- ence, it is a common analytical convention to Congressional Budget Office, Social Security Policy Options employed), and the reduction in tax revenues is being (July 2010), “An Overview of Social Security,” pp. 1–4. made up by reimbursements from the Treasury’s general consider the DI and OASI trust funds as com- Social Security’s financing and trust funds are discussed on fund. In this report, Social Security tax revenues include bined. CBO projects that, if legislation to shift pp. 3–5 of that study. those reimbursements. resources from the OASI trust fund to the DI trust CBO
  • 8. INTRODUCTION CBO’S 2011 LONG-TERM PROJECTIONS FOR SOCIAL SECURITY: ADDITIONAL INFORMATION 2 fund was enacted, the combined OASDI trust The first, CBO’s extended-baseline scenario, fund balances would remain essentially at zero. funds would be exhausted in 2038. adheres closely to current law. For example, that When presenting projections of Social Security’s scenario reflects the assumption that the cuts in finances, CBO generally focuses on scheduled The amount of Social Security taxes paid by vari- individual income taxes enacted since 2001 and benefits because, by definition, the system would ous groups of people differs, as do the benefits that most recently extended in 2010 expire as scheduled be fully financed if payable benefits were all that different groups receive. For example, people with in 2012 and 2013. CBO also has developed an was disbursed. higher earnings pay more in Social Security payroll alternative fiscal scenario, which incorporates sev- taxes than do lower-earning participants, and they eral changes to current law that are widely expected Quantifying Uncertainty also receive larger benefits (although not propor- to occur or that would modify some provisions of To quantify the amount of uncertainty in its Social tionately larger). Because of the progressive nature law that might be difficult to sustain for a long Security projections, CBO created a distribution of Social Security’s benefit formula, replacement period. Unless otherwise noted, the projections of outcomes from 500 simulations using its long- rates—annual benefits as a percentage of annual presented in this analysis are based on the assump- term model. In those simulations, the assumed lifetime earnings—are lower, on average, for work- tions of the extended-baseline scenario. In that values for most of the key demographic and eco- ers who have had higher earnings. As another scenario, income taxes, including the income taxes nomic factors that underlie the analysis—for example, the amount of taxes paid and benefits on Social Security benefits that are credited to the example, fertility and mortality rates, interest rates, received will be greater for people in later birth trust funds, are higher than they are in the alterna- and the rate of growth of productivity—were var- cohorts because they typically will have higher tive fiscal scenario. ied on the basis of historical patterns of variation.4 earnings over a lifetime, even after an adjustment Several of the exhibits in this publication show the for inflation, CBO projects. However, initial Scheduled and Payable Benefits simulations’ 80 percent range of uncertainty: That replacement rates will be slightly lower, on average, CBO prepares two types of benefit projections. is, in 80 percent of the 500 simulations, the value for people in later birth groups because their full Benefits as calculated under the Social Security in question fell within the range shown; in 10 per- retirement age (the age at which they can receive Act, regardless of the balances in the trust funds, cent of the simulations, the values were above that unreduced retirement benefits) will be higher. The are called scheduled benefits. However, the Social range; and in 10 percent they were below. Long- increase in that age is equivalent to a reduction in Security Administration has no legal authority to term projections are necessarily uncertain, and that benefits at any age at which benefits are claimed. pay scheduled benefits if their amounts exceed the uncertainty is illustrated in this publication; never- balances in the trust funds. Therefore, if the trust theless, the general conclusions of this analysis are funds became exhausted, payments to current and unchanged under a variety of assumptions. About This Analysis new beneficiaries would need to be reduced to CBO regularly prepares long-term projections of make the outlays from the funds equal the revenues System Finances revenues and outlays for the Social Security pro- flowing into the funds.3 Benefits thus reduced are The first part of this publication (Exhibits 1 gram. The most recent projections, for the 75 years called payable benefits. In such a case, all receipts through 8) examines Social Security’s financial from 2011 through 2085, were published in Chap- to the trust funds would be used, and the trust ter 4 of CBO’s 2011 Long-Term Budget Outlook (June 2011). This publication presents additional 4. For more information, see Congressional Budget Office, information about those projections. 3. See Christine Scott, Social Security: What Would Happen If Quantifying Uncertainty in the Analysis of Long-Term Social the Trust Funds Ran Out? Report for Congress RL33514 Security Projections, Background Paper (November 2005). The budget projections published in CBO’s 2011 (Congressional Research Service, updated August 20, The methodology used here differs slightly from the Long-Term Budget Outlook involved two scenarios: 2009). techniques described in that report. CBO
  • 9. INTRODUCTION CBO’S 2011 LONG-TERM PROJECTIONS FOR SOCIAL SECURITY: ADDITIONAL INFORMATION 3 status from several vantage points. The fullest per- estimates for individuals; household status is used Changes in CBO’s Long-Term spective is provided by projected streams of annual only to place people into earnings groups. revenues and outlays. A more succinct analysis is Social Security Projections Since given by measures that summarize the annual In this part of the analysis, benefits are calculated 2010 streams in a single number. The system’s finances net of income taxes paid on benefits by higher- The shortfalls for Social Security that CBO is cur- are also described by projecting what is called the income recipients and credited to the Social rently projecting are marginally smaller than those trust fund ratio, the amount in the trust funds at Security trust funds.6 Median values are estimated projected in CBO’s 2010 Long-Term Projections for the beginning of a year in proportion to the outlays for each group: Estimates for half of the people in Social Security: Additional Information (October in that year. the group are lower, and estimates for half are 2010). The 75-year imbalance is almost higher. unchanged. It has decreased from 1.63 percent Distribution of Benefits Most retired and disabled workers receive Social to 1.58 percent of taxable payroll under the In the second part (Exhibits 9 through 16), Security benefits on the basis of their own work extended-baseline scenario (see Exhibit 5), and CBO examines the program’s effects on people by history. This publication first presents measures of from 2.06 percent to 2.00 percent of taxable pay- grouping Social Security participants by various those benefits that do not include benefits received roll under the alternative fiscal scenario (see characteristics and presenting the average taxes and by dependents or survivors who are entitled to Exhibit 6). benefits for those groups. In its analysis, CBO them on the basis of another person’s work history. divided people into groups by the decade in which When measured as a share of taxable payroll, long- Then, for a more comprehensive perspective on the term tax revenues and outlays are both slightly they were born and by the quintile of their lifetime distribution of Social Security benefits, this analy- household earnings.5 For example, one 10-year lower than those projected in 2010. The 75-year sis presents measures of the total amount of Social income rate—a measure of Social Security’s tax cohort consists of people born in the 1940s, and Security payroll taxes that each participant pays the top fifth of earners constitutes the highest earn- revenues—is about 0.4 percent lower under both over his or her lifetime as well as the total Social scenarios because revenues from income taxes on ings quintile. CBO’s modeling approach produces Security benefits—including payments received as benefits are projected to be slightly lower. The a worker’s dependent or as a survivor—that each 75-year cost rate—a measure of outlays—is about receives over a lifetime. 0.7 percent lower. Outlays are a slightly higher 5. Each person who lives at least to age 45 is ranked by life- share of taxable payroll over the next decade time household earnings. Lifetime earnings for someone who is single in all years equals the present value of his or because of near-term economic weakness, but they her real (inflation-adjusted) earnings over a lifetime. In are lower after 2025, primarily because CBO now any year that a person is married, the earnings measure is a assumes higher immigration rates and projects function of his or her earnings plus those of his or her slightly faster growth in real (inflation-adjusted) spouse (adjusted for economies of scale in household wages than it did in 2010.7 consumption). A person’s lifetime earnings consist of the present value of those annual amounts. To compute pres- ent values in Social Security analyses, CBO uses a real discount rate of 3.0 percent, which equals the long-term 6. Benefits are not reduced by the portion of those income 7. See Congressional Budget Office, CBO’s 2011 Long-Term rate used to compute interest for the Social Security trust taxes that is credited to Medicare’s Hospital Insurance Budget Outlook (June 2011), Appendix A, “Changes in funds. Trust Fund. CBO’s Long-Term Projections Since June 2010.” CBO
  • 10. INTRODUCTION CBO’S 2011 LONG-TERM PROJECTIONS FOR SOCIAL SECURITY: ADDITIONAL INFORMATION 4 When measured as a share of gross domestic prod- Related CBO Analyses in CBO’s Long-Term Model: An Overview, uct (GDP), however, the projections of the income Background Paper (June 2009). Further information about Social Security and rate and the cost rate are slightly higher than they CBO’s projections is available in other CBO For an explanation of the values used for were in last year’s report. Social Security’s taxable B publications: the demographic and economic variables payroll is a larger share of GDP in this year’s report because CBO’s projection of the share of compen- B Various approaches to changing the program underlying the projections, see “CBO’s Long- sation that workers receive as wages is higher than are presented in Social Security Policy Options Term Economic Benchmark” in CBO’s 2011 it was last year. (The change stems from a revision (July 2010). Long-Term Budget Outlook, pp. 22–26. (The to CBO’s estimate of how people will respond to projections are based on the demographic the excise tax on certain employment-based health B The current long-term projections are consis- assumptions of the 2010 report of the Social insurance plans that was established by the March tent with the 10-year baseline CBO published Security trustees, except for the assumptions 2010 health care legislation.)8 The 75-year imbal- in An Analysis of the President’s Budgetary about immigration, which are CBO’s.)9 ance measured as a share of GDP is marginally less Proposals for Fiscal Year 2012 (April 2011). than was projected in 2010 (just as it is when (Data in that report and in CBO’s 2011 Long- B For an “infographic” summarizing some of measured as a share of taxable payroll). Under the Term Budget Outlook are generally presented for CBO’s projections and providing background extended-baseline scenario, it has decreased from fiscal years; this analysis and Social Security information, see CBO’s Long-Term Projections: 0.60 percent of GDP to 0.58 percent, and under Policy Options use calendar year data.) Social Security (August 2011). the alternative fiscal scenario, it has decreased from The current projections update those in CBO’s B Numerous other aspects of the program are 0.75 percent to 0.74 percent. B 2010 Long-Term Projections for Social Security: addressed in various publications available from Additional Information. Differences in the two CBO’s Web site. sets of projections are the result of newly avail- able programmatic and economic data, updated assumptions about future economic trends, and 9. See Social Security Administration, The 2010 Annual improvements in models. Report of the Board of Trustees of the Federal Old-Age and Survivors Insurance and Federal Disability Insurance Trust 8. See Congressional Budget Office, CBO’s 2011 Long-Term B The methodology used to develop the Funds (August 9, 2010), www.ssa.gov/oact/TR/2010/ Budget Outlook, p. 74. projections in this publication is described tr2010.pdf. CBO
  • 12. SYSTEM FINANCES CBO’S 2011 LONG-TERM PROJECTIONS FOR SOCIAL SECURITY: ADDITIONAL INFORMATION 6 Exhibit 1. In 2010, Social Security’s total outlays (benefits Social Security Tax Revenues and Outlays, with Scheduled Benefits plus administrative costs) equaled 4.9 percent of the country’s gross domestic product (GDP); tax (Percentage of gross domestic product) revenues dedicated to the program equaled 4.6 per- 9 cent of GDP. Most of the program’s tax revenues Actual Projected come from Social Security payroll taxes, although a 8 Outlaysb small portion comes from income taxes on benefits paid to higher-income beneficiaries. In addition to 7 those tax revenues, the trust funds are credited with Tax Revenuesa 6 interest. During the next few decades, the number of benefi- 5 ciaries will grow as the baby-boom generation ages, 4 and by 2035, scheduled spending will climb to Tax Revenuesa 6.1 percent of GDP, CBO estimates. Over the 3 Outlaysb ensuing decade, spending will decline slightly, rela- tive to the size of the economy, as people in the 2 baby-boom generation die. Demographers gener- 1 ally predict that life expectancy will continue to rise and that birth rates will remain as they are now, so 0 scheduled outlays are projected to resume their 1985 1995 2005 2015 2025 2035 2045 2055 2065 2075 2085 upward trajectory around 2050, reaching 6.4 per- Source: Congressional Budget Office. cent of GDP in 2085. Note: The lines indicate CBO’s projections of expected outcomes. The shaded areas indicate the 80 percent The amount of tax revenues credited to the trust range of uncertainty. funds is projected to grow slightly as a share of a. Includes payroll taxes and income taxes on benefits. GDP over the next 75 years, rising from 4.6 per- cent of GDP in 2010 to 4.9 percent in 2035 and b. Includes scheduled benefits and administrative costs. then edging up to 5.1 percent in 2085. Three factors are important in determining that pattern. First, revenues from payroll taxes will increase as the economy recovers. Second, CBO projects that although people’s total compensation will be nearly constant as a percentage of GDP in the long run, the share of compensation that workers receive as wages will rise from 81 percent in 2021 to 84 percent in about 2050 as the excise tax on high- premium health insurance plans causes some employers and workers to shift to less expensive plans. Subsequently, as the cost of health care continues to rise, the share of compensation CBO (Continued)
  • 13. SYSTEM FINANCES CBO’S 2011 LONG-TERM PROJECTIONS FOR SOCIAL SECURITY: ADDITIONAL INFORMATION 7 Exhibit 2. received as wages will fall, ending up back near Social Security Tax Revenues and Outlays, with Scheduled Benefits 81 percent by 2085. Third, when earnings inequal- ity increases (and the distribution of earnings wid- (Percentage of gross domestic product) ens), as it has in recent decades, the taxable share Actual Projected of earnings declines because more earnings are 2010 2035 2060 2085 above the maximum amount that is taxed for Social Tax Revenues 4.59 4.93 5.11 5.11 Security. CBO projects that earnings inequality will Outlays 4.88 6.13 6.09 6.41 increase somewhat during the next few decades and Difference -0.28 -1.20 -0.97 -1.30 that the share of earnings subject to the payroll tax, which has been above 85 percent in recent years, 80 Percent Range of Uncertainty for CBO's Projections will decline to around 82 percent in 2035. Tax Revenues 4.8 to 5.1 4.9 to 5.4 4.8 to 5.5 The uncertainty in CBO’s projections for Social Outlays 5.3 to 7.3 5.0 to 7.8 5.1 to 8.8 Security is illustrated by the range of the outcomes Differencea -2.2 to -0.5 -2.6 to 0.1 -3.6 to -0.2 from a series of 500 simulations that vary most of the key demographic and economic factors in the Source: Congressional Budget Office. analysis according to historical patterns. Although Note: Tax revenues consist of payroll taxes and income taxes on benefits that are credited to the Social Security CBO projects that the program’s outlays will equal trust funds in the specified year. Outlays consist of scheduled benefits and administrative costs; scheduled 6.1 percent of GDP in 2035, in 10 percent of the benefits are benefits as calculated under the Social Security Act, regardless of the balances in the trust simulations outlays in 2035 are below 5.3 percent funds. of GDP, and in 10 percent they exceed 7.3 percent a. The differences displayed generally do not equal the difference between the outlays and revenues shown of GDP. In most simulations, outlays in 2035 are because the low and high values of the ranges (for tax revenues, outlays, and the difference) are drawn from projected to account for a much larger share of different simulations. GDP than the current 4.9 percent. Because payroll taxes are a fixed share of taxable earnings and because earnings generally grow with GDP, there is less uncertainty about tax revenues as a share of GDP than there is about outlays. The range of uncertainty reported here is larger than that shown in CBO’s 2010 Long-Term Projections for Social Security: Additional Information. That report incorporated the estimated effects of the health care legislation enacted in March 2010 on the share of compensation paid in wages but (because the tim- ing of the report did not allow for doing so) did not incorporate variation in that share into the analysis of uncertainty. The range of uncertainty presented in the current analysis is similar to what CBO reported in 2009.  CBO
  • 14. SYSTEM FINANCES CBO’S 2011 LONG-TERM PROJECTIONS FOR SOCIAL SECURITY: ADDITIONAL INFORMATION 8 Exhibit 3. Another perspective on the uncertainty in Percentage of Simulations in Which Social Security Outlays Exceed projections of Social Security’s finances Tax Revenues by Specified Percentages, with Scheduled Benefits involves the percentage of CBO’s simulations in which total outlays exceed tax revenues by (Percent) a given amount in a particular year. In the By 0 Percent of By 1 Percent of By 2 Percent of By 3 Percent of By 4 Percent of By 5 Percent of 500 simulations, most of the key demographic GDP or More GDP or More GDP or More GDP or More GDP or More GDP or More and economic factors in the analysis vary 2020 93 9 0 0 0 0 according to historical patterns. In 99 percent 2030 99 60 11 1 0 0 of them, outlays equal or exceed tax revenues 2040 97 57 13 1 0 0 in 2030. Outlays are at least 1 percentage 2050 89 45 11 2 0 0 point greater than tax revenues (when both are 2060 89 52 19 6 1 0 measured as shares of GDP) in 60 percent of 2070 91 59 25 10 4 1 simulations for that year and at least 2 per- 2080 93 66 31 13 5 2 centage points greater in 11 percent of those simulations. In later decades, projections of Source: Congressional Budget Office. outlays are less certain. As a result, the percent- Notes: Tax revenues consist of payroll taxes and income taxes on benefits that are credited to the Social Security age of simulations in which outlays equal or trust funds in the specified year. Outlays consist of scheduled benefits and administrative costs; scheduled exceed tax revenues is a slightly smaller share benefits are benefits as calculated under the Social Security Act, regardless of the balances in the trust than in 2030 but remains close to 90 percent funds. This analysis is based on 500 simulations from CBO's long-term model. in 2050 and beyond. The increase in uncer- tainty about outlays also causes the portion of GDP = gross domestic product. simulations in which outlays exceed tax revenues (as shares of GDP) by at least 2 per- centage points to rise; that portion reaches 31 percent by 2080.  CBO
  • 15. SYSTEM FINANCES CBO’S 2011 LONG-TERM PROJECTIONS FOR SOCIAL SECURITY: ADDITIONAL INFORMATION 9 Exhibit 4. The projected gap between outlays and reve- Social Security Tax Revenues and Outlays, with Scheduled and nues ultimately will eliminate the balance in Payable Benefits the trust funds and make it impossible, under current law, to pay the full amount of sched- (Percentage of gross domestic product) uled benefits. Payable benefits will equal 7 scheduled benefits until the trust funds are Actual Projected Outlays with Scheduled Benefitsb exhausted; after that, they will equal the Social 6 Security program’s annual revenues. CBO projects that the trust funds will be exhausted 5 in 2038. In the following year, revenues are Tax Revenuesa projected to equal 81 percent of scheduled Outlays with Payable Benefitsb 4 Outlaysb outlays. Thus, payable benefits will be 19 per- cent lower than scheduled benefits. The gap 3 between scheduled and payable benefits will shrink slightly for the following decade, falling 2 to 15 percent in 2050. It will then widen, and by 2085, payable benefits will be 23 percent 1 smaller than scheduled benefits.  0 1985 1995 2005 2015 2025 2035 2045 2055 2065 2075 2085 Source: Congressional Budget Office. a. Includes payroll taxes and income taxes on benefits. Tax revenues shown are consistent with payable benefits and would decline slightly if the trust funds became exhausted because revenues from income taxes paid on benefits would decline. b. Includes benefits and administrative costs. CBO
  • 16. SYSTEM FINANCES CBO’S 2011 LONG-TERM PROJECTIONS FOR SOCIAL SECURITY: ADDITIONAL INFORMATION 10 Exhibit 5. To present the results of long-term projections Summarized Financial Measures for Social Security Under the succinctly, analysts often summarize scheduled Extended-Baseline Scenario, with Scheduled Benefits outlays and revenues as a single number that covers a given period (for example, total out- As a Percentage of GDP As a Percentage of Taxable Payroll lays over 75 years). The data are summarized Income Cost Actuarial Income Cost Actuarial by computing the present value of outlays or Rate Rate Balance Rate Rate Balance tax revenues for a period and dividing that fig- ure by the present value of the stream for GDP CBO's Projections (or taxable payroll) over the same period. 25 Years (2011–2035) 5.64 5.69 -0.05 15.28 15.42 -0.14 (Present value is a single number that expresses 50 Years (2011–2060) 5.38 5.80 -0.41 14.51 15.62 -1.11 a flow of current and future income, or pay- 75 Years (2011–2085) 5.31 5.90 -0.58 14.34 15.92 -1.58 ments, in terms of an equivalent lump sum 80 Percent Range of Uncertainty for CBO's Projectionsa received or paid today. That computation uses 25 Years (2011–2035) 5.5 to 5.8 5.2 to 6.2 -0.5 to 0.3 15.0 to 15.6 14.2 to 16.8 -1.3 to 0.9 the interest rate used to compute interest cred- 50 Years (2011–2060) 5.2 to 5.5 5.4 to 6.3 -0.9 to 0.0 14.3 to 14.8 14.5 to 17.1 -2.4 to -0.1 ited to the trust funds.) The income rate is the 75 Years (2011–2085) 5.2 to 5.5 5.4 to 6.5 -1.1 to -0.2 14.1 to 14.6 14.7 to 17.6 -3.1 to -0.6 present value of annual noninterest revenues (including the initial trust fund balance), and Source: Congressional Budget Office. the cost rate is the present value of annual out- lays (including a target trust fund balance at Note: Over the relevant periods, the income rate is the present value of annual tax revenues (plus the initial trust the end of the period), each divided by the fund balance), and the cost rate is the present value of annual outlays (plus the present value of a year’s present value of taxable payroll or GDP. The worth of benefits as a reserve at the end of the period), each divided by the present value of taxable actuarial balance is the difference between the payroll or gross domestic product (GDP). The actuarial balance is the difference between the income and income and cost rates. cost rates. a. The balances displayed generally do not equal the difference between the outlays and revenues shown This analysis focuses on CBO’s extended- because the low and high values of the ranges (for the income rate, the cost rate, and the actuarial balance) baseline scenario, which adheres closely to cur- are drawn from different simulations. rent law. In that scenario, federal income taxes on benefits would increase over time, and the estimated 75-year actuarial balance would be -0.58 percent of GDP or -1.58 percent of tax- able payroll. That means, for example, that if the Social Security payroll tax rate was increased immediately and permanently by 1.58 percentage points—from the current rate of 12.40 percent to 13.98 percent—or if scheduled benefits were reduced by an equiva- lent amount, then the trust funds’ projected balance at the end of 2085 would equal pro- jected outlays for 2086.  CBO
  • 17. SYSTEM FINANCES CBO’S 2011 LONG-TERM PROJECTIONS FOR SOCIAL SECURITY: ADDITIONAL INFORMATION 11 Exhibit 6. This publication focuses mostly on CBO’s Summarized Financial Measures for Social Security Under the extended-baseline scenario, which adheres Alternative Fiscal Scenario, with Scheduled Benefits closely to current law. CBO also has made long-term budget projections using an alterna- As a Percentage of GDP As a Percentage of Taxable Payroll tive fiscal scenario that incorporates several Income Cost Actuarial Income Cost Actuarial changes to current law that are widely expected Rate Rate Balance Rate Rate Balance to occur or that would modify some provisions CBO's Projections of law that might be difficult to sustain for a 25 Years (2011–2035) 5.58 5.69 -0.11 15.12 15.42 -0.30 long period. (Details of the two scenarios are 50 Years (2011–2060) 5.27 5.80 -0.53 14.20 15.62 -1.42 outlined in Table 1-1 of CBO’s 2011 Long- 75 Years (2011–2085) 5.16 5.90 -0.74 13.91 15.91 -2.00 Term Budget Outlook.) 80 Percent Range of Uncertainty for CBO's Projectionsa The financial outlook for Social Security is 25 Years (2011–2035) 5.4 to 5.7 5.2 to 6.2 -0.6 to 0.3 14.9 to 15.4 14.2 to 16.8 -1.5 to 0.8 less favorable under the alternative fiscal 50 Years (2011–2060) 5.1 to 5.4 5.4 to 6.3 -1.0 to -0.1 14.0 to 14.5 14.5 to 17.1 -2.8 to -0.4 scenario (shown in this exhibit) than under 75 Years (2011–2085) 5.0 to 5.3 5.4 to 6.5 -1.3 to -0.4 13.7 to 14.2 14.7 to 17.6 -3.5 to -1.0 the extended-baseline scenario (shown in Exhibit 5). Income taxes paid on benefits are Source: Congressional Budget Office. assumed to be lower under the alternative fis- cal scenario, resulting in lower revenues from Note: Over the relevant periods, the income rate is the present value of annual tax revenues (plus the initial trust the taxation of Social Security benefits and fund balance), and the cost rate is the present value of annual outlays (plus the present value of a year’s therefore a lower Social Security income rate. worth of benefits as a reserve at the end of the period), each divided by the present value of taxable Under the alternative fiscal scenario, the 75- payroll or gross domestic product (GDP). The actuarial balance is the difference between the income and year income rate is 5.16 percent of GDP, com- cost rates. pared with a rate of 5.31 percent under the a. The balances displayed generally do not equal the difference between the outlays and revenues shown extended-baseline scenario. As a result, the because the low and high values of the ranges (for the income rate, the cost rate, and the actuarial balance) 75-year actuarial deficit is larger: 0.74 percent are drawn from different simulations. of GDP or 2.00 percent of taxable payroll under the alternative fiscal scenario, compared with a deficit of 0.58 percent of GDP or 1.58 percent of taxable payroll under the extended-baseline scenario.  CBO
  • 18. SYSTEM FINANCES CBO’S 2011 LONG-TERM PROJECTIONS FOR SOCIAL SECURITY: ADDITIONAL INFORMATION 12 Exhibit 7. The trust fund ratio—the balance in the Social Trust Fund Ratio, with Scheduled Benefits Security trust funds at the beginning of the year divided by the system’s outlays projected 10 for that year—indicates the proportion of a Actual Projected year’s cost that could be paid with the funds 5 available. The trust fund ratio for 2010 was 3.6, and CBO projects that it will fall to 3.5 0 this year. The rate of decline will accelerate in subsequent decades, and the ratio will reach -5 zero in 2038, CBO projects. At that point, payments to current and new beneficiaries would need to be reduced to make the outlays -10 from the funds equal to the revenues flowing into the funds. -15 The year in which the trust funds will be -20 exhausted could differ significantly from CBO’s projection, however. In 10 percent of -25 CBO’s simulations, the trust funds are 1985 1995 2005 2015 2025 2035 2045 2055 2065 2075 2085 exhausted in 2030 or earlier, and in 10 per- cent, they are exhausted in 2059 or later; in Source: Congressional Budget Office. those simulations, most of the key demo- Note: The trust fund ratio is the ratio of the trust fund balance (the amount in the trust funds) at the beginning graphic and economic factors in the analysis of a year to outlays in that year. Outlays consist of benefits and administrative costs. The trust funds are were varied according to historical patterns. exhausted when the trust fund ratio reaches zero. Under current law, the trust funds cannot incur negative (The shaded area in the figure shows the balances. The negative balances shown in this exhibit indicate a projected shortfall, reflecting the trust 80 percent range of uncertainty. The inter- funds’ inability to pay scheduled benefits out of current-law revenues. The dark line indicates CBO’s section between the shaded area and the projection of expected outcomes; the shaded area indicates the 80 percent range of uncertainty around horizontal line at zero, spanning the years the projection. between 2030 and 2059, corresponds to the 80 percent range of uncertainty about the year in which the trust funds will become exhausted.) The negative balances represent CBO’s estimates of the cumulative amount of scheduled benefits that cannot be paid from the program’s current-law revenues (expressed as a ratio to outlays in each year).  CBO
  • 19. SYSTEM FINANCES CBO’S 2011 LONG-TERM PROJECTIONS FOR SOCIAL SECURITY: ADDITIONAL INFORMATION 13 Exhibit 8. An alternative way to consider uncertainty is Percentage of Simulations That Show the Social Security to examine the percentage of simulations in Trust Funds Exhausted by a Particular Year which the trust funds are exhausted by a spe- cific year. In those simulations, most of the key demographic and economic factors in the 100 analysis were varied according to historical pat- terns. In 42 percent of CBO’s simulations, the 80 funds are exhausted by 2035. In 84 percent of the simulations, the trust funds are exhausted by 2050. In 97 percent of the simulations, the 60 trust funds are exhausted by 2085.  40 20 0 2011 2016 2021 2026 2031 2036 2041 2046 2051 2056 2061 2066 2071 2076 2081 2085 Source: Congressional Budget Office. Note: The data are based on 500 simulations from CBO’s long-term model. CBO
  • 21. DISTRIBUTION OF BENEFITS CBO’S 2011 LONG-TERM PROJECTIONS FOR SOCIAL SECURITY: ADDITIONAL INFORMATION 15 Exhibit 9. Future retired workers are projected to receive Median Initial Benefits for Retired Workers, with Scheduled and higher initial annual Social Security benefits Payable Benefits than today’s beneficiaries receive—both sched- uled and payable benefits (net of income taxes (Thousands of 2011 dollars) paid on those benefits and adjusted for the Lowest Quintile of Middle Quintile of Highest Quintile of effects of inflation). 10-Year Lifetime Household Lifetime Household Lifetime Household CBO considered a hypothetical benefit Birth All Retired Workers Earnings Earnings Earnings amount: the median initial benefit a worker Cohort Scheduled Payable Scheduled Payable Scheduled Payable Scheduled Payable would receive if everyone claimed benefits at All age 65, based on earnings through age 61. The 1940s 16 16 9 9 18 18 24 24 median initial scheduled benefit rises over time 1960s 17 17 10 10 18 18 29 29 because of growth in average earnings. How- 1980s 21 18 12 11 22 19 38 32 ever, the effect of growing earnings will be 2000s 28 22 16 13 30 24 51 41 partly offset for several cohorts by the sched- Men uled rise in the full retirement age, from 65 for people born before 1938 to 67 for those born 1940s 20 20 10 10 21 21 26 26 after 1959. The effect is equivalent to a reduc- 1960s 20 20 11 11 21 21 31 31 tion in benefits at any age at which benefits are 1980s 24 20 13 12 25 21 40 35 2000s 32 26 18 14 33 27 54 44 claimed. Once the older retirement age is in place, median initial benefits will grow at Women about the same rate as median earnings. 1940s 13 13 8 8 14 14 20 20 When the trust funds are exhausted, payable 1960s 15 15 9 9 16 16 25 25 1980s 18 15 11 9 20 17 33 28 benefits will fall, but then they will rise again 2000s 24 19 14 11 26 21 45 36 as earnings (and therefore tax revenues) grow. Although payable initial benefits are lower than scheduled initial benefits for people born Source: Congressional Budget Office. in 1974 and later, they will be higher than cur- Note: Initial annual benefits are computed for all individuals who are eligible to claim retirement benefits at rent initial benefits, CBO projects. age 62 and who have not yet claimed any other benefit. All workers are assumed to claim benefits at age 65. All values are net of income taxes paid on benefits and credited to the Social Security trust funds. Projected benefits are lower for women than for men in all cohorts because women have lower average earnings; the gap is narrower (as a share of men’s benefits) for later cohorts because men’s and women’s earnings have become more equal. For the 1940s cohort, projected initial benefits for women are about 35 percent below those for men, but for the 1980s cohort and later groups, they are about CBO 25 percent below those for men. 
  • 22. DISTRIBUTION OF BENEFITS CBO’S 2011 LONG-TERM PROJECTIONS FOR SOCIAL SECURITY: ADDITIONAL INFORMATION 16 Exhibit 10. Initial replacement rates—initial annual bene- Median Initial Replacement Rates for Retired Workers, with fits net of income taxes paid on those benefits Scheduled and Payable Benefits as a percentage of average annual lifetime earn- ings—provide a perspective on retired workers’ (Percent) benefits that is different from that provided by Lowest Quintile of Middle Quintile of Highest Quintile of looking simply at dollar amounts. 10-Year Lifetime Household Lifetime Household Lifetime Household Several factors affect the patterns shown here. Birth All Retired Workers Earnings Earnings Earnings First, the progressive nature of Social Security’s Cohort Scheduled Payable Scheduled Payable Scheduled Payable Scheduled Payable benefit formula results in replacement rates All that are higher for workers within a birth 1940s 45 45 71 71 43 43 30 30 cohort who have had lower earnings. Second, 1960s 42 42 62 62 41 41 28 28 with payable benefits, the replacement rate will 1980s 43 37 64 56 42 36 28 24 drop noticeably at all earnings amounts for 2000s 42 34 62 50 41 33 27 22 people in the cohorts that first receive benefits Men after the trust funds are exhausted. 1940s 40 40 65 65 39 39 25 25 Third, the scheduled increase in the full retire- 1960s 39 39 58 58 38 38 22 22 ment age will lower the replacement rate for 1980s 40 35 61 53 40 34 23 20 future beneficiaries (for any chosen age for 2000s 39 32 58 47 39 32 22 18 claiming benefits) compared with the rate for Women people who are claiming benefits now. In particular, if Social Security benefits are paid as 1940s 51 51 76 76 49 49 40 40 1960s 47 47 67 67 44 44 37 37 scheduled, the median replacement rate for 1980s 47 40 67 58 45 38 36 31 beneficiaries born in the 2000s (about 42 per- 2000s 46 37 65 53 44 35 34 28 cent) will be slightly lower than the rate for beneficiaries born in the 1940s (about 45 per- Source: Congressional Budget Office. cent), CBO estimates. People in later cohorts, however, are expected to collect benefits for a Note: The average initial replacement rate is a worker’s initial benefit as a percentage of a worker’s average longer time as life expectancy increases. annual lifetime earnings. (To compute lifetime earnings, past earnings are adjusted for average growth in economywide earnings.) Replacement rates are computed for all individuals who are eligible to claim Fourth, because women tend to have lower retirement benefits at age 62 and who have not yet claimed any other benefit. All workers are assumed to lifetime earnings, their average replacement claim benefits at age 65. All values are net of income taxes paid on benefits and credited to the Social rates are higher than men’s are, especially for Security trust funds. earlier birth cohorts. The difference between the rates for women and men in the highest quintile is large, in part because that group includes many women who spend time out of the labor force or who work part time. In con- trast, most men in households with high earn- CBO ings are employed full time. 
  • 23. DISTRIBUTION OF BENEFITS CBO’S 2011 LONG-TERM PROJECTIONS FOR SOCIAL SECURITY: ADDITIONAL INFORMATION 17 Exhibit 11. CBO calculates lifetime retirement benefits as Median Present Value of Lifetime Benefits for Retired Workers, with the present value, discounted to the year in Scheduled and Payable Benefits which the beneficiary turns 62, of all retired- worker benefits that a worker receives from the (Thousands of 2011 dollars) program. CBO estimates that real median life- Lowest Quintile of Middle Quintile of Highest Quintile of time benefits (both scheduled and payable 10-Year Lifetime Household Lifetime Household Lifetime Household benefits, adjusted for inflation) for each birth Birth All Retired Workers Earnings Earnings Earnings cohort will be greater than those for the pre- Cohort Scheduled Payable Scheduled Payable Scheduled Payable Scheduled Payable ceding cohort, because benefits grow with All earnings and earnings are expected to continue to rise over time. For example, real median 1940s 169 168 82 82 189 188 309 309 1960s 200 187 103 98 221 206 387 355 scheduled lifetime benefits for people born in 1980s 256 214 135 114 286 239 517 433 the 2000s will be more than double those for 2000s 351 275 182 147 394 309 712 567 people born in the 1940s; real median payable lifetime benefits for the 2000s cohort will be Men about 65 percent greater. 1940s 204 204 83 82 234 234 350 349 1960s 226 211 105 100 251 233 432 396 The projected trends in median lifetime retire- 1980s 284 237 140 119 313 261 570 478 ment benefits differ from the trends in median 2000s 393 308 192 154 440 341 785 624 initial benefits for two reasons. First, as life expectancy increases, people will collect bene- Women fits for longer periods, so scheduled lifetime 1940s 145 145 82 82 161 161 247 245 benefits will grow faster than scheduled initial 1960s 182 169 101 96 203 187 316 293 benefits. Second, although cohorts that begin 1980s 233 195 129 110 260 217 441 372 to receive benefits before the trust funds are 2000s 318 249 174 142 354 280 610 481 exhausted will collect their scheduled initial benefits, some members of those cohorts will Source: Congressional Budget Office. still be receiving benefits when the trust funds Note: Benefits are the present value of all retired-worker benefits received. To calculate their present value, are exhausted. At that point, payable benefits benefits are adjusted for inflation (to produce constant dollars) and discounted to age 62. All values are will decline, and the payable lifetime benefits net of income taxes paid on benefits and credited to the Social Security trust funds. for those recipients will be less than their scheduled lifetime benefits. Lifetime benefits are lower for women than for men. However, the gap is smaller than it is for initial benefits because women live longer, on average, and thus tend to collect benefits for a longer time.  CBO