1. PRESS EMBARGO : 8.00am (6.00am GMT), September 18, 2012
September 18, 2012
New Passenger Car Registrations
European Union
E U i
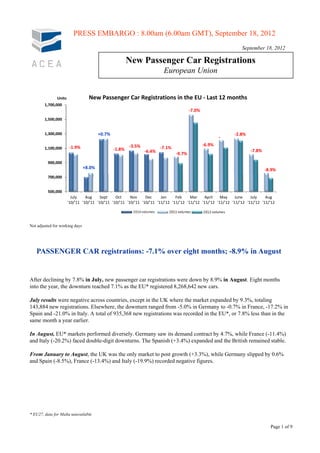
Units New Passenger Car Registrations in the EU ‐ Last 12 months
1,700,000
‐7.0%
1,500,000
1,300,000 +0.7% ‐2.8%
-
‐3.5% ‐6.9%
1,100,000 ‐1.9% ‐1.8% ‐7.1%
‐6.4% ‐7.8%
‐9.7%
900,000
+8.0% ‐8.9%
700,000
500,000
July Aug Sept Oct Nov Dec Jan Feb Mar April May June July Aug
'10/'11 '10/'11 '10/'11 '10/'11 '10/'11 '10/'11 '11/'12 '11/'12 '11/'12 '11/'12 '11/'12 '11/'12 '11/'12 '11/'12
Series1 Series2
Not adjusted for working days
PASSENGER CAR registrations: -7.1% over eight months; -8.9% in August
After declining by 7.8% in July ne passenger car registrations were down by 8.9% in August Eight months
b 7 8% July, new ere do n b 8 9% August.
into the year, the downturn reached 7.1% as the EU* registered 8,268,642 new cars.
July results were negative across countries, except in the UK where the market expanded by 9.3%, totaling
143,884 new registrations. Elsewhere, the downturn ranged from -5.0% in Germany to -0.7% in France, -17.2% in
Spain and -21.0% in Italy. A total of 935,368 new registrations was recorded in the EU*, or 7.8% less than in the
same month a year earlier.
In August, EU* markets performed diversely. Germany saw its demand contract by 4.7%, while France (-11.4%)
and Italy (-20.2%) faced double-digit downturns. The Spanish (+3.4%) expanded and the British remained stable.
From January to August, the UK was the only market to post growth (+3.3%), while Germany slipped by 0.6%
and Spain (-8.5%), France (-13.4%) and Italy (-19.9%) recorded negative figures.
* EU27, data for Malta unavailable
Page 1 of 9
2. P r e s s R e l e a s e
Association des PRESS EMBARGO FOR ALL DATA :
Constructeurs 8.00 A.M.(6.00 A.M GMT), September 18, 2012
Européens
d'Automobiles
PROVISIONAL
Av. des Nerviens 85 NEW PASSENGER CAR REGISTRATIONS BY MARKET
B-1040 Bruxelles EUROPEAN UNION*
Tel (32 2) 732 55 50
Fax (32 2) 738 73 10
(32 2) 738 73 11
18/9/12
August August % Chg Jan - Aug Jan - Aug % Chg
'12 '11 12/11 '12 '11 12/11
AUSTRIA 24,570 25,884 -5.1 239,796 242,784 -1.2
BELGIUM 31,256 37,788 -17.3 353,073 399,119 -11.5
BULGARIA 1,519 1,644 -7.6 12,905 12,636 +2.1
CYPRUS 743 946 -21.5 8,190 10,023 -18.3
CZECH REPUBLIC 13,193 14,105 -6.5 118,584 114,507 +3.6
DENMARK 13,564 12,507 +8.5 114,565 113,381 +1.0
ESTONIA 1,423 1,312 +8.5 11,872 9,988 +18.9
FINLAND 7,535 10,024 -24.8 80,918 89,998 -10.1
FRANCE 96,067 108,462 -11.4 1,293,973 1,493,745 -13.4
GERMANY 226,455 237,561 -4.7 2,108,716 2,121,047 -0.6
GREECE 3,886 7,297 -46.7 42,072 72,513 -42.0
HUNGARY 3,539 3,428 +3.2 35,799 30,315 +18.1
IRELAND 3,098 3,238 -4.3 74,158 84,396 -12.1
ITALY 56,447 70,764 -20.2 981,030 1,224,096 -19.9
LATVIA 894 856 +4.4 7,251 6,851 +5.8
LITHUANIA 957 1,064 -10.1 8,210 8,759 -6.3
LUXEMBURG 2,899 3,018 3.9
-3.9 35,750 36,143 1.1
-1.1
NETHERLANDS 33,211 39,062 -15.0 396,101 409,500 -3.3
POLAND 18,088 19,597 -7.7 188,178 181,408 +3.7
PORTUGAL 5,443 8,131 -33.1 68,103 114,259 -40.4
ROMANIA 5,044 8,747 -42.3 44,392 49,006 -9.4
SLOVAKIA 5,947 5,190 +14.6 46,515 44,956 +3.5
SLOVENIA 3,072 4,170 -26.3 35,504 41,855 -15.2
SPAIN 48,820 47,223 +3.4 520,216 568,349 -8.5
SWEDEN 21,065 24,368 -13.6 181,774 201,031 -9.6
UNITED KINGDOM 59,433 59,346 +0.1 1,260,997 1,220,618 +3.3
EUROPEAN UNION (EU27)* 688,168 755,732 -8.9 8,268,642 8,901,283 -7.1
EU15 633,749 694,673 -8.8 7,751,242 8,390,979 -7.6
EU11* 54,419 61,059 -10.9 517,400 510,304 +1.4
ICELAND 473 299 +58.2 5,901 3,799 +55.3
NORWAY 11,790 11,464 +2.8 93,065 91,158 +2.1
SWITZERLAND 22,052 21,963 +0.4 224,360 206,259 +8.8
EFTA 34,315 33,726 +1.7 323,326 301,216 +7.3
EU27*+EFTA 722,483 789,458 -8.5 8,591,968 9,202,499 -6.6
EU15+EFTA 668,064 728,399 -8.3 8,074,568 8,692,195 -7.1
(*) data for Malta currently not available.
For further information, please contact: Ms. Quynh-Nhu Huynh - Director Economics & Statistics - E-mail: qh@acea.be - Tel. (32) 2 738 73 55
New Passenger Car Registrations in August
Units Results in the EU 2003 ‐ 2012
Percentage
1,000,000 +10.0
+8.4 +8.0
900,000 +3.5 +3.6 +5.0
+2.2
+0.0
800,000 ‐1.6
‐5.0
700,000 ‐8.9 ‐10.0
‐13.1
600,000 ‐15.0
‐15.6
500,000 ‐20.0
Aug/03 Aug/04 Aug/05 Aug/06 Aug/07 Aug/08 Aug/09 Aug/10 Aug/11 Aug/12
New Passenger Car Registrations % change year‐on‐year
Next press release: Tuesday, October 16, 2012
This information is available on the ACEA website: http://www.acea.be Page 2 of 9
3. P r e s s R e l e a s e
PROVISIONAL
NEW PASSENGER CAR REGISTRATIONS BY MANUFACTURER
EUROPEAN UNION (EU)*
18/9/12
August January - August
%Share Units Units % Chg %Share Units Units % Chg
'12 '11 '12 '11 12/11 '12 '11 '12 '11 12/11
ALL BRANDS** 688,168 755,732 -8.9 8,268,642 8,901,283 -7.1
VW Group 28.2 25.3 194,063 191,530 +1.3 24.8 23.1 2,052,495 2,054,843 -0.1
VOLKSWAGEN 14.5 13.6 99,661 102,841 -3.1 12.9 12.3 1,065,790 1,092,252 -2.4
AUDI 6.4 5.5 44,271 41,526 +6.6 5.6 4.9 462,834 440,048 +5.2
SEAT 2.6 2.4 17,892 18,271 -2.1 2.1 2.3 172,890 206,432 -16.2
SKODA 4.3 3.8 29,890 28,790 +3.8 3.8 3.5 317,332 314,783 +0.8
Others (1) 0.3 0.0 2,349 102 +2202.9 0.4 0.0 33,649 1,328 +2433.8
PSA Group 11.4 11.9 78,512 90,233 -13.0 12.1 13.0 1,001,100 1,157,379 -13.5
PEUGEOT 6.5 6.4 44,526 48,617 -8.4 6.5 7.1 538,184 629,943 -14.6
CITROEN 4.9 5.5 33,986 41,616 -18.3 5.6 5.9 462,916 527,436 -12.2
RENAULT Group 8.8 9.2 60,438 69,363 -12.9 8.6 9.6 713,682 852,231 -16.3
RENAULT 6.2 7.1 42,346 53,765 -21.2 6.7 7.8 553,741 690,240 -19.8
DACIA 2.6 2.1 18,092 15,598 +16.0 1.9 1.8 159,941 161,991 -1.3
GM Group 7.6 8.4 52,135 63,453 -17.8 8.3 8.7 685,731 778,796 -11.9
OPEL/VAUXHALL 6.2 6.9 42,387 52,239 -18.9 6.8 7.4 560,364 662,059 -15.4
CHEVROLET 1.4 1.5 9,738 11,183 -12.9 1.5 1.3 125,153 116,407 +7.5
GM (US) 0.0 0.0 10 31 -67.7 0.0 0.0 214 330 -35.2
FORD 6.0 7.7 41,536 58,403 -28.9 7.6 8.0 625,171 712,983 -12.3
FIAT Group 5.3 5.9 36,422 44,541 -18.2 6.6 7.4 543,309 655,440 -17.1
FIAT 4.0 4.3 27,231 32,303 -15.7 4.8 5.4 394,329 476,429 -17.2
LANCIA/CHRYSLER 0.5 0.6 3,634 4,884 -25.6 0.8 0.8 66,125 69,047 -4.2
ALFA ROMEO 0.6 0.7 3,841 5,649 -32.0 0.8 1.0 62,903 91,453 -31.2
JEEP 0.2 0.2 1,497 1,469 +1.9 0.2 0.2 17,175 13,788 +24.6
Others (2) 0.0 0.0 219 236 -7.2 0.0 0.1 2,777 4,723 -41.2
BMW Group 5.9 6.2 40,634 47,000 -13.5 6.0 5.8 498,298 514,368 -3.1
BMW 4.9 5.1 33,912 38,743 -12.5 4.8 4.6 399,621 411,820 -3.0
MINI 1.0 1.1 6,722 8,257 -18.6 1.2 1.2 98,677 102,548 -3.8
DAIMLER 5.5 5.1 37,711 38,214 -1.3 5.1 4.9 422,439 434,049 -2.7
MERCEDES 5.0 4.6 34,176 34,416 -0.7 4.5 4.3 374,654 380,017 -1.4
SMART 0.5 0.5 3,535 3,798 -6.9 0.6 0.6 47,785 54,032 -11.6
TOYOTA Group 4.3 4.2 29,550 31,454 -6.1 4.2 3.9 345,203 348,677 -1.0
TOYOTA 4.1 3.9 28,301 29,747 -4.9 4.0 3.7 327,476 332,915 -1.6
LEXUS 0.2 0.2 1,249 1,707 -26.8 0.2 0.2 17,727 15,762 +12.5
NISSAN 3.2 3.0 21,748 22,920 -5.1 3.4 3.3 285,249 298,121 -4.3
HYUNDAI 3.7 3.5 25,317 26,085 -2.9 3.4 2.8 278,757 253,244 +10.1
KIA 3.0 2.4 20,308 18,077 +12.3 2.6 2.0 216,985 176,202 +23.1
VOLVO CAR CORP. 1.3 1.4 9,091 10,756 -15.5 1.7 1.8 138,660 156,898 -11.6
SUZUKI 1.4 1.3 9,421 9,858 -4.4 1.2 1.3 100,112 112,265 -10.8
HONDA 1.1 0.9 7,905 6,596 +19.8 1.1 1.0 87,080 92,406 -5.8
MAZDA 1.0 1.0 6,749 7,537 -10.5 1.0 1.0 80,498 90,309 -10.9
JAGUAR LAND ROVER 0.6 0.3 3,849 2,601 +48.0 0.9 0.6 76,683 56,611 +35.5
LAND ROVER 0.5 0.2 3,256 1,883 +73.0 0.8 0.5 62,272 43,065 +44.6
JAGUAR 0.1 0.1 593 718 -17.4 0.2 0.2 14,411 13,546 +6.4
MITSUBISHI 0.6 0.9 4,377 6,441 -32.0 0.6 0.8 48,166 72,283 -33.4
OTHER** 1.2 1.4 8,402 10,670 -21.3 0.8 0.9 69,024 84,177 -18.0
(1) VW Group: VW 'other' include Bentley, Bugatti, Lamborghini, and since Aug '12 Porsche For further information, please contact:
(2) FIAT Group: FIAT 'other' include Dodge, Ferrari, Maserati Ms. Quynh-Nhu Huynh - Director Economics & Statistics
(*) data for Malta n.a. E-mail: qh@acea.be - Tel. (32) 2 738 73 55
(**) ACEA estimates
Page 3 of 9