Wyoming State Bridge Profile
- 1. © 2014 The American Road & Transportation Builders Association (ARTBA). All rights reserved. No part of this document may be reproduced or
transmitted in any form or by any means, electronic, mechanical, photocopying, recording, or otherwise, without prior written permission of
ARTBA.
Highlights from FHWA’s 2013 National Bridge Inventory Data:
Of the 3,099 bridges in the state, 443 bridges, or 14% are classified as structurally deficient. This
means one or more of the key bridge elements, such as the deck, superstructure or
substructure, is considered to be in “poor” or worse condition.1
There are 280 bridges, or 9% of all state bridges, classified as functionally obsolete. This means
the bridge does not meet design standards that are in line with current practice.
Federal-aid investment in Wyoming has supported $231.6 million in bridge construction
spending on 646 bridges between 2003 and 2012, according to FHWA data.2
Since 2004, 222 new bridges have been constructed in the state and 23 bridges have undergone
major reconstruction.
The state estimates that it would cost approximately $215.3 million to fix a total of 1,199
bridges in the state.3
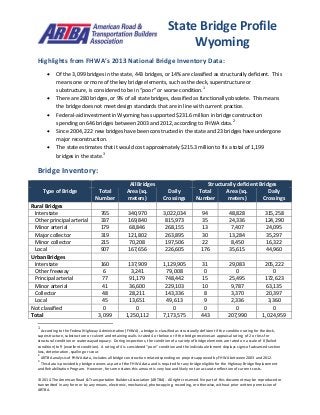
Bridge Inventory:
All Bridges Structurally deficient Bridges
Type of Bridge Total
Number
Area (sq.
meters)
Daily
Crossings
Total
Number
Area (sq.
meters)
Daily
Crossings
Rural Bridges
Interstate 765 340,970 3,022,034 94 48,828 315,258
Other principal arterial 337 169,840 815,973 35 24,336 124,290
Minor arterial 179 68,846 268,155 13 7,407 24,095
Major collector 319 121,802 263,895 30 13,284 35,297
Minor collector 215 70,208 197,506 22 8,450 16,322
Local 907 167,656 226,605 176 35,615 44,960
Urban Bridges
Interstate 160 137,909 1,129,905 31 29,083 205,222
Other freeway 6 3,241 79,008 0 0 0
Principal arterial 77 91,179 748,442 15 25,495 172,623
Minor arterial 41 36,600 229,103 10 9,787 63,135
Collector 48 28,211 143,336 8 3,370 20,397
Local 45 13,651 49,613 9 2,336 3,360
Not classified 0 0 0 0 0 0
Total 3,099 1,250,112 7,173,575 443 207,990 1,024,959
1
According to the Federal Highway Administration (FHWA), a bridge is classified as structurally deficient if the condition rating for the deck,
superstructure, substructure or culvert and retaining walls is rated 4 or below or if the bridge receives an appraisal rating of 2 or less for
structural condition or waterway adequacy. During inspections, the condition of a variety of bridge elements are rated on a scale of 0 (failed
condition) to 9 (excellent condition). A rating of 4 is considered “poor” condition and the individual element displays signs of advanced section
loss, deterioration, spalling or scour.
2
ARTBA analysis of FHWA data, includes all bridge construction related spending on projects approved by FHWA between 2003 and 2012.
3
This data is provided by bridge owners as part of the FHWA data and is required for any bridge eligible for the Highway Bridge Replacement
and Rehabilitation Program. However, for some states this amount is very low and likely not an accurate reflection of current costs.
State Bridge Profile
Wyoming
- 2. © 2014 The American Road & Transportation Builders Association (ARTBA). All rights reserved. No part of this document may be reproduced or
transmitted in any form or by any means, electronic, mechanical, photocopying, recording, or otherwise, without prior written permission of
ARTBA.
Proposed bridge work:
Type of Work Number Cost (millions) Daily Crossings Area (sq. meters)
Bridge replacement 181 $130.6 175,312 57,959
Widening & rehabilitation 15 $3.5 15,792 5,987
Rehabilitation 50 $4.4 158,255 29,547
Deck rehabilitation/replacement 27 $7.4 123,417 16,405
Other work 926 $69.5 1,159,652 266,022
Top 10 Most Traveled Structurally Deficient Bridges in the State
County Year
Built
Daily
Crossings
Type of Bridge Location
(route/water under the bridge, traffic on the bridge and location)
Teton 1969 30,409 Rural arterial FLAT CREEK, US 26, JACKSON
Campbell 1975 20,582 Urban other
principal arterial
DONKEY CREEK, WYO 59, RENO JCT - GILLETTE
Sheridan 1980 19,852 Urban other
principal arterial
LITTLE GOOSE CREEK, US 14, SHERIDAN
Laramie 1977 18,571 Urban other
principal arterial
UP & BNRR, WYO 212, COLLEGE DRIVE;CHEYENNE
Sweetwater 1991 18,307 Urban other
principal arterial
BITTER CREEK, US 30, ROCK SPRINGS
Fremont 1978 17,043 Urban other
principal arterial
MIDDLE POPO AGIE RIVER, US 287, LANDER STREETS
Sweetwater 1977 16,548 Urban minor
arterial
UPRR OVERPASS, WYO 376, ROCK SPRINGS CIRCUMFERENT
Sweetwater 1977 16,548 Urban minor
arterial
BITTER CREEK, WYO 376, ROCK SPRINGS CIRCUMFERENT
Sweetwater 1981 15,256 Urban other
principal arterial
BITTER CREEK, US 30, ROCK SPRINGS
Natrona 1977 12,899 Urban other
principal arterial
CASPER CREEK, US 20, CASPER
Sources: All data is from the 2013 National Bridge Inventory, released by the Federal Highway Administration in March 2014.
Note that specific conditions on bridge may have changed as a result of recent work. Cost estimates of bridge work provided as
part of the data and have been adjusted to 2013$ for inflation and estimated project costs. Contract awards data is for state
and local government awards and comes from McGraw Hill. Note that additional bridge investment may be a part of other
contract awards if a smaller bridge project is included with a highway project, and that would not be accounted for in the total
in this profile.