
Recommended
More Related Content
What's hot
What's hot (20)
Similar to 6.frequency domain image_processing
Similar to 6.frequency domain image_processing (20)
More from Nashid Alam
More from Nashid Alam (9)
Recently uploaded
Recently uploaded (20)
6.frequency domain image_processing
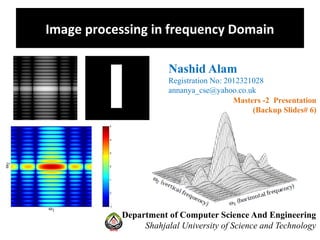
- 1. Image processing in frequency Domain Department of Computer Science And Engineering Shahjalal University of Science and Technology Nashid Alam Registration No: 2012321028 annanya_cse@yahoo.co.uk Masters -2 Presentation (Backup Slides# 6)
- 2. Introduction to Frequency domain Deal with images in: -Spatial domain -Frequency domain
- 3. Difference between spatial domain and frequency domain Spatial domain : - Deal with images as it is. - The value of the pixels of the image change with respect to scene. Frequency domain : -Deal with the rate at which the pixel values are changing in spatial domain.
- 4. For simplicity , Let’s put it this way. DIFFERENCE BETWEEN SPATIAL DOMAIN AND FREQUENCY DOMAIN Directly deal with the image matrix.
- 5. For simplicity , Let’s put it this way. Image Processing in Frequency Domain o Transform the image to its frequency distribution. o Black box system perform what ever processing it has to perform oThe output of the black box is not an image , - The output it is a transformation. o After performing inverse transformation - The output is converted into an image which is then viewed in spatial domain. It can be pictorially viewed
- 6. Frequency Components Any image in spatial domain can be represented in a frequency domain. But what do this frequencies actually mean? Frequency components are divided into two major components. 1. HIGH FREQUENCY COMPONENTS High frequency components correspond to edges in an image. 2. LOW FREQUENCY COMPONENTS Low frequency components in an image correspond to smooth regions.
- 7. TRANSFORMATION Transformation: A signal can be converted from spatial domain into frequency domain using mathematical operators called transformation. kind of transformation: Fourier Series Fourier transformation Laplace transform Z transform
- 9. Fourier Transform f(m, n) is a function of two discrete spatial variables m and n, Two-dimensional Fourier transform of f(m, n) : The variables ω1 and ω2 are frequency variables ω1 and ω2 both are periodic with period 2π Where, -2π<= ω1 and 2π<= ω2 F(ω1,ω2 ) is often called the frequency-domain representation of f(m, n)
- 10. Fourier Transform F(0,0 ) is the sum of all the values of f(m, n) F(0,0 ) is often called the constant component or DC component of the Fourier transform. (DC stands for direct current: It is an electrical engineering term that refers to a constant-voltage power source, as opposed to a power source whose voltage varies sinusoidally.) frequency-domain representation of f(m, n):
- 11. Fourier Transform The inverse two-dimensional Fourier transform is given by: This equation means that f(m, n) can be represented as: A sum of an infinite number of complex exponentials (sinusoids) with different frequencies.
- 12. Example2D Fourier Transform Consider a function f(m, n) : 1 within a rectangular region 0 everywhere else. To simplify the diagram: f(m, n) is shown as a continuous function, even though the variables m and n are discrete
- 13. Example2D Fourier Transform The magnitude of the Fourier transform, |F(ω1,ω2 )| is shown in mesh plot.
- 14. This reflects the fact: -Horizontal cross sections of are narrow pulses, vertical cross sections are broad pulses. -Narrow pulses have more high-frequency content than broad pulses. Example2D Fourier Transform The plot also shows : More energy at high horizontal frequencies Less energy at high vertical frequencies. Example Of How To Do This Is In Next Slide
- 32. Example Relationship to 2D Fourier transform with spatial image Construct a matrix f that is similar to the function f(m, n) f = zeros(30,30); f(5:24,13:17) = 1; imshow(f,'notruesize') (b) Main Image (Toy image Constriction) in spatial domain (c)Fourier transform of the image(Frequency Domain) (a) Toy Image
- 33. Example2D Fourier Transform Main Image in spatial domain Orthogonal Compute and visualize the 30-by-30 DFT of f(m,n)
- 34. Target Main Image in spatial domain Fourier transform of the image (Frequency Domain) Inverse Fourier transform (Going back to Spatial domain)
- 35. Example2D Fourier Transform Compute and visualize the 30-by-30 DFT of f(m,n) F = fft2(f); F2 = log(abs(F)); imshow(F2,[-1 5],'notruesize'); %% colormap(jet); colorbar
- 36. Example2D Fourier Transform Doesn’t match the target Fourier Transformed Image The resolution is much lower DC coefficient of F(0,0) is displayed in the upper-left corner instead of the traditional location in the center (b) Target Fourier Transformed Image (b) Visualize the 30-by-30 DFT F(0,0) value is called DC coefficients DC=Direct Current
- 37. Example2D Fourier Transform The resolution is increased by zero-padding f when computing its DFT. Need more computation %resolution is increased by zero-padding f %zero-pads f to be 256-by-256 before %computing the DFT F = fft2(f,256,256); Dealing with Resolution
- 38. Example2D Fourier Transform DCT coefficients of Fourier transform are displayed much more finely The result is : (a) DCT result Before zero-padding (b) DCT result After zero-padding (fine result) Need more computation Dealing with Resolution F = fft2(f,256,256);
- 39. Example2D Fourier Transform Need more computation Dealing with displaying DC coefficient of F(0,0) fix this problem by using the function fftshift, which swaps the quadrants of F so that the DC coefficient is in the center. imshow(log(abs(F)),[-1 5]); (b) Target Fourier Transformed Image
- 40. Example2D Fourier Transform compute the inverse DFT (a) Fourier transform of the image (Frequency Domain) (b) Inverse Fourier transform (Going back to Spatial domain)