prashanth updated resume 2024 for Teaching Profession
Gaskins data
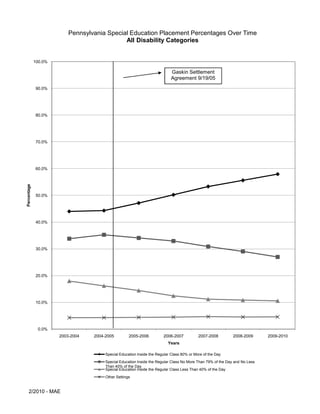
1. Pennsylvania Special Education Placement Percentages Over Time
All Disability Categories
100.0%
Gaskin Settlement
Agreement 9/19/05
90.0%
80.0%
70.0%
60.0%
Percentage
50.0%
40.0%
30.0%
20.0%
10.0%
0.0%
2003-2004 2004-2005 2005-2006 2006-2007 2007-2008 2008-2009 2009-2010
Years
Special Education Inside the Regular Class 80% or More of the Day
Special Education Inside the Regular Class No More Than 79% of the Day and No Less
Than 40% of the Day
Special Education Inside the Regular Class Less Than 40% of the Day
Other Settings
2/2010 - MAE
2. Pennsylvania Special Education Placement Percentages Over Time
Primary Disability - Autism
100.0%
Gaskin Settlement
Agreement 9/19/05
90.0%
80.0%
70.0%
60.0%
Percentage
50.0%
40.0%
30.0%
20.0%
10.0%
0.0%
2003-2004 2004-2005 2005-2006 2006-2007 2007-2008 2008-2009 2009-2010
Years
Special Education Inside the Regular Class 80% or More of the Day
Special Education Inside the Regular Class No More Than 79% of the Day and No Less Than 40%
of the Day
Special Education Inside the Regular Class Less Than 40% of the Day
Other Settings Percent
2/2010 - MAE
3. Pennsylvania Special Education Placement Percentages Over Time
Primary Disability - Emotional Disturbance
100.0%
Gaskin Settlement
Agreement 9/19/05
90.0%
80.0%
70.0%
60.0%
Percentage
50.0%
40.0%
30.0%
20.0%
10.0%
0.0%
2003-2004 2004-2005 2005-2006 2006-2007 2007-2008 2008-2009 2009-2010
Years
Special Education Inside the Regular Class 80% or More of the Day
Special Education Inside the Regular Class No More Than 79% of the Day and No Less Than 40%
of the Day
Special Education Inside the Regular Class Less Than 40% of the Day
Other Settings Percent
2/2010 - MAE
4. Pennsylvania Special Education Placement Percentages Over Time
Primary Disability - Deaf-Blindness
100.0%
Gaskin Settlement
Agreement 9/19/05
90.0%
80.0%
70.0%
60.0%
Percentage
50.0%
40.0%
30.0%
20.0%
10.0%
0.0%
2003-2004 2004-2005 2005-2006 2006-2007 2007-2008 2008-2009 2009-2010
Years
Special Education Inside the Regular Class 80% or More of the Day
Special Education Inside the Regular Class No More Than 79% of the Day and No Less Than 40%
of the Day
Special Education Inside the Regular Class Less Than 40% of the Day
Other Settings Percent
2/2010 - MAE
5. Pennsylvania Special Education Placement Percentages Over Time
Primary Disability - Hearing Impairment Including Deafness
100.0%
Gaskin Settlement
Agreement 9/19/05
90.0%
80.0%
70.0%
60.0%
Percentage
50.0%
40.0%
30.0%
20.0%
10.0%
0.0%
2003-2004 2004-2005 2005-2006 2006-2007 2007-2008 2008-2009 2009-2010
Years
Special Education Inside the Regular Class 80% or More of the Day
Special Education Inside the Regular Class No More Than 79% of the Day and No Less Than 40%
of the Day
Special Education Inside the Regular Class Less Than 40% of the Day
Other Settings Percent
2/2010 - MAE
6. Pennsylvania Special Education Placement Percentages Over Time
Primary Disability - Mental Retardation
100.0%
Gaskin Settlement
Agreement 9/19/05
90.0%
80.0%
70.0%
60.0%
Percentage
50.0%
40.0%
30.0%
20.0%
10.0%
0.0%
2003-2004 2004-2005 2005-2006 2006-2007 2007-2008 2008-2009 2009-2010
Years
Special Education Inside the Regular Class 80% or More of the Day
Special Education Inside the Regular Class No More Than 79% of the Day and No Less Than 40%
of the Day
Special Education Inside the Regular Class Less Than 40% of the Day
Other Settings Percent
2/2010 - MAE
7. Pennsylvania Special Education Placement Percentages Over Time
Primary Disability - Multiple Disabilities
100.0%
Gaskin Settlement
Agreement 9/19/05
90.0%
80.0%
70.0%
60.0%
Percentage
50.0%
40.0%
30.0%
20.0%
10.0%
0.0%
2003-2004 2004-2005 2005-2006 2006-2007 2007-2008 2008-2009 2009-2010
Years
Special Education Inside the Regular Class 80% or More of the Day
Special Education Inside the Regular Class No More Than 79% of the Day and No Less Than 40%
of the Day
Special Education Inside the Regular Class Less Than 40% of the Day
Other Settings Percent
2/2010 - MAE
8. Pennsylvania Special Education Placement Percentages Over Time
Primary Disability - Other Health Impairment
100.0%
Gaskin Settlement
Agreement 9/19/05
90.0%
80.0%
70.0%
60.0%
Percentage
50.0%
40.0%
30.0%
20.0%
10.0%
0.0%
2003-2004 2004-2005 2005-2006 2006-2007 2007-2008 2008-2009 2009-2010
Years
Special Education Inside the Regular Class 80% or More of the Day
Special Education Inside the Regular Class No More Than 79% of the Day and No Less Than 40%
of the Day
Special Education Inside the Regular Class Less Than 40% of the Day
Other Settings Percent
2/2010 - MAE
9. Pennsylvania Special Education Placement Percentages Over Time
Primary Disability - Orthopedic Impairment
100.0%
Gaskin Settlement
Agreement 9/19/05
90.0%
80.0%
70.0%
60.0%
Percentage
50.0%
40.0%
30.0%
20.0%
10.0%
0.0%
2003-2004 2004-2005 2005-2006 2006-2007 2007-2008 2008-2009 2009-2010
Years
Special Education Inside the Regular Class 80% or More of the Day
Special Education Inside the Regular Class No More Than 79% of the Day and No Less Than 40%
of the Day
Special Education Inside the Regular Class Less Than 40% of the Day
Other Settings Percent
2/2010 - MAE
10. Pennsylvania Special Education Placement Percentages Over Time
Primary Disability - Specific Learning Disability
100.0%
Gaskin Settlement
Agreement 9/19/05
90.0%
80.0%
70.0%
60.0%
Percentage
50.0%
40.0%
30.0%
20.0%
10.0%
0.0%
2003-2004 2004-2005 2005-2006 2006-2007 2007-2008 2008-2009 2009-2010
Years
Special Education Inside the Regular Class 80% or More of the Day
Special Education Inside the Regular Class No More Than 79% of the Day and No Less Than 40%
of the Day
Special Education Inside the Regular Class Less Than 40% of the Day
Other Settings Percent
2/2010 - MAE
11. Pennsylvania Special Education Placement Percentages Over Time
Primary Disability - Speech or Language Impairment
100.0%
90.0%
Gaskin Settlement
Agreement 9/19/05
80.0%
70.0%
60.0%
Percentage
50.0%
40.0%
30.0%
20.0%
10.0%
0.0%
2003-2004 2004-2005 2005-2006 2006-2007 2007-2008 2008-2009 2009-2010
Years
Special Education Inside the Regular Class 80% or More of the Day
Special Education Inside the Regular Class No More Than 79% of the Day and No Less Than 40%
of the Day
Special Education Inside the Regular Class Less Than 40% of the Day
Other Settings Percent
2/2010 - MAE
12. Pennsylvania Special Education Placement Percentages Over Time
Primary Disability - Traumatic Brain Injury
100.0%
Gaskin Settlement
Agreement 9/19/05
90.0%
80.0%
70.0%
60.0%
Percentage
50.0%
40.0%
30.0%
20.0%
10.0%
0.0%
2003-2004 2004-2005 2005-2006 2006-2007 2007-2008 2008-2009 2009-2010
Years
Special Education Inside the Regular Class 80% or More of the Day
Special Education Inside the Regular Class No More Than 79% of the Day and No Less Than 40%
of the Day
Special Education Inside the Regular Class Less Than 40% of the Day
Other Settings Percent
2/2010 - MAE
13. Pennsylvania Special Education Placement Percentages Over Time
Primary Disability - Visual Impairment Including Blindness
100.0%
Gaskin Settlement
Agreement 9/19/05
90.0%
80.0%
70.0%
60.0%
Percentage
50.0%
40.0%
30.0%
20.0%
10.0%
0.0%
2003-2004 2004-2005 2005-2006 2006-2007 2007-2008 2008-2009 2009-2010
Years
Special Education Inside the Regular Class 80% or More of the Day
Special Education Inside the Regular Class No More Than 79% of the Day and No Less Than 40%
of the Day
Special Education Inside the Regular Class Less Than 40% of the Day
Other Settings Percent
2/2010 - MAE
14. Pennsylvania Special Education Placement Percentages Over Time
21% and More Combined
All Disability Categories
100.0%
Gaskin Settlement
Agreement 9/19/05
90.0%
80.0%
70.0%
60.0%
Percentage
50.0%
P
40.0%
30.0%
20.0%
10.0%
0.0%
2003-2004 2004-2005 2005-2006 2006-2007 2007-2008 2008-2009 2009-2010
Years
Special Education Inside Regular Class More Than 40% of the Day (40% or more)
Special Education Inside Regular Class Less Than 40% of Day (39% or less)
Other Settings Percent
2/2010 - MAE
15. Pennsylvania Special Education Placement Percentages Over Time
21% and More Combined
Primary Disability - Autism
100.0%
Gaskin Settlement
Agreement 9/19/05
90.0%
80.0%
70.0%
60.0%
Percentage
50.0%
40.0%
30.0%
20.0%
10.0%
0.0%
2003-2004 2004-2005 2005-2006 2006-2007 2007-2008 2008-2009 2009-2010
Years
Special Education Inside Regular Class More Than 40% of the Day (40% or more)
Special Education Inside Regular Class Less Than 40% of Day (39% or less)
Other Settings Percent
2/2010 - MAE
16. Pennsylvania Special Education Placement Percentages Over Time
21% and More Combined
Primary Disability - Deaf-Blindness
100.0%
Gaskin Settlement
Agreement 9/19/05
90.0%
80.0%
70.0%
60.0%
Percentage
50.0%
40.0%
30.0%
20.0%
10.0%
0.0%
2003-2004 2004-2005 2005-2006 2006-2007 2007-2008 2008-2009 2009-2010
Years
Special Education Inside Regular Class More Than 40% of the Day (40% or more)
Special Education Inside Regular Class Less Than 40% of Day (39% or less)
Other Settings Percent
2/2010 - MAE
17. Pennsylvania Special Education Placement Percentages Over Time
21% and More Combined
Primary Disability - Emotional Disturbance
100.0%
Gaskin Settlement
Agreement 9/19/05
90.0%
80.0%
70.0%
60.0%
Percentage
50.0%
40.0%
30.0%
20.0%
10.0%
0.0%
2003-2004 2004-2005 2005-2006 2006-2007 2007-2008 2008-2009 2009-2010
Years
Special Education Inside Regular Class More Than 40% of the Day (40% or more)
Special Education Inside Regular Class Less Than 40% of Day (39% or less)
Other Settings Percent
2/2010 - MAE
18. Pennsylvania Special Education Placement Percentages Over Time
21% and More Combined
Primary Disability - Hearing Impairment Including Deafness
100.0%
Gaskin Settlement
Agreement 9/19/05
90.0%
80.0%
70.0%
60.0%
Percentage
50.0%
40.0%
30.0%
20.0%
10.0%
0.0%
2003-2004 2004-2005 2005-2006 2006-2007 2007-2008 2008-2009 2009-2010
Years
Special Education Inside Regular Class More Than 40% of the Day (40% or more)
Special Education Inside Regular Class Less Than 40% of Day (39% or less)
Other Settings Percent
2/2010 - MAE
19. Pennsylvania Special Education Placement Percentages Over Time
21% and More Combined
Primary Disability - Mental Retardation
100.0%
Gaskin Settlement
Agreement 9/19/05
90.0%
80.0%
70.0%
60.0%
Percentage
50.0%
40.0%
30.0%
20.0%
10.0%
0.0%
2003-2004 2004-2005 2005-2006 2006-2007 2007-2008 2008-2009 2009-2010
Years
Special Education Inside Regular Class More Than 40% of the Day (40% or more)
Special Education Inside Regular Class Less Than 40% of Day (39% or less)
Other Settings Percent
2/2010 - MAE
20. Pennsylvania Special Education Placement Percentages Over Time
21% and More Combined
Primary Disability - Multiple Disabilities
100.0%
Gaskin Settlement
Agreement 9/19/05
90.0%
80.0%
70.0%
60.0%
Percentage
50.0%
40.0%
30.0%
20.0%
10.0%
0.0%
2003-2004 2004-2005 2005-2006 2006-2007 2007-2008 2008-2009 2009-2010
Years
Special Education Inside Regular Class More Than 40% of the Day (40% or more)
Special Education Inside Regular Class Less Than 40% of Day (39% or less)
Other Settings Percent
2/2010 - MAE
21. Pennsylvania Special Education Placement Percentages Over Time
21% and More Combined
Primary Disability - Other Health Impairment
100.0%
Gaskin Settlement
Agreement 9/19/05
90.0%
80.0%
70.0%
60.0%
Percentage
50.0%
40.0%
30.0%
20.0%
10.0%
0.0%
2003-2004 2004-2005 2005-2006 2006-2007 2007-2008 2008-2009 2009-2010
Years
Special Education Inside Regular Class More Than 40% of the Day (40% or more)
Special Education Inside Regular Class Less Than 40% of Day (39% or less)
Other Settings Percent
2/2010 - MAE
22. Pennsylvania Special Education Placement Percentages Over Time
21% and More Combined
Primary Disability - Orthopedic Impairment
100.0%
Gaskin Settlement
Agreement 9/19/05
90.0%
80.0%
70.0%
60.0%
Percentage
50.0%
40.0%
30.0%
20.0%
10.0%
0.0%
2003-2004 2004-2005 2005-2006 2006-2007 2007-2008 2008-2009 2009-2010
Years
Special Education Inside Regular Class More Than 40% of the Day (40% or more)
Special Education Inside Regular Class Less Than 40% of Day (39% or less)
Other Settings Percent
2/2010 - MAE
23. Pennsylvania Special Education Placement Percentages Over Time
21% and More Combined
Primary Disability - Specific Learning Disability
100.0%
90.0%
80.0%
Gaskin Settlement
Agreement 9/19/05
70.0%
60.0%
Percentage
50.0%
40.0%
30.0%
20.0%
10.0%
0.0%
2003-2004 2004-2005 2005-2006 2006-2007 2007-2008 2008-2009 2009-2010
Years
Special Education Inside Regular Class More Than 40% of the Day (40% or more)
Special Education Inside Regular Class Less Than 40% of Day (39% or less)
Other Settings Percent
2/2010 - MAE
24. Pennsylvania Special Education Placement Percentages Over Time
21% and More Combined
Primary Disability - Speech or Language Impairment
100.0%
90.0%
Gaskin Settlement
Agreement 9/19/05
80.0%
70.0%
60.0%
Percentage
50.0%
40.0%
30.0%
20.0%
10.0%
0.0%
2003-2004 2004-2005 2005-2006 2006-2007 2007-2008 2008-2009 2009-2010
Years
Special Education Inside Regular Class More Than 40% of the Day (40% or more)
Special Education Inside Regular Class Less Than 40% of Day (39% or less)
Other Settings Percent
2/2010 - MAE
25. Pennsylvania Special Education Placement Percentages Over Time
21% and More Combined
Primary Disability - Traumatic Brain Injury
100.0%
Gaskin Settlement
Agreement 9/19/05
90.0%
80.0%
70.0%
60.0%
Percentage
50.0%
40.0%
30.0%
20.0%
10.0%
0.0%
2003-2004 2004-2005 2005-2006 2006-2007 2007-2008 2008-2009 2009-2010
Years
Special Education Inside Regular Class More Than 40% of the Day (40% or more)
Special Education Inside Regular Class Less Than 40% of Day (39% or less)
Other Settings Percent
2/2010 - MAE
26. Pennsylvania Special Education Placement Percentages Over Time
21% and More Combined
Primary Disability - Visual Impairment Including Blindness
100.0%
Gaskin Settlement
Agreement 9/19/05
90.0%
80.0%
70.0%
60.0%
Percentage
50.0%
40.0%
30.0%
20.0%
10.0%
0.0%
2003-2004 2004-2005 2005-2006 2006-2007 2007-2008 2008-2009 2009-2010
Years
Special Education Inside Regular Class More Than 40% of the Day (40% or more)
Special Education Inside Regular Class Less Than 40% of Day (39% or less)
Other Settings Percent
2/2010 - MAE