
Recommended
Recommended
More Related Content
Similar to 3. CAZ-AVI-part-1-public-observer-slides.pptx
Similar to 3. CAZ-AVI-part-1-public-observer-slides.pptx (20)
Recently uploaded
Recently uploaded (20)
3. CAZ-AVI-part-1-public-observer-slides.pptx
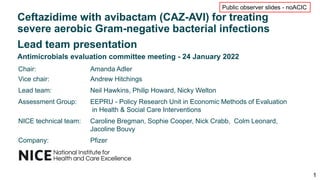
- 1. 1 Ceftazidime with avibactam (CAZ-AVI) for treating severe aerobic Gram-negative bacterial infections Chair: Amanda Adler Vice chair: Andrew Hitchings Lead team: Neil Hawkins, Philip Howard, Nicky Welton Assessment Group: EEPRU - Policy Research Unit in Economic Methods of Evaluation in Health & Social Care Interventions NICE technical team: Caroline Bregman, Sophie Cooper, Nick Crabb, Colm Leonard, Jacoline Bouvy Company: Pfizer Lead team presentation Antimicrobials evaluation committee meeting - 24 January 2022 Public observer slides - noACIC
- 2. 2 Testing a new approach to evaluating and paying for antimicrobials – why? Investment in novel antimicrobials commercially unattractive, with low returns • New antimicrobials subject to strict ‘stewardship’ • Co-ordinated approach to promote appropriate drug use to reduce resistance, decrease spread of infection of drug-resistant infections, minimise adverse effects • limits sales • New antimicrobials may not be used because of high cost compared to existing (generic) products
- 3. 3 Aim How much more effective is CAZ-AVI than the antimicrobials the NHS currently offers? How much of this ‘value’ occurs in the 10-year contract period? Committee estimates added effectiveness/‘incremental value’ of CAZ-AVI, evaluated against ‘comparator’ treatments, measured in quality-adjusted life years (QALYs) for expected eligible population in England Based on this range, and given monetary value of a QALY and other considerations, NHS England/NHS Improvement and company agree annual amount for NHS to pay company, regardless of volume of drug NHS orders: ‘delinked payment’ ‘subscription’ ‘Netflix’ model. Payments capped at £10 million per year for duration of 10-year contract Range of QALYs Requires modelling using assumptions based on limited evidence
- 4. 4 6 key questions for committee 1. What is the total value of the antimicrobial to the NHS? Incremental benefits, measured in quality-adjusted life years (QALYs) 2. Are there any benefits that haven’t been adequately captured in this value estimate? 3. What is the annual value of the antimicrobial for the 10-year contract duration (QALYs)? Refers to proportion of lifetime value that should be attributed to contract in order to address market failure, rather than simply the incremental benefits accrued in first 10 years of modelled time horizon 4. What are the committee’s stewardship recommendations? 5. What are the most relevant comparators? Informs confidential hospital purchase price of CAZ-AVI, set to discourage overuse (ie not too cheap) and encourage appropriate use (ie not too expensive) 6. How can data collection and surveillance be improved to capture missing data and reduce uncertainty?
- 5. 5 Decisions affecting absolute estimate of QALYs How many people with ‘high value clinical problems’? Public Health England Clinical expert How will population grow? ‘Persistent’ ‘Damped’ How much CAZ- AVI resistance in future? 1%/5%/10%/30% Which evidence network? 1, 2, 3, or 4 Is base case estimate plausible? Yes No Population Growth Population Size - Source Resistance Studies of susceptibility Value of ‘being prepared’ (insurance value) Are there people excluded?
- 6. 6 Decisions about modelling assumptions Are the comparators appropriate? Reasonable to generalise effectiveness from ‘high value infections’ to other ‘expected use’ infections? In absence of strong evidence base, is it reasonable to use susceptibility studies from the lab as a proxy for effectiveness? Are modelling assumptions related to treating empirically reasonable? What is the committee’s view on company’s modelling?
- 7. 7 Spectrum: broad vs narrow Transmission: slowing Enablement value Diversity value Other? Decisions about other attributes of value difficult to quantify and potentially uncaptured in model
- 8. 8 Decisions -recommendations and research What stewardship strategy aligns with recommendations? How can the NHS improve collecting data and surveillance? What research might resolve uncertainties?
- 9. 9 Decisions – part 2 of meeting What is the total benefit to the NHS of having CAZ-AVI, expressed in QALYs, over the 20 year horizon? What proportion of this, at a minimum, should be remunerated in the 10-year of the contract?
- 10. 10 Outline 1. Clinical background, decision problem and overview of EEPRU’s approach to modelling benefit and potentially excluded groups of patients 2. Using in vitro susceptibility data to estimate clinical outcomes 3. EEPRU patient-level economic model 4. EEPRU population-level economic model 5. EEPRU results patient-level 6. EEPRU results population-level 7. Additional elements of value 8. Company model
- 11. 11 Clinical background, decision problem and overview of EEPRU’s approach to modelling benefit and potentially excluded groups of patients
- 12. 12 CAZ-AVI ceftazidime-avibactam broad license EEPRU’s model narrower than marketing authorisation • Combines cephalasporin + β lactamase inhibitor • Administer IV in fixed dose combination • Many infection sites e.g. lung, urinary tract, bloodstream • Many gram negative pathogens e.g. Enterobacterales, Pseudomonas aeruginosa, Acinetobacter baumannii • Many mechanisms of resistance o Carbapenemase-mediated = enzymes that hydrolyse + deactivate carbapenem antibiotics eg meropenem Klebsiella pnuemoniae carbapenemase (KPC) oxacillinase (OXA) metallo-beta-lactamases (MBL) o Non-carbapenemase-mediated: reduced cell membrane permeability to antibiotics eg overexpression of efflux pumps, downregulation of porins Narrow model because CAZ-AVI not active against all pathogens/mechanisms & not possible to model every population Marketing authorisation: Adults and paediatric patients (≥3 months) with complicated intra- abdominal infections; complicated urinary tract infection; hospital-acquired pneumonia, including ventilator-associated pneumonia; bacteraemia (adults only) associated with aforementioned infections; infections caused by aerobic gram-negative organisms with limited treatment options.”
- 13. 13 Patient perspective - Antibiotic Research UK • Drug resistant infection: for many patients, a chronic condition and potential death sentence which is invisible and with which they must live. Constant feelings of fear, dread and frustration. • Symptoms often include severe pain, fatigue, lethargy, dizziness, brain fog, leading to severe depression & anxiety as quality of life decreases • Frequent hospital admissions • Some patients are put in isolation for 2–6 weeks, adding stress • Economic burden on individuals, many of whom cannot work • Significant impact on carers and families, looking after patients and providing financial support • Over-reliance on poor testing methods means patients often feel “not believed” by healthcare professionals or family and friends
- 14. 14 Patient perspective - Anthony Nolan Submission specifically refers to people who require/ have received a stem cell transplant • Patients with severe drug-resistant infection often have extremely difficult experiences, feeling scared and losing hope • Isolation impacts emotional and psychological wellbeing of both patients and carers, particularly as many stem cell transplant patients will already have isolated during prior treatment • Mixed experience with length of time required to isolate, can range from a few days to several months • High unmet need in this population as people often immunosuppressed and vulnerable to infection, more likely to develop severe drug-resistant infection
- 15. 15 Decision problem EEPRU Cannot model all scenarios covered in marketing authorisation 2 treatment approaches: ‘microbiology directed’ = susceptibility and gene testing ‘empiric’ = ill patients with probable drug-resistant organism Population When modelling at patient level, ‘high value clinical scenarios’ ie most likely to benefit • Enterobacterales • OXA-48 resistance mechanism • Complicated urinary tract infections (cUTI), microbiology-directed treatment only • Hospital-acquired pneumonia/ventilator assisted pneumonia (HAP/VAP), microbiology-directed + empiric treatment When modelling ‘expected use’ at population level, includes intra-abdominal infections and bacteraemia/sepsis Intervention CAZ-AVI Comparators Ceftazidime, ceftriaxone, cefepime, tobramycin, gentamicin, colistin, amikacin, levofloxacin, ciprofloxacin, fosfomycin, tigecycline, aztreonam, meropenem EEPRU classifies patients according to whether infection susceptible to colistin- based and/or aminoglycoside-based therapy or not Outcomes QALYs at population level for ‘expected use’ ie high-value + other scenarios Based on assumption that susceptibility in culture proxy for clinical effectiveness
- 16. 16 Consultation comments – comparators Clinical expert: • Non-colistin based alternatives to CAZ-AVI available in ~25% of cases, due to toxicity, intolerance or drug interactions. BIA: • Should not group aminoglycosides with colistin, because renal risk of aminoglycosides half of colistin Shionogi • Some patients modelled as receiving colistin will not receive colistin due to renal concerns, contraindications or drug interactions • Unclear what regimen(s) were included in non-colistin/aminoglycoside therapy options in microbiology- directed setting, since all comparators in EEPRU’s PICO table contain either colistin or aminoglycosides • Treating patients with regimens that exclude colistin and/or aminoglycosides not consistent with practice ⦿ Are the comparators and grouping relevant?
- 17. 17 Overall approach Estimate incremental benefits (QALYs) of CAZ-AVI Population-level QALYs for HVCS Population-level QALYs for ‘expected’ usage Patient-level QALYs for HVCS Total ‘value’ of CAZ-AVI to NHS in England EEPRU’s decision problem Model time horizon: 20 years HVCS: High Value Clinical Scenario
- 18. 18 EEPRU’s approach to modelling population benefit HVCS patient-level, HVCS population-level, Expected use population-level 1. Patient-level QALYs for HVCS Rescaling, using population sizes (SGSS PHE data) and assuming same benefit/cost (expert consultation) Quantitative modelling, akin to ‘normal’ NICE appraisal Quantitative modelling, forecasting population size and trends in usage and resistance over time Quantification of additional attributes ‘STEDI’ values* *Spectrum, Transmission, Enablement, Diversity, Insurance 2. Population-level QALYs for HVCS 3. Population-level QALYs for expected usage
- 19. 19 Potentially excluded populations Excluded EEPRU’s rationale for excluding Pathogen • Pseudomonas Aeruginosa Carbapenemase-mediated resistance in P. Aeruginosa rare If present, usually via metallo-beta-lactamases (MBL); CAZ-AVI has no activity against this Resistance mechanism • Klebsiella pneumoniae carbapenemase • Serine carbapenemases • Non-carbapenemase Other treatment options available Patients with specific underlying conditions • burns • renal insufficiency • compromised immune system • cystic fibrosis Uncertain whether patients get infections at different sites, by different pathogens, to those in high value clinical scenarios (HVCS)
- 20. 20 Consultation comments – population Population too narrow Population appropriate Population too broad Pfizer: • More patients in UK receive CAZ-AVI than EEPRU models: ~1,400 versus 70–575 patients/year in HVCS • Use will increase • Should reflect marketing authorisation MSD: HVCS may not reflect usage Advisory Committee on Antimicrobial Prescribing: should include resistance mechanisms other than OXA-48 Clinical expert: CAZ-AVI likely to be used in non-MBL producing Pseudomonas + Serratia when options intolerable, drug interactions, ↑ QTc British Society for Antimicrobial Chemotherapy BSAC + Royal College of Pathology RCPath: • CAZ-AVI unlikely to be used in all populations covered by marketing authorisation • Restrict to vulnerable patients with resistant gram-negative infections, mediated by carbapenemases British Infection Association BIA: • Empiric use inappropriate BSAC and RCPath: • CAZ-AVI not always needed (meropenem) BIA: • Not all HAP/VAP requires treatment ⦿ Is it reasonable to generalise benefits from high-value clinical scenario to ‘expected use’ including intra-abdominal infections and bacteraemia/sepsis? ⦿ Have analyses excluding groups of patients who might get CAZ-AVI?
- 21. 21 Using in vitro susceptibility data to estimate clinical outcomes Because of limited evidence base of randomised controlled trials and observational data, EEPRU used laboratory susceptibility data to estimate clinical outcomes
- 22. 22 How is susceptibility to antimicrobials assessed? ‘Breakpoint’ = threshold of susceptibility to assess likelihood of treatment success/failure Organisations that determine breakpoint Use different methods to set breakpoints not comparable/interchangeable European Committee on Antimicrobial Susceptibility Testing EU based & recommended by British Society for Antimicrobial Chemotherapy used in EEPRU uses in base case economic model most relevant to UK Clinical and Laboratory Standards Institute US based EEPRU uses in scenario analyses Bacterial sample from patient and cultured in lab Antimicrobial applied at increasing concentrations– degree of microbial growth assessed % of cultures susceptible at or below breakpoint reported
- 23. 23 EEPRU linked susceptibility data to clinical outcomes mortality, length of hospital stay, type of hospital ward EEPRU elicited information from experts + literature review EEPRU assumed • Outcomes conditional only upon pathogen’s susceptibility to antimicrobial determined in lab • Outcomes same regardless of mechanism causing infection • Risk of acute kidney injury with aminoglycoside/colistin included Results of literature review Empiric treatment: • Included 2 studies report mortality or length of hospital stay by susceptibility to empiric treatment Microbiology-directed treatment : • No relevant studies • EEPRU elicited experts: 5–7 experts
- 24. 24 Expert elicitation results 30-day survival • Susceptibility to treatment increases survival which is • Lowest for VAP patients • Highest for cUTI patients Length of hospital stay • Susceptibility to treatment decreases length of stay which is • Shortest in cUTI patients • Longest for VAP patients Time spent on wards • Patients susceptible to treatment spend more time on general ward and less on intensive care and high dependency units • Patients with VAP: most time in intensive care unit /least time on general wards • Followed by HAP then cUTI EEPRU used UK study data to validate expert elicitation results for length of hospital stay: Merrick et al. and CARBAR study
- 25. 25 Consultation comments – Linking susceptibility data to clinical outcomes Pfizer & Shionogi - inappropriate to use susceptibility data as a surrogate for clinical outcomes • doesn’t account for factors affecting susceptibility e.g. different tissue penetration at different sites • underestimates antibiotic’s effectiveness Shionogi - inappropriate to assume: • susceptibility of pathogen is same as probability that patient will be cured • outcomes do not differ according to antibiotic or pathogen-mechanism MSD, Pfizer & Shionogi question expert elicitation: • small sample size • results not validated ⦿ In absence of strong evidence base, is it reasonable to use susceptibility studies as a proxy for effectiven
- 26. 26 To compare CAZ-AVI to comparators for susceptibility, EEPRU developed network meta analysis Networks vary as to source of data – EEPRU used 4 networks in model: base-case + 3 scenarios 3 scenario analyses in economic model: • All studies, regardless of breakpoint method • PHE data only • EUCAST studies in isolates without co-existing MBL mechanisms of resistance only 1 study) Breakpoints Data sources Comparator s EUCAST CLSI 2 studies (n=374) Public Health England data on susceptibility (n=85) Ceftazidime, ceftriaxone, cefepime, tobramycin, gentamicin, colistin, amikacin, levofloxacin, ciprofloxacin, fosfomycin, tigecycline, aztreonam, meropenem 6 studies (n=800) Base case economic model 7 studies (n=201) Breakpoint methods unclear n = number of isolates
- 27. 27 Results susceptibility network meta-analysis EEPRU uses EUCAST definition of breakpoint and data from Public Health England in its ‘base case’ Scenario Breakpoint Data sources (n=number of studies) Odds ratio for being susceptible CAZ-AVI vs. colistin Base Case EUCAST Public Health England (PHE) data + all EUCAST studies (n=3) 2.2 95% CrI 0.6 to 8.0 Scenario 2 EUCAST + CLSI PHE data + all studies regardless of lab methods/breakpoint (n=16) 7.2 95% CrI 2.6 to 20.9 Scenario 3 Assumed EUCAST PHE data only (n=1) 1.6 95% CrI: 0.7 to 3.6 Scenario 4 EUCAST Studies of isolates without co-existing MBL mechanism of resistance (n=1) 10.1 95% CrI: 3.5 to 28.7 CrI: Credible interval
- 28. 28 Consultation comments - Susceptibility evidence and breakpoints BSAC and RCPath • EUCAST and CLSI breakpoints recently standardised • CLSI breakpoints widely used acceptable alternative to EUCAST • labs with EUCAST/CLSI methodology should interpret results with respective breakpoints Practice changed in last 5 years for testing colistin surveillance data may be unreliable Shionogi • Base case should combine EUCAST and CLSI data, because methods comparable • Network meta-analysis underestimates efficacy of CAZ-AVI compared with colistin: • Colistin monotherapy not recommended by CLSI/EUCAST because inadequate tissue concentration • CLSI updated colistin breakpoints & removed ‘susceptible’ category. EUCAST consulting on similar proposal. • Isolates considered susceptible to colistin should now be grouped as ‘non-susceptible’ • Exclude fosfomycin studies; methods not relevant or comparable with studies of other drugs
- 29. 29 EEPRU’s response to consultation comments – Susceptibility Colistin susceptibility: • EUCAST recommendations most applicable to UK • Not possible to apply 2021 breakpoints to historical studies (advice from Public Health England) • Colistin estimates should remain same as for other antimicrobials because • EUCAST accounted for issues with colistin monotherapy when setting breakpoints • Limited evidence that outcomes are better with colistin combination therapy versus colistin monotherapy Fosfomycin susceptibility: • Addressing heterogeneity issues in testing methods beyond scope of assessment, but valid limitation • Effect on NMA results of excluding studies using inappropriate methods unclear. • Base case NMA network includes only 1 study with fosfomycin data, scenario 3 has no fosfomycin data ⦿ Which of 4 networks of susceptibility evidence should model incorporate? ⦿ Are estimates of susceptibility to CAZ-AVI, relative to colistin, likely to be accurate?
- 30. 30 Economic analysis Models from EEPRU and company
- 31. 31 EEPRU patient-level economic model Methods for estimating patient-level QALYs for high value clinical scenarios 1. Empiric treatment 2. Microbiology-directed treatment
- 32. 32 EEPRU’s model: empiric setting All patients receive empiric treatment first susceptibility to drug unknown • ‘correctly suspected’ drug-resistant pathogen-mechanism • Estimated using PHE Second Generation Surveillance System (SGSS) data e.g. 20% for OXA-48 Enterobacterales • ‘wrongly suspected’ a different pathogen or mechanism 1st: outcomes modelled separately for patients with: • ‘Correctly suspected’ classified as susceptible or not susceptible to empiric therapy • ‘Not susceptible’ require further treatment 2nd : outcomes when patients assessed for microbiology-directed treatment • Patients who require further treatment: enter microbiology-directed component of model (next slide) • Patients requiring no further treatment: outcomes depends on whether they have acute kidney injury (AKI) 3rd : Outcomes following assessment for microbiology-directed treatment ⦿ Given the paucity of data, are the modelling assumptions related to empiric treatment reasonable?
- 33. 33 EEPRU’s model: microbiology-directed setting • Horizon is 20 years • Assumes susceptibility is only predictor of treatment effectiveness • Following microbiology-directed treatment, patients experience 1 of 30-day outcomes: • death • alive no acute kidney injury (AKI) • alive post-AKI renal function recovers • alive post-AKI renal function do not recover • 30-day outcomes determine long-term outcomes: • post-AKI recovery • chronic kidney disease (CKD) • death Source: EEPRU report, Figure 16. Markov model for long term outcomes Source: EEPRU report, Figure 15. Decision tree for 30-day outcomes
- 34. 34 EEPRU’s model: treatment in microbiology-directed setting Outcomes driven by the distribution of patients across susceptibility categories Susceptibility to existing drugs Susceptibility to CAZ-AVI Therapy existing care Therapy with CAZ-AVI available Susceptible to ≥ 1 non-colistin/ aminoglycosides Susceptible Non-colistin or aminoglycoside →appropriate efficacy and safety Resistant Susceptible only to colistin or aminoglycosides Susceptible Colistin/amino-based →poor safety CAZ-AVI →appropriate efficacy and safety Resistant Colistin/amino-based →poor safety Not susceptible to any available treatment options Susceptible Multi-drug salvage →poor efficacy and possibly poor safety CAZ-AVI →appropriate efficacy and safety Resistant Multi-drug salvage →poor efficacy and possibly poor safety Source: EEPRU’s report, table 20 • Teal: appropriate efficacy and safety • Orange: poor safety • Purple : poor efficacy (and possibly poor safety) • Bold: patient groups for whom susceptibility evidence would indicate treatment with CAZ-AVI 'Salvage’ therapy = rescue therapy = treatment after standard therapy fails
- 35. 35 Consultation comments –model assumptions Shionogi • Model doesn’t consider infections not suspected as OXA-48 in empiric setting but then treated as such in microbiology-directed setting • EEPRU response: treatment pathway influenced by new products benefitting only the microbiology directed setting • Estimating number of patients treated challenging because in practice we only know the total number of tests and not the setting in which tests were conducted • No option to stop CAZ-AVI after confirming pathogen and resistance mechanism, and substitute it for an equally effective product - part of good stewardship • Incorrect to assume that if a patient wrongly suspected of having the pathogen and resistance mechanism of interest, that all empiric treatments have the same effectiveness
- 36. 36 EEPRU population-level economic model Methods for estimating population- level QALYs for high value clinical scenarios and wider expected usage
- 37. 37 Estimating the patient population over time Predict how size of patient population in modelled clinical scenarios will change over the model time horizon (20 years) How many patients currently eligible for treatment? 1 How will eligible population change over time? 2 How will rates of resistance to CAZ-AVI and its comparators change over time? 3
- 38. 38 How many patients currently eligible for treatment? Classifying diagnoses within each category of infection using data from Public Health England (PHE) Second Generation Surveillance System (SGSS) 2 approaches: categorised by PHE or by clinical experts HAP/VAP Complicated UTI Bacteraemia sepsis Intra-abdominal Total PHE Second Generation Surveillance System SGSS Lower respiratory tract only Urine/kidney from males. Nephrostomy in males + females Blood Surgical and traumatic wounds Patients/year 24 82 161 36 303 Clinical experts Lower respiratory tract and other sites (e.g. lung, chest, sputum) Urine/kidney in scenario 1 in all hospitalised patients (male and female), upper genital tract in male and female hospitalised patients Blood and other including but not limited to, heart valve, prosthesis, grafts, bone biopsy sample As above for PHE Patients/year 166 132 161 36 495 cUTI, complicated urinary tract infection; HAP/VAP, hospital-acquired pneumonia or ventilator associated pneumonia; IAI intraabdominal infection; PHE, Public Health England; SGSS, Second Generation Surveillance System
- 39. 39 Consultation comments – PHE SGSS data SGSS underestimate patient numbers SGSS overestimates patient numbers Clinical expert: Local laboratory diagnosis varies and fails to culture blood or other relevant sites Shionogi: • Not all hospitals have microbiology laboratories • 98% of existing laboratories provide data • Data often incomplete • Under-reporting further exacerbated by COVID BSAC/RCPath: Estimates based on lower respiratory tract samples will significantly overestimate incidence, because HAP/VAP diagnosed using clinical and radiological results not just cultures. ⦿ Which approach to classification should the model incorporate?
- 40. 40 Estimating the patient population over Persistent or damped Model time horizon: 20 years Damped trend: Growth in short term, stabilises in long term Persistent growth: Growth persists over time horizon Historical population size data (PHE AMRHAI) AMRHAI: antimicrobial resistance and healthcare associated infections national reference library
- 41. 41 EEPRU used statistical measures of fit and visual evidence EEPRU uses both in base case • Model with persistent trend provides best fit to available data • Little evidence to choose between models, except: • empirical evidence shows models with damped trend generally give better results than similar models without damped trend • improved antimicrobial stewardship strategies may reduce resistance favouring damped trend model • Shionogi consultation comments: • experts consider ‘damping’ wrong • data does not reflect impact of COVID-19, which is likely to have increased antimicrobial use and resistance Extrapolation results ⦿ Which model likely to reflect growth of population?
- 42. 42 How will resistance to CAZ-AVI and comparators change over time? EEPRU assumes resistance to CAZ-AVI increases, but resistance to comparators constant Predict future rates of resistance to comparators 1 Predict future rates of resistance to CAZ-AVI 2 Predict impact of reduced comparator use on resistance to comparators 3 Evidence - Sparse data to inform extrapolations Not incorporated into model Explored different rates of resistance to CAZ-AVl 1–30% over 20 years Evidence - reducing use of antimicrobials may increase, decrease or have no effect on resistance to them Not incorporated into model Evidence - resistance will develop to new antimicrobials as usage increases ⦿ What is the likely increase in resistance to CAZ-AVI over the 20-year time horizon? 1%/5%/10%/30%?
- 43. 43 Consultation comments – resistance to comparators Pfizer: Resistance to all comparators should be modelled. NHSEI and Shionogi: Should model increased resistance to current treatments, including low probability but high impact catastrophic scenarios with high levels of resistance, making existing treatments ineffective. APRHAI: National trends in resistance have not necessarily followed reduced usage, eg cephalosporins. EEPRU’s response to consultation comments • Important to distinguish between 2 types of resistance: • resistance to carbapenems (typically viewed as last-resort antimicrobials) - modelled based on evidence suggesting increase in resistance to carbapenems • resistance to non-carbapenem antimicrobials amongst carbapenem-resistant pathogens. Both types considered - not modelled because insufficient evidence to suggest a trend • EEPRU conducted additional analyses in which comparator treatments become completely ineffective ⦿ What is the likely increase in resistance to comparators?
- 44. 44 ‘Being prepared’ (Insurance Value) Benefits of reserving a new antimicrobial until resistance eliminates current alternatives or as insurance against a catastrophic emergence of widespread multi drug resistant infections Potential source of additional benefit Modelled? Rationale for excluding/ comment if included Restricting usage of CAZ-AVI to preserve efficacy in the long term Yes Quantified in high value clinical scenarios – scenarios modelled reflect restricting usage Avoidance of catastrophic health losses Yes Quantified in high value clinical scenarios presented as distributions of population level net health benefits from probabilistic sensitivity analysis–may be valued differently by society Pfizer, BSAC and RCPath Neither Pfizer’s nor EEPRU’s model fully captured insurance value. Shionogi & NHSEI • Should model increase resistance to current treatments, including low probability event but high impact catastrophic scenarios where high levels of resistance emerge, making existing treatments ineffective.
- 45. 45 EEPRU scenario to capture value of ‘being prepared’ for emergence of resistance EEPRU assumes • Comparator antimicrobials completely ineffective - 0% susceptibility • No differences in safety between treatments, because EEPRU expects that if treatments become completely ineffective, clinicians will offer either safe antimicrobials or no treatment • Effectiveness of CAZ-AVI: maintained at 90% susceptibility over long-term - likely to overestimate benefits • These highly resistant pathogens are different from the pathogens in main analyses ie different population to the population in EEPRU’s base case model • Following parameters informed by expert opinion (n=1) • Other parameters set at the values for the high value clinical scenarios Parameter Base case value (scenario range) Probability of emergence of highly resistant strains 1% (0.5%–5%) Time to event from beginning of model 10 years (5–15 years) Number patients affected in 1st year 25 individuals (25–100) Annual growth in number of infections from beginning of model 20% (3%–30%) Analysis time horizon 50 years (20–50) ⦿ What is committee’s view of these assumptions?
- 46. 46 EEPRU scenario on subgroup with contraindication to colistin/aminoglycosides EEPRU assumes • Lack of empiric evidence on the proportion of patients who would have salvage therapy despite being susceptible to colistin/aminoglycosides – Suggested plausible range: 20% to 40% • In empiric treatment, represent 20%-40% of population • In microbiology-directed, assumed that those not susceptible to non-colistin/aminoglycosides (35%) would be considered for colistin/aminoglycosides, so this subgroup represent 7%-14% • Following parameters used: User defined parameter Base-case Probability of event (emergence of highly resistant strains) 100% Time of event (from now) 0 years The number of patients affected in the first year 2 scenarios based 2 classifications : SGSS vs clinical experts (See slide 38) The annual growth in the number of infections (from baseline) 2 scenarios: 1.2% if damped or 17.1% if persistent Analysis time horizon (years) 20 ⦿ What is committee’s view of these assumptions?
- 47. 47 EEPRU model results Per-patient results
- 48. 48 Results CAZ-AVI per-patient base case – probabilistic empiric setting - HAP/VAP vs colistin/aminoglycoside based regimens: similar effectiveness and safer in correctly + wrongly suspected infections vs. non colistin/aminoglycoside regimens: correctly assumed CAZ-AVI more effective, similarly safe vs. non colistin/aminoglycoside regimens: wrongly assumed CAZ-AVI similarly effectiveness, similarly safe Incremental results CAZ-AVI vs non colistin/ aminoglycoside based CAZ-AVI vs colistin/ aminoglycoside based Patients with OXA-48 Enterobacterales ‘correctly suspected’ Total costs -£9,776 -£208 Life years 0.468 0.26 QALYs 0.329 0.182 Per person benefit QALYs 0.818 0.193 Patients without OXA-48 Enterobacterales ‘wrongly suspected’ Total costs -£10 -£561 Life years 0 0.275 QALYs 0 0.193 Per person benefit QALY 0.001 0.221 All patients in empiric setting weighted average of correctly and wrongly suspected Total costs -£1,941 -£491 QALYs 0.065 0.191 Per person benefit QALYs 0.163 0.215 Source: EEPRU’s addendum 2, Table 3 (update of table 36 in EEPRU report)
- 49. 49 Results per-patient base case - probabilistic microbiology-directed - HAP/VAP + complicated UTI Benefit greater in microbiology-directed than empiric setting because 65% of patients successful on comparator Benefits of CAZ-AVI driven by avoiding safety issues of colistin and aminoglycosides in patients susceptible to these agents Source: EEPRU’s addendum 2, Table 5 (Update of table 38 in EEPRU report) CAZ-AVI Without CAZ-AVI Incremental results HAP/VAP Total costs £37,176 £37,465 -£289 Life years 2.69 2.61 0.08 QALYs 1.89 1.83 0.06 Per person net health benefit 0.03 -0.04 0.07 cUTI Total costs £20,037 £20,328 -£291 Life years 3.71 3.64 0.08 QALYs 2.61 2.56 0.05 Per person net health benefit 1.61 1.54 0.07
- 50. 50 Consultation comments – Patient-level results Pfizer • Per-patient QALY gains (approximately 0.1–0.2) lack face validity, given that the most probable outcome of unsuccessful treatment is death • EEPRU’s model estimates similar treatment efficacy for CAZ-AVI as for the current standard of care, failing to recognise additional clinical benefit of CAZ-AVI EEPRU’s response to consultation comments • CAZ-AVI incremental QALY gains make sense in context of underpinning efficacy and safety evidence for each drug/pathogen/mechanism • incremental QALYs in empiric setting vs best available alternative = 0.16; reflects weighted average of • large QALY gain (0.81) in patients correctly suspected of having the relevant infection, where susceptibility to CAZ-AVI is high • no difference in outcomes in patients with other pathogens/mechanisms 0.001
- 51. 51 EEPRU model results Population results
- 52. 52 EEPRU several approaches to base case different assumptions Base case analysis 2,342 531 • Infection site per Public Health England • Damped population growth • 30% increase in resistance to CAZ-AVI • Infection site per clinician • Persistent population growth • 1% increase in resistance to CAZ-AVI Probabilistic sensitivity analysis with no CAZ-AVI resistance 193 to 9,079 68 to 2,468 Fewer QALYs More QALYs Source: EEPRU’s addendum 2, Table 7 and Figure 4
- 53. 53 Total population incremental net health effect ranged from 493 to 2,211 QALYs in EEPRU’s base case QALY ranges bounds reflect estimates of resistance to CAZ-AVI 30% to 1% Alternative base case assumptions Baseline population Population growth rate Patients initiating CAZ-AVI Incremental net health benefit QALYs PHE SGSS categorisation of infection sites Damped trend 7,280 531 to 673 Persistent growth 16,167 1,026 to 1,390 Clinical advisors’ categorisation of infection sites Damped trend 11,887 892 to 1,134 Persistent growth 26,397 1,719 to 2,342 Source: EEPRU’s addendum 2, Table 7 and Table 10
- 54. 54 Probabilistic sensitivity analysis QALYs ranged from 68 to 9,079 Figure: Distribution of total population incremental net health effects of CAZ-AVI (2,000 simulations) – based on most and least conservative estimates of population size, assuming no CAZ-AVI resistance Right hand side of distribution may capture high cost scenarios Source: EEPRU’s addendum 2, Figure 4 PHE + damped mean = 667 QALYs, range 68 to 2,458 Clinical advisors + persists mean = 2332 QALYs, range 193 to 9,079 ⦿ Does committee prefer deterministic or probabilistic?
- 55. 55 EEPRU’s scenario: probability patient has OXA-48 and susceptibility source Enterobacterales & relative effectiveness estimates deterministic ‘p_bug’: probability patient has OXA-48 Enterobacterales Scenario name Base case Scenario analysis Net health benefits QALYS Base case 677-2,364 p_bug_surve y Probability patient has OXA-48 Enterobacterales = 20% (PHE data) Probability = 57% (BSAC survey data, n=9 respondents) 881-3,109 p_bug_10 As above Probability = 10% 426-1,445 p_bug_30 Probability = 30% 907-3,203 p_bug_70 Probability = 70% 869-3,065 S2 Susceptibility based on network meta-analysis of EUCAST studies Susceptibility based on network meta- analysis 2 of all studies regardless of breakpoints (EUCAST & CLSI) 838-2,969 S3 As above Susceptibility based on PHE data 743-2,603 S4 As above Susceptibility based on Vasquez-Ucha et al (no MBL) 1,092-3,824 assuming no CAZ-AVI resistance, S2 to S4, Source: EEPRU’s addendum 2, Table 9 ⦿ Which scenarios appear most plausible? Given these uncertainties, what research would address these?
- 56. 56 EEPRU’s scenario results to capture value of being prepared for emergence of resistance, cUTI in microbiology directed setting Incremental benefit biggest in cUTI • Patient-level net health benefit in cUTI: 1.032 QALYs. In base case: 0.069 QALYs • Overall population-level results across all infection sites not reported because proportions in each group unknown Base case (blue box) and scenarios Probability of event 1% 0.5% 5% 1% 1% 1% 1% 1% 1% Event date (years from now) 10 10 10 5 15 10 10 10 10 Annual population size in year 1 25 25 25 25 25 100 25 25 25 Population growth (annual, from baseline) 20% 20% 20% 20% 20% 20% 3% 30% 20% Time horizon 50 50 50 50 50 50 50 50 20 Results Total number of patients 4,720 4,720 4,720 6,195 3,245 18,880 1,388 6,680 145 Total incremental net health benefit in QALYs conditional on event occurring 1460 1460 1460 2180 870 5839 452 2053 79 Expected incremental net health benefit QALYs 14.6 7.3 73.0 21.8 8.7 58.4 4.5 20.5 0.8 ⦿ Is the base case estimate plausible?
- 57. 57 EEPRU’s scenario results to capture value of being prepared for emergence of resistance, HAP/VAP in empiric setting Incremental benefit smallest in HAP/VAP • Patient-level net health benefit in HAP/VAP: 0.395 QALYs. In base case: 0.163 QALYs compared with non-colistin/aminoglycosides and 0.215 QALYs compared with colistin/aminoglycosides Base case (blue box) and scenarios Probability of event 1% 0.5% 5% 1% 1% 1% 1% 1% 1% Event date (years from now) 10 10 10 5 15 10 10 10 10 Annual population size in year 1 25 25 25 25 25 100 25 25 25 Population growth (annual, from baseline) 20% 20% 20% 20% 20% 20% 3% 30% 20% Time horizon 50 50 50 50 50 50 50 50 20 Results Total number of patients 4,720 4,720 4,720 6,195 3,245 18,880 1,388 6,680 145 Total incremental net health benefit in QALYs conditional on event occurring 560 560 560 836 334 2,241 173 788 30 Expected incremental net health benefit QALYs 5.6 2.8 28 8.4 3.3 22.4 1.7 7.8 0.3 ⦿ Is the base case estimate plausible?
- 58. 58 EEPRU’s scenario results on subgroup with contraindication to colistin/aminoglycoside population level • Benefits compared to base-case higher in microbiology-directed (cUTI and IAI) than empiric setting (HAP/VAP and BSI) because patient-level benefit of CAZ-AVI in patients who cannot take colistin is higher in microbiology-directed than empiric setting • EEPRU considers results may overestimate total benefits because • 20%-40% high compared to EEPRU’s advisers estimates • scenario assumes comparable outcomes in patients who can and cannot take colistin but may not be the case in practice • Scenario assumes patients would be contraindicated to colistin and aminoglycosides but concern mostly about colistin Proportion who cannot take colistin/aminoglyc . HAP/VAP cUTI BSI IAI Total 0% (base-case)* 66 - 946 83 - 274 444 - 916 36 - 75 629 - 2,211 20% 102 – 1,546 174 - 619 683 – 1,499 76 - 169 1,035 – 3,833 40% 137 – 2,147 265 - 965 922 – 2,081 116 - 263 1,441 – 5,456 Ranges represent 2 scenarios regarding population size and growth: PHE+damped, clinical experts+ persistent
- 59. 59 Additional elements of value ‘STEDI’ values
- 60. 60 Spectrum Value Benefits of a new antimicrobial replacing broad spectrum antimicrobials, reducing problems associated with their overuse Potential source of additional benefit Modelled? Rationale Reduced colonisation with drug-resistant bacteria reduced drug-resistance in future No CAZ-AVI has a broad spectrum of activity Company’s approach: • Not included ⦿ Does committee consider this drug broad or narrow spectrum? Uncaptured benefit?
- 61. 61 Transmission Value Benefits of a new antimicrobial reducing the rate of transmission of a given pathogen from patients treated with that product to other individuals, potentially reducing rate of resistant infection Potential source of additional benefit Modelled ? Rationale for excluding Reduced number of resistant infections No Challenging to model, drivers of transmission broad, driven by transmission beyond high value clinical scenarios. Clinical advisers: transmission value not key driver of incremental benefits, as CAZ-AVI has small impact on hospital stay and doesn’t eradicate colonisation. Company’s approach: • Included in model: assumes antimicrobial treatment can completely eradicate patients of colonisation and CAZ-AVI increases the likelihood of this reduced transmission ⦿ Is it realistic that CAZ-AVI would eradicate colonisation completely? Impact on the likelihood of an outbreak of antimicrobial resistance and its spread? Is transmission value an uncaptured benefit?
- 62. 62 Enablement Value Enabling wards to stay open, medical procedures with ‘safety net’ of antimicrobials Potential source of additional benefit Included in model? Rationale for excluding/additional comment if included Improved treatment of post- operative infections Yes Improved treatment of pre-operative infections Partially Partially quantified in HVCSs and extrapolation to expected usage. Increasing the number of procedures that can go ahead No Could drive benefits if risk of multidrug resistant infection influences decision to operate– not modelled due to uncertainty in number of patients and consequences Ability to keep wards open during an outbreak No EEPRU considered unlikely that CAZ-AVI will keep ward open most patients have other treatment options Reduced use of resources enabling procedures and healthcare for other patients Yes Where possible, impact on resource use captured. When calculating population net benefit, cost savings converted to health benefits Company’s approach: • Partially captured.
- 63. 63 Enablement Value – Consultation comments Pfizer: • EEPRU’s definition is too narrow. Enablement value goes beyond direct use of CAZ-AVI and links to its impact on antimicrobial resistance. Clinical expert: • Enablement value already observed now, particularly in cystic fibrosis where timely use of CAZ-AVI may contribute towards enabling lung transplantation. Also relevant to growing numbers of other immunocompromised patient populations. Shionogi • Several aspects of enablement value are acknowledged but not captured. In particular the benefit of increasing number of viable procedures. ⦿ How significant is being able to keep wards open? To being able to do procedures? Is there uncaptured benefit?
- 64. 64 Diversity Value Benefits of new antimicrobials adding to the range of treatments currently available, potentially reducing selection pressure on and resistance to other available treatments Potential source of additional benefit Modelled? Rationale for excluding/additional comment if included Reduce selection pressure on and resistance to other available treatments No Within high value clinical scenarios: • Diverse prescribing strategies inappropriate given lack of safe and effective alternative treatments Outside high value clinical scenarios: • CAZ-AVI should NOT be used as part of diverse prescribing strategies to avoid resistance to CAZ-AVI. • Uncertainty about how reduced use of comparators will impact resistant to comparators Company’s approach: • Included diverse prescribing strategies
- 65. 65 Diversity Value – Consultation comments Pfizer • Diversification prolongs efficacy of existing antimicrobials, and introducing a new antimicrobial (CAZ-AVI) increases the effectiveness of diversification BSAC and RCPath • NHS Trusts are put under pressure to avoid prescribing carbapenems Shionogi • Argument that diversity will result in a net zero benefit due to countervailing effects seems counter-intuitive and contradictory to the identification of diversity value as a potential uncaptured benefit • Scientific rationale for diverse prescribing widely accepted ⦿ Is diversity value an uncaptured benefit? If so, what magnitude?
- 67. 67 Comparing company and EEPRU economic models (1) Element Company EEPRU (patient-level) Setting 1,000 patients in single hospital infectious environment. Results scaled-up to reflect 93,432 beds being occupied over a 10-year horizon. Patient-level: 2 settings, microbiology- directed setting and empirical setting treatment Structure Multi-state disease transmission model Forecast-based approach, structure differs according to empiric treatment or microbiology-directed Treatment pathways 20% of patients have confirmed pathogen-resistance mechanisms before treatment and receive microbiology-directed treatment 1st line 80% start treatment empirically All patients treated empirically first Pathogen- mechanism E coli, K pneumoniae, P aeruginosa Several mechanisms of resistance (not specified) Enterobacterales with OXA-48 mechanism of resistance Site cIAI, cUTI and HAP/VAP cUTI and HAP/VAP Intervention CAZ-AVI monotherapy as additional 3rd line treatment compared with a ‘non-diversified’ 2-line treatment sequence made up of existing drugs CAZ-AVI monotherapy Comparators • meropenem (all indications) • piperacillin/tazobactam (for cIAI and cUTI) • colistin (for HAP/VAP) • Some of company’s comparators: meropenem + colistin and/or other antimicrobials, colistin + other antimicrobials; range of comparators
- 68. 68 Comparing company and EEPRU economic model (2) Element Company EEPRU (patient-level) Outcomes Deaths, number Infections, number Patients eligible for CAZ-AVI, number Life years/QALYs lost from infection Death Survival no acute kidney injury Survival acute kidney injury Survival chronic kidney disease Life years and QALYs Elements of value Diversity value and transmission included Insurance and enablement value partially included Insurance (being prepared) quantified Enablement value partially quantified Transmission, spectrum and diversity value not quantified Study designs Randomised controlled trials Observational studies National and international datasets Susceptibility studies for effectiveness Other outcomes from observational data, meta-analyses, national datasets, RCT, structured expert elicitation Threshold cost to health benefits £30,000/QALY £20,000/QALY QALY: Quality-adjusted life years, AKI: Acute kidney injury, CKD: Chronic kidney disease,
- 69. 69 Company used data from randomised controlled trials to inform treatment efficacy in its economic model RECLAIM trials and ANDI trial investigated CAZ-AVI in combination with metronidazole. All others focus on CAZ-AVI alone Source: Company’s submission Table 45 CAZ-AVI: ceftazidime/avibactam; cIAI: complicated intra-abdominal infection; cUTI: complicated urinary tract infection; HAP: hospital-acquired pneumonia; VAP: ventilator-associated pneumonia. Trial Design Comparator Population Endpoint REPROVE Non- inferiority meropenem Adult HAP/VAP Proportion of clinically cured patients RECAPTUR E 1 and 2 Non- inferiority doripenem Adult cUTI Proportion of patients with symptomatic resolution of UTI-specific symptoms and both microbiological eradication and symptomatic resolution of UTI-specific symptoms RECLAIM 1 and 2 Non- inferiority meropenem Adult cIAI (global) Proportion of clinically cured patients RECLAIM 3 Non- inferiority meropenem Adult cIAI (Asian) Same as RECLAIM 1 and 2 REPRISE Superiority best available therapy Adult cUTI or cIAI Proportion of patients with clinical response (cure, failure, or indeterminate)
- 70. 70 Company model results Results show effect of adding CAZ-AVI as additional 3rd-line treatment: comparing with a ‘non- diversified’ 2-line treatment sequence made up of existing drugs Source: Adapted from company’s submission, table 62, QALY: Quality adjusted life years Company’s estimates based on a cost-effectiveness threshold of £30,000/QALY Model drivers: treatment efficacy, discount rate applied, utility values (health-related quality of life) after infection is cured/naturally resolves, life expectancy and the transmission and clearance rates Infection Treatment QALYs lost due to infection Incremental costs (£) Incremental QALY gains cUTI CAZ-AVI 3,392 9034.97 5,529 No CAZ-AVI 8,921 cIAI CAZ-AVI 1,687 827.25 4,747 No CAZ-AVI 6,434 HAP/VAP CAZ-AVI 10,090 5968.55 10,211 No CAZ-AVI 20,302 All above combined CAZ-AVI 15,169 15830.78 20,487 No CAZ-AVI 35,657
- 71. 71 EEPRU concerns with company model • Captures a much bigger and inappropriate population, including all Escherichia coli, Klebsiella pneumoniae and Pseudomonas aeruginosa • Assumes 20% of patients have known resistance and receive microbiology-directed treatment 1st line • EEPRU’s clinical advice is that most patients start with empiric treatment • Assumes complete eradication of colonisation with any pathogen, and CAZ-AVI increases the likelihood of this occurring • EEPRU assume patient can develop same infection again because pathogen stays dormant in gut, which can result in further transmission • Incremental QALYs for CAZ-AVI driven by differences in mortality, but unclear how company obtained these results • overestimates health losses from mortality overestimates benefits of CAZ-AVI • Use of 2-line comparator treatment sequence not clearly justified or supported by evidence ⦿ What is the committee’s view on company’s modelling?
- 72. 72 Decision to be made in part 2 © NICE 2022. All rights reserved. Subject to Notice of rights.
Editor's Notes
- Source: CAZ-AVI assessment report Section 7.2.5.1 (p141)
- Source: CAZ-AVI report p141-144 and figure 20
- Source: CAZ-AVI report p141-144 and figure 20
- Source: CAZ-AVI report p144-148
- Source: CAZ-AVI report p175-178 and table 43
- Source: CAZ-AVI report p175-178 and table 43
- Source: CAZ-AVI report p175-178 and table 43
- Source: CAZ-AVI report p175-178 and table 43
- Source: CAZ-AVI report p175-178 and table 43
- Source: CAZ-AVI report p141-144 and figure 20
- Source: CAZ-AVI report p151-157 and figure 21
- Source: CAZ-AVI report p144-148 (and appendices 15-17)